Sangfor Cyber Command User Manual_v3.0.81
Installation Guide
- This part mainly introduces the hardware installation of Sangfor Cyber Command devices. After successful installation, the Cyber Command can be configured and debugged.
Environment Requirement
The Cyber Command shall be used in the following environment:
| Cyber Command Model | CC-1000 | CC-2000 | CC-3000 |
|---|---|---|---|
| Maximum power: | 550W | 550W | 550W |
| Temperature: | 10-35℃ | 10-35℃ | 10-35℃ |
| Humidity: | 35%-80% | 20%-80% | 35%-80% |
| Size (lengthwidthheight) | 735mm447mm88mm | 735mm447mm88mm | 735mm447mm88mm |
Environment Requirement
For the system’s long-term and stable operation, please ensure that the power supply is grounded properly, dust prevention, good ventilation, and consistent temperature in the operating environment. This product complies with the design requirements for environmental protection. Its placement, usage, and disposal shall comply with relevant national laws and regulations where it is applied.
Power Supply
The Sangfor Cyber Command series is supplied with 110V – 230V AC power. Before powering on, please make sure the power supply has good grounding measures.
Product Interface Description
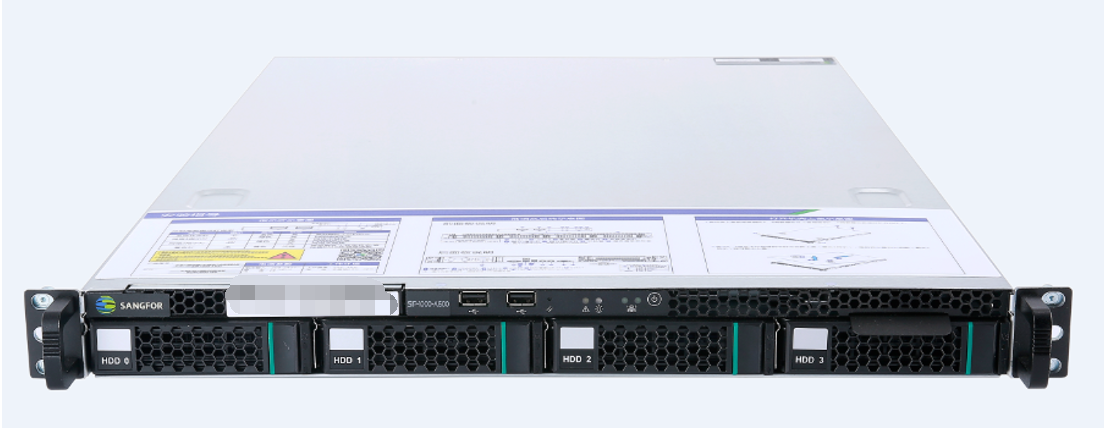
Cyber Command:

| Device name | No. | Network interface No. | Network interface type |
|---|---|---|---|
| CC-1000-A600 | 1 | ETH1 | Gigabit electrical interface |
| CC-1000-A600 | 2 | ETH2 | Gigabit electrical interface |
| CC-1000-A600 | 3 | ETH3 | Gigabit electrical interface |
| CC-1000-A600 | 4 | ETH4 | Gigabit electrical interface |
| CC-1000-A600 | 5 | ETH5 | Gigabit electrical interface |
| CC-1000-A600 | 6 | ETH6 | Gigabit electrical interface |
Note: The picture is for reference only. Please refer to the actual product for the appearance of different models.
The CONSOLE interface is for development, testing, and debugging purposes only. It required to use a network interface to access to the web console.
Configuration and Management
Before configuring the Cyber Command device, ensure you have a computer with functioning browsers (such as Chrome or Firefox). The Sangfor Cyber Command shall be configured in the same LAN as the computer.
The management interface of the Cyber Command device is MANAGE (ETH0), with a factory default IP address of 10.251.251.252/24. When logging into the device for the first time, connect the MANAGE (ETH0) interface to the LAN using a network cable or directly to the computer.
Wiring Method for Devices
Plug the power cable into the device’s rear panel, then turn on the power supply. At this time, the power indicator (green) and alert indicator (red) in the front panel will be on. The alert indicator will go out in one or two minutes, indicating the gateway is working.
Connect the MANAGE (ETH0) interface to the LAN using a standard RJ-45 Ethernet cable, and then configure the Cyber Command and STA Devices.
After logging in to the control panel, perform configuration and wiring according to the network environment and deployment requirements.
-
When the device is working, the POWER indicator and LINK indicator of the data port for wiring stay on. The ACT indicator constantly blinks when there is data traffic. The ALERT indicator keeps red (for about one minute) only when the system is loading after startup and goes out when the system is working. If the indicator keeps red during installation, please switch off the power supply and reboot the device. If it is still on after a reboot, please contact us.
-
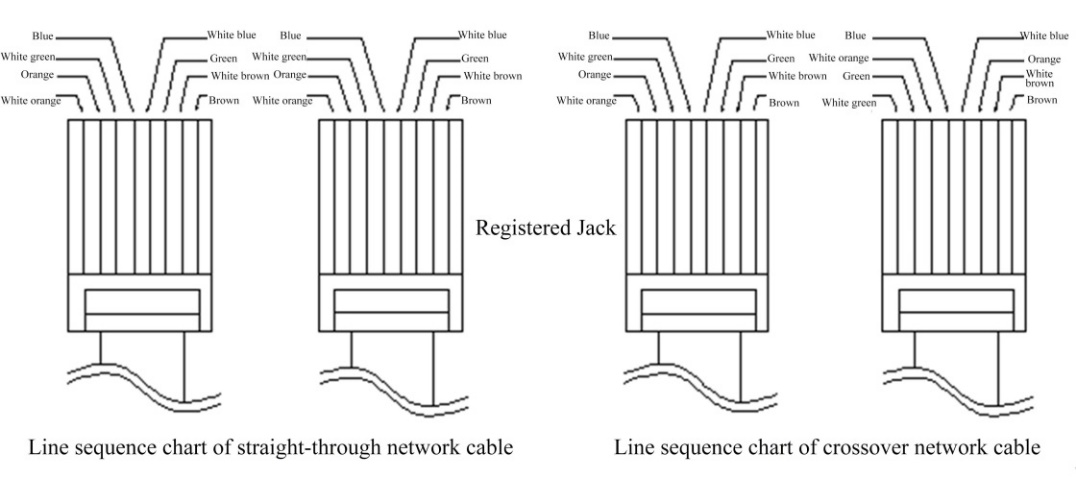
The network interface connects the modem with the switch via straight-through cables while connecting the router to the computer via crossover cables. If the connection fails despite normal indicator status, please check whether the cables are being used correctly. The difference between the straight-through network cable and the crossover network cable lies in the wire sequence at both ends of the cables as follows:
Usage of Console
This part mainly introduces the products and hardware installation of the Sangfor Cyber Command (CC). After successful installation, the Cyber Command can be configured and debugged.
Logging in to Web UI Configuration Interface
Configuration and Management
The table below shows the device’s factory default IP address.
| Interface | IP Address |
|---|---|
| ETH0 | 10.251.251.252/24 |
The Cyber Command device only supports secure HTTPS login, adopting its standard port (port 443) of HTTPS protocol.
Note: The Chrome and Firefox browsers are recommended for logging in to the Cyber Command platform.
Logging in to the Console Page
Connect the computer network card and Cyber Command device ETH0 port to the same layer 2 Gigabit Switch, or directly connect the ETH0 port to the computer network card via a network cable. Configure the Sangfor Cyber Command on the WEB interface. The method is as follows:
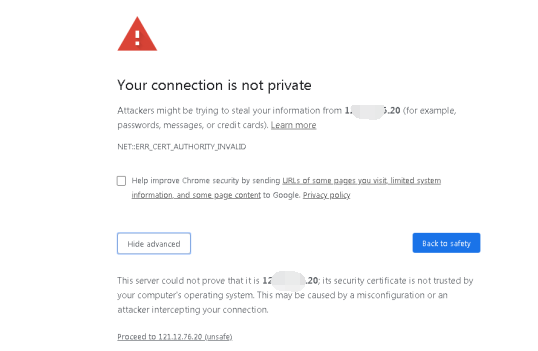
Firstly, configure an IP of network segment 10.251.251.X for the local unit (such as IP address: 10.251.251.100, netmask: 255.255.255.0). Then enter the Cyber Command’s default login IP address and port: https://10.251.251.252 in the Chrome browser. A security prompt will appear, as shown below:
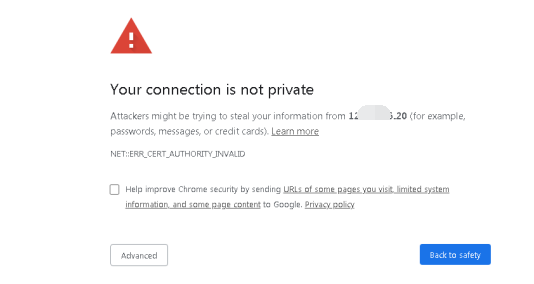
Click Advanced > Proceedto 10.251.251.252 (unsafe).
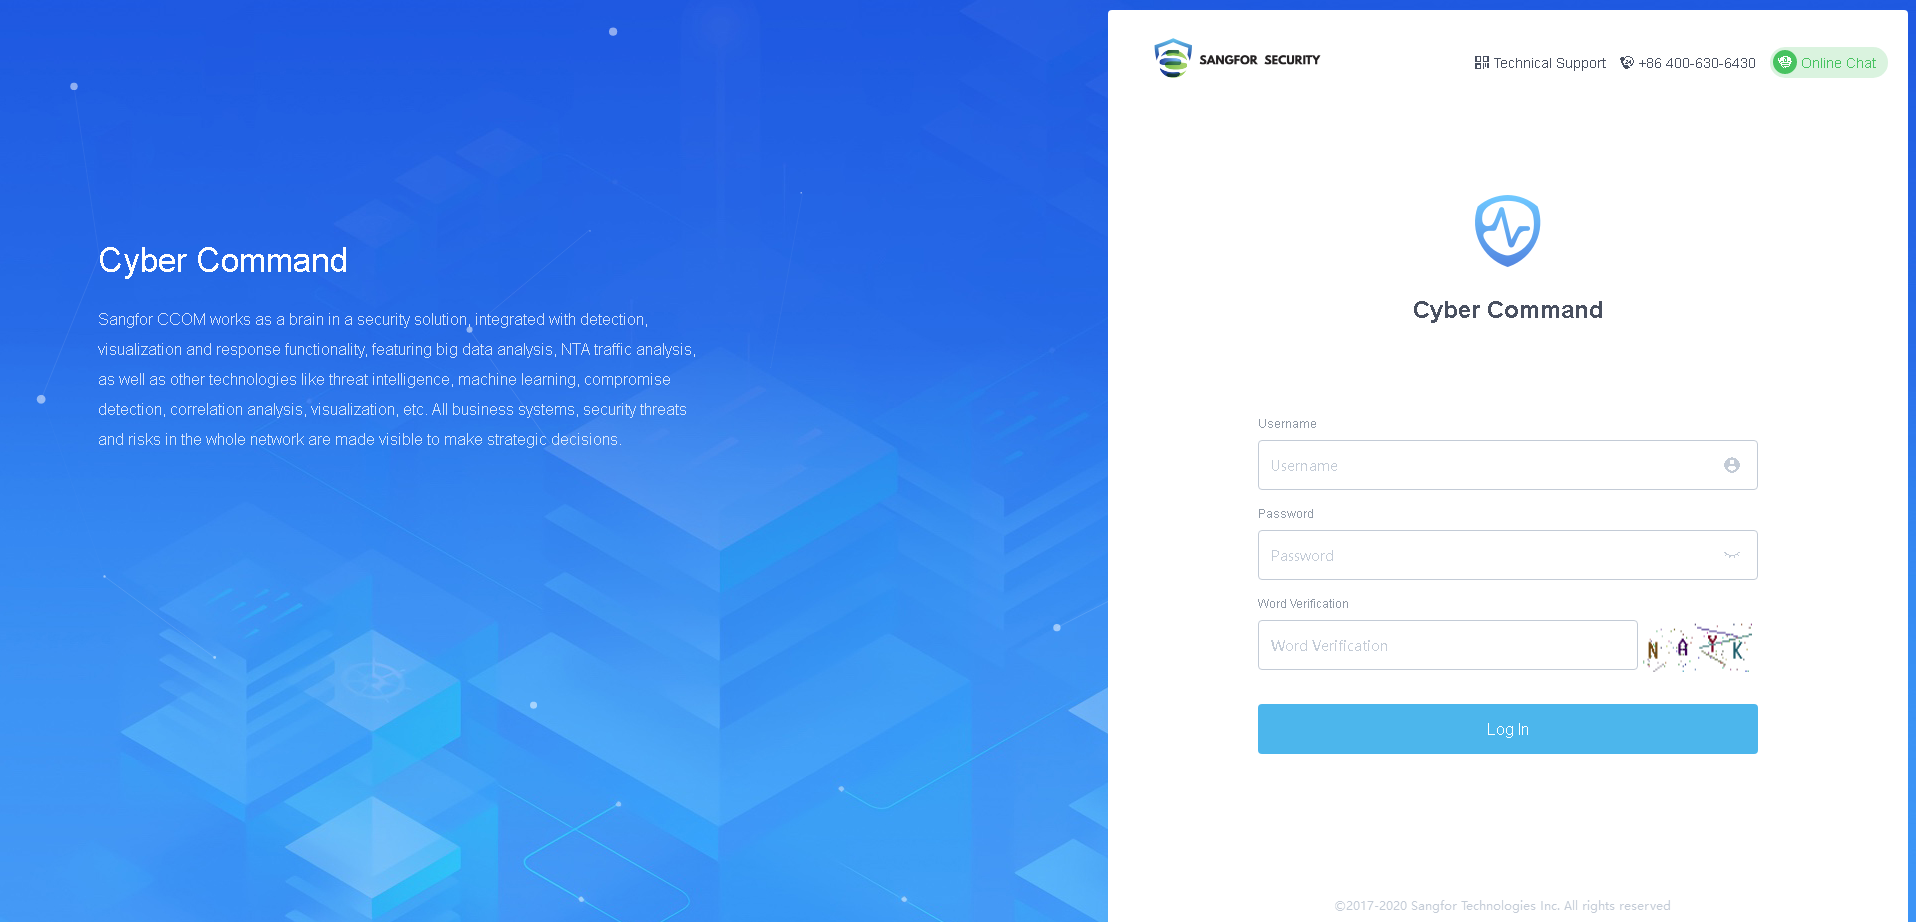
Enter the Username and Password. Then click the Login button to log in to the Cyber Command device for configuration. By default, the username/password is admin/admin.
Configuration and Usage
Configuration and Usage of Cyber Command Console
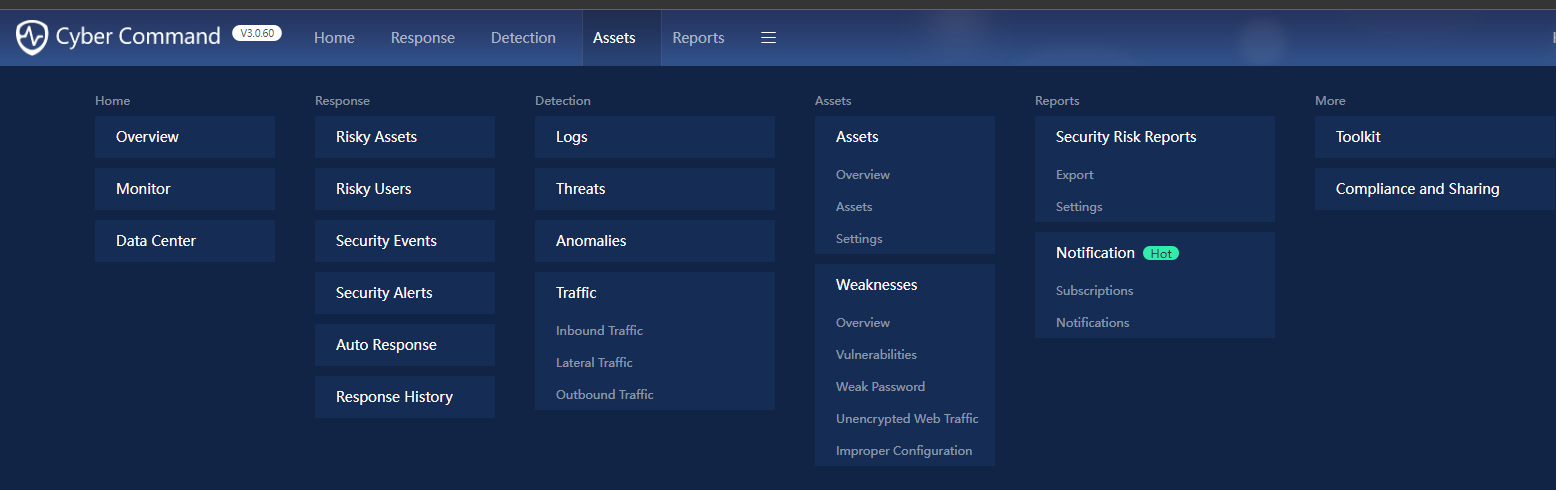
Log in to the Web UI configuration page. You will see the following configuration modules: Home,Response,Detection,Assets, Reports,Navigation, Holistic, and More.
Holistic:Used for unfolding branch information.
All icons on the configuration page display a brief description of the current configuration item when the mouse cursor is placed over them.
Note: The holistic module will only be displayed after the branch is configured.
Description of Cyber Command Function
Home
Overview
Comprehensive Security Intelligence
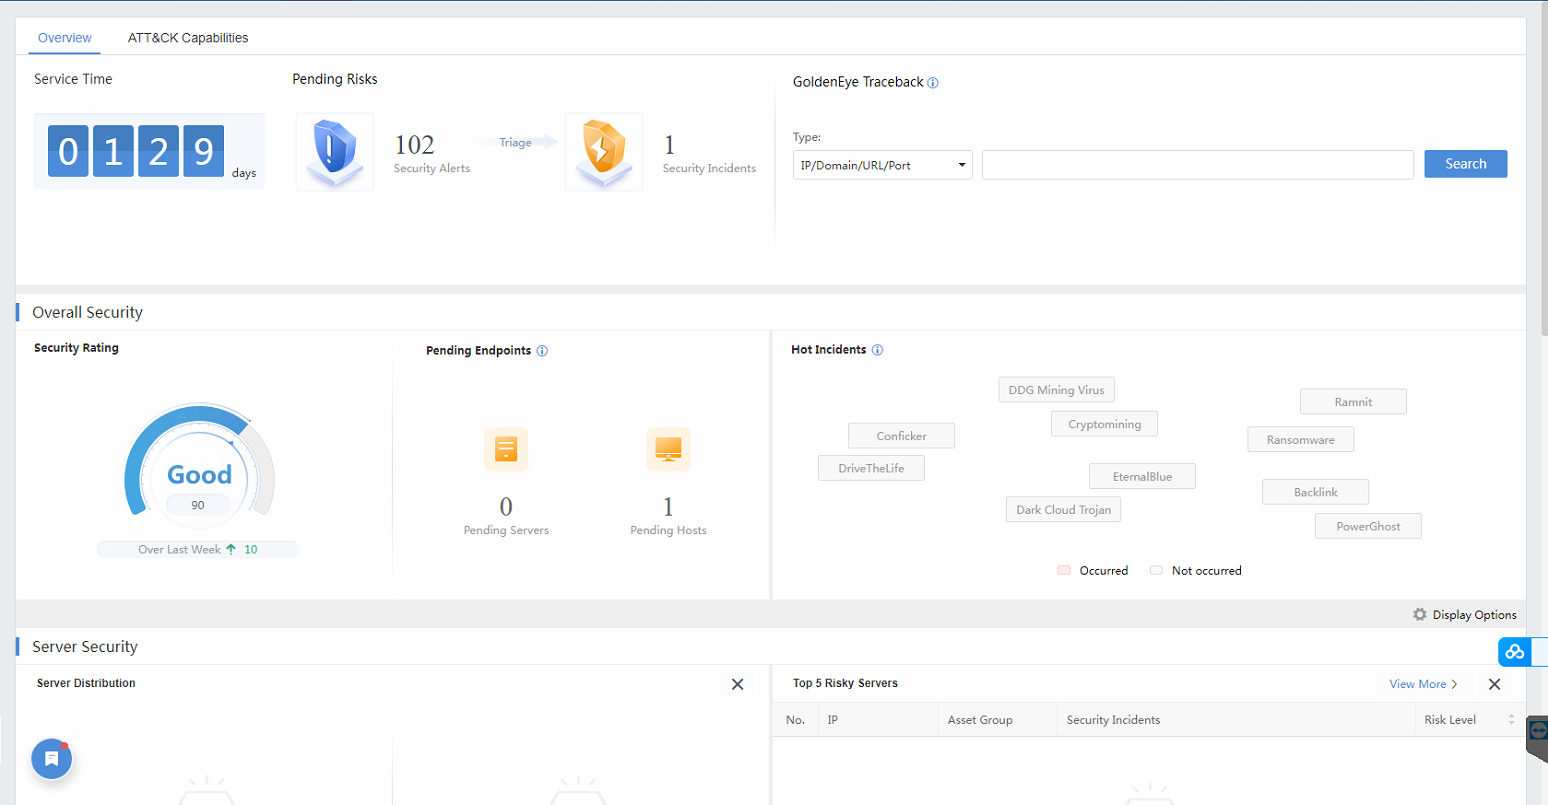
The comprehensive security intelligence displays the general and current situation of Cyber Command, including new events (30 days), fixed and unfixed events, Security Rating, Pending Endpoints, GoldenEye Traceback, and Hot Incidents. You can set the overview module’s display in the Display Options at the bottom right of the interface.
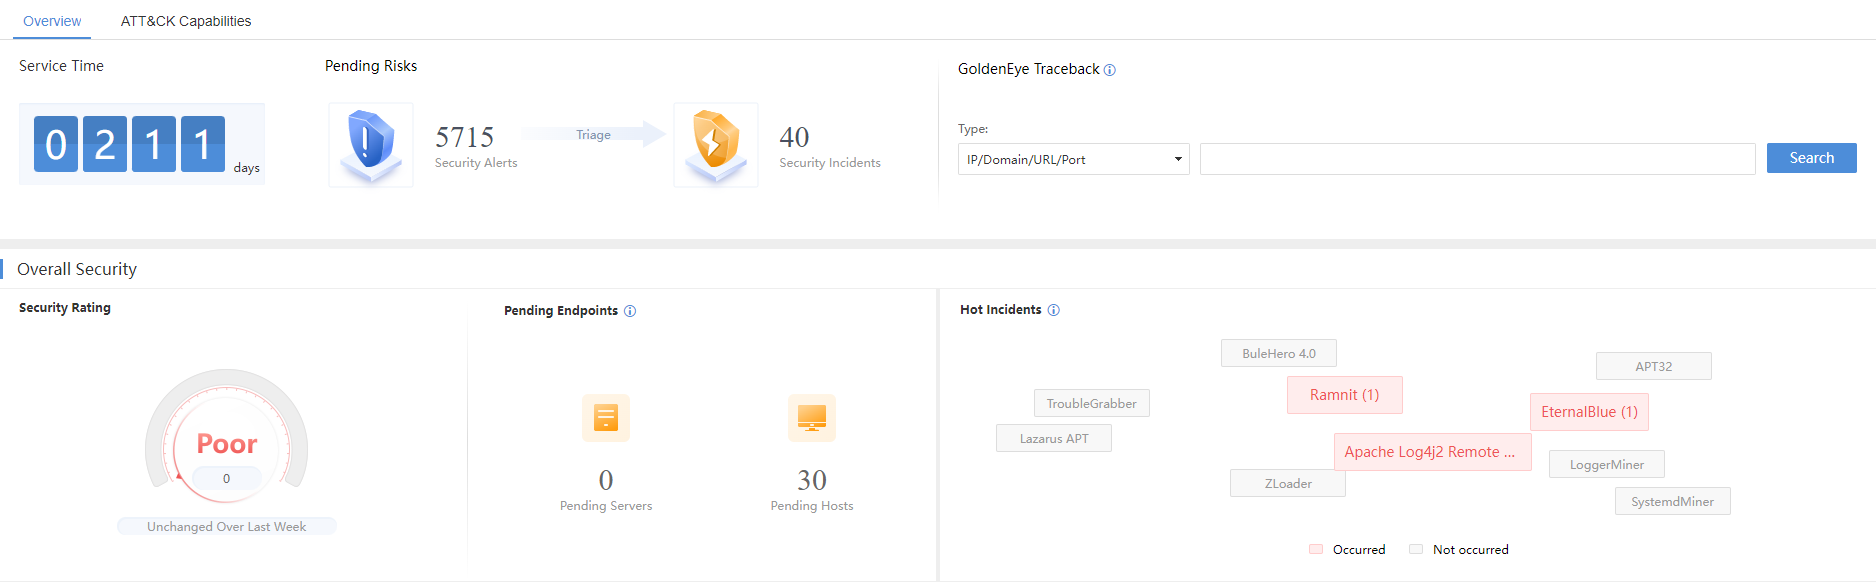
Security Rating:Display the current network rating by giving a score (maximum 100). Score levels include excellent (91-100), good (81-90), fair (61-80), and poor (60 or less). The following table shows the default rating standard:
| Entity | Point Reduction | Max Reduction |
|---|---|---|
| Compromised Endpoint | 10 | 100 |
| High Risk Endpoint | 3 | 39 |
| Medium Risk Endpoint | 2 | 19 |
| Low Risk Endpoint | 1 | 9 |
| Very-Low Risk Endpoint | 0.1 | 2 |
Security Rating
You can customize the security rating standard. When the cursor is placed over the rating, you will see the following picture:
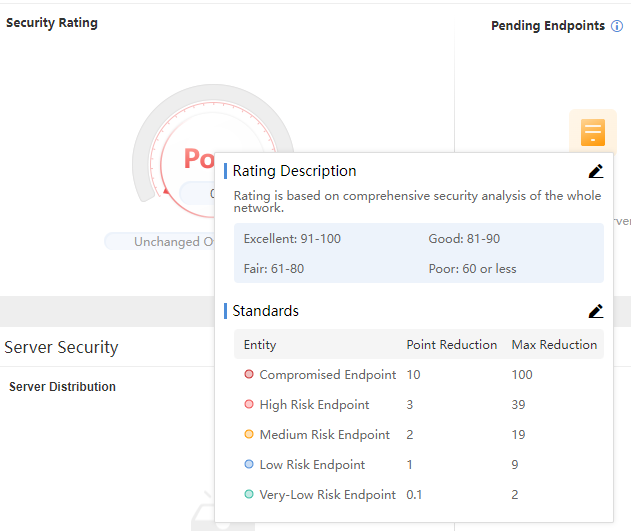
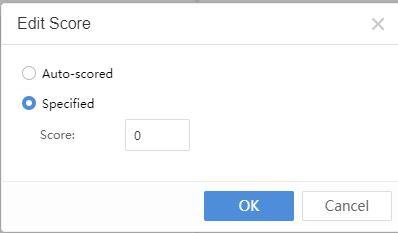
Click the icon next to the Rating Description to select Auto-scored or Specified, as shown below:
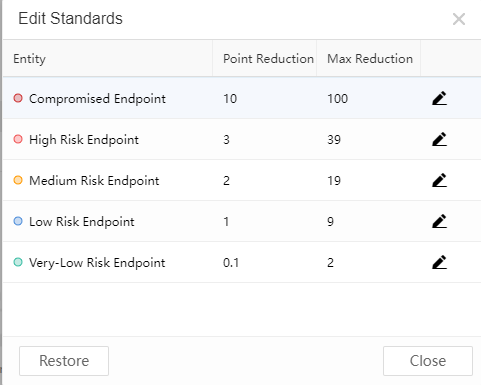
Click the icon next to the Standardsto modify the rating standard, and click OK to submit, as shown below:
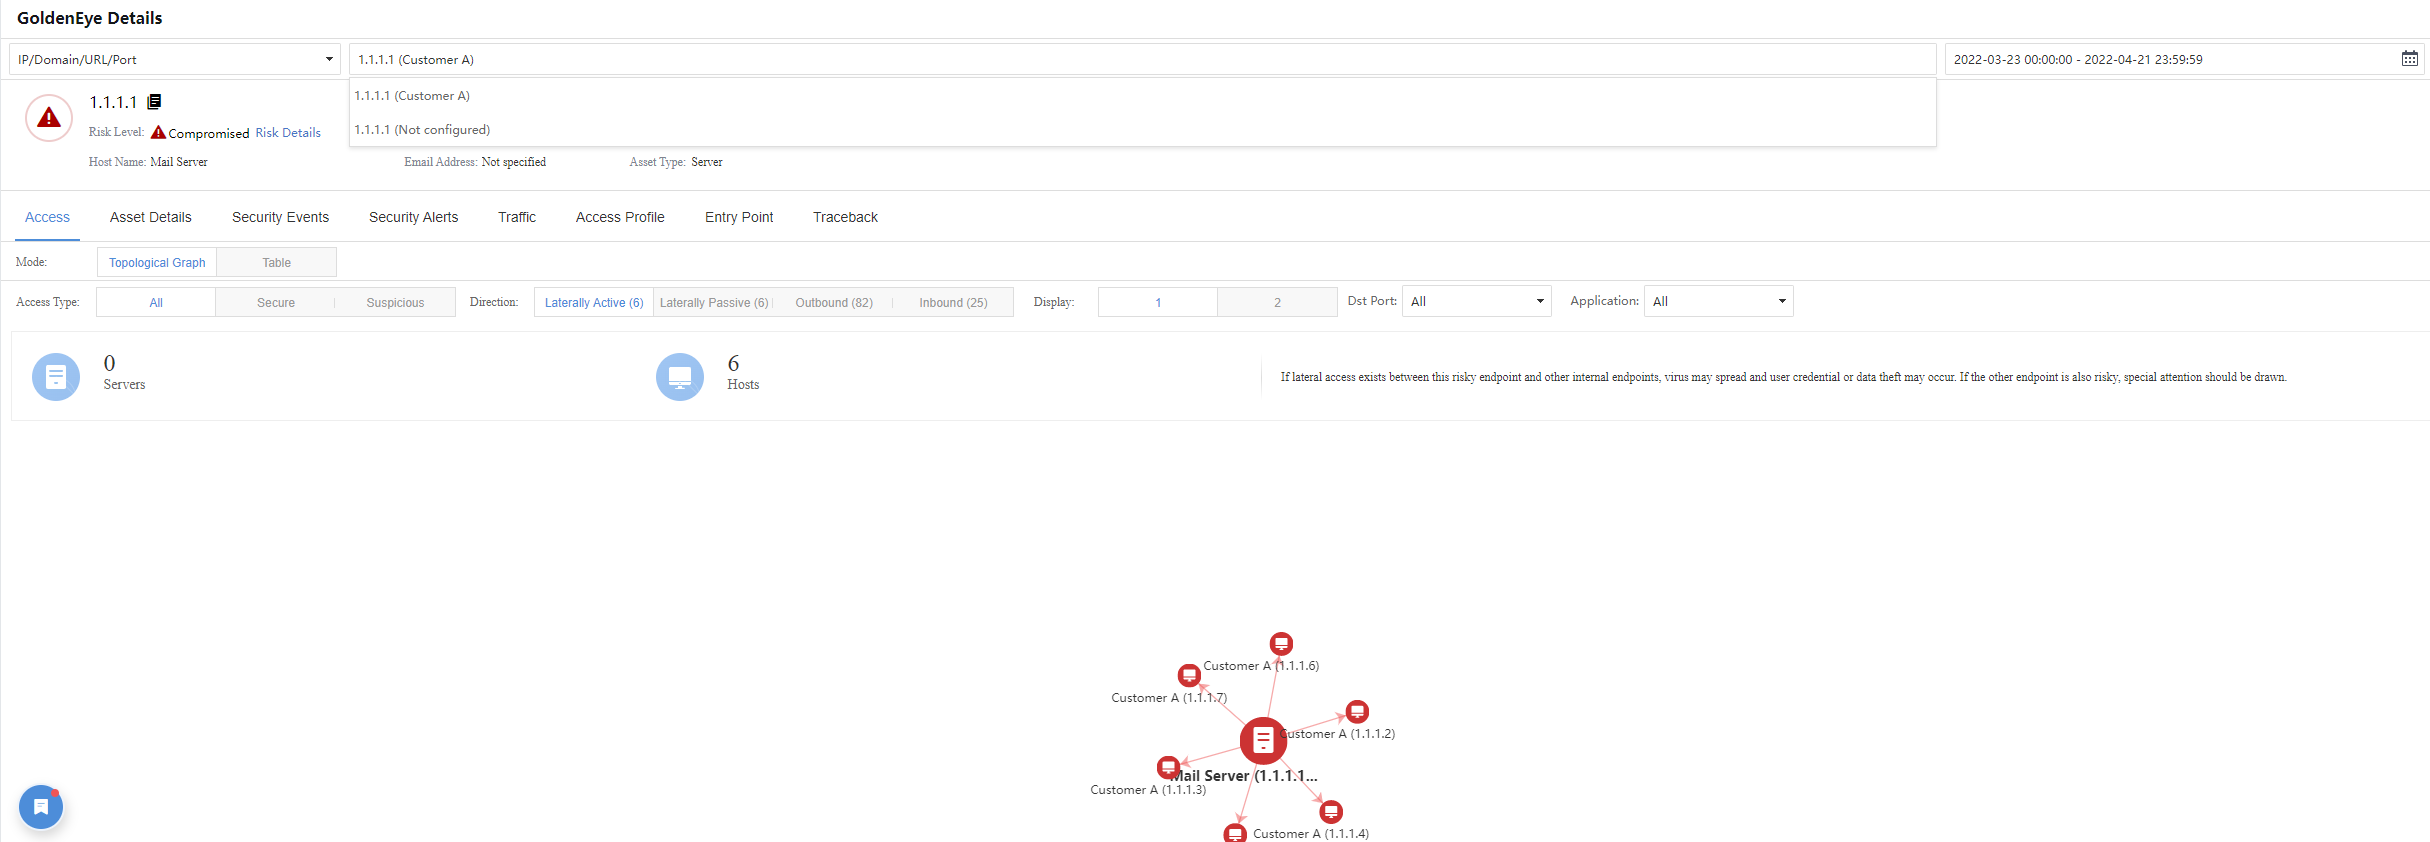
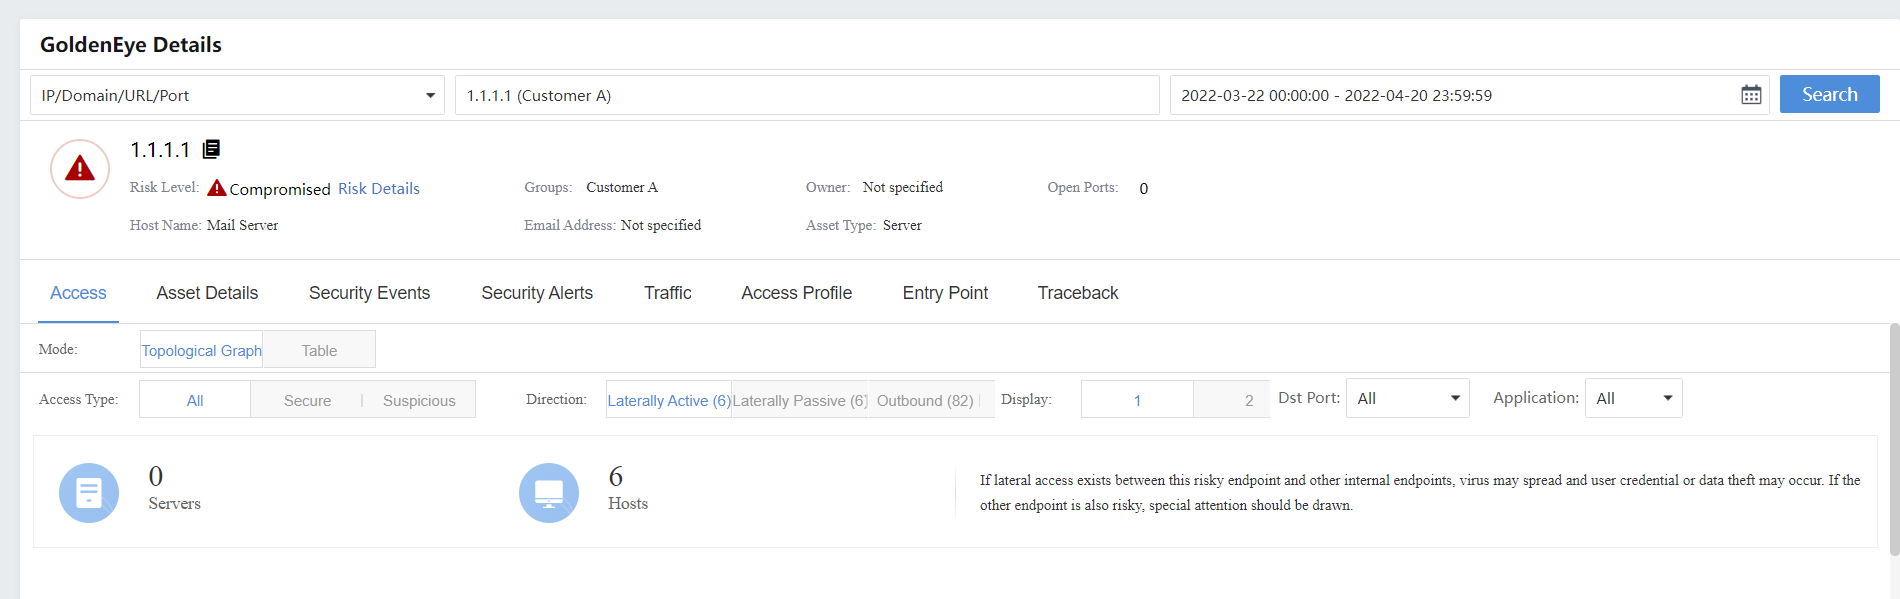
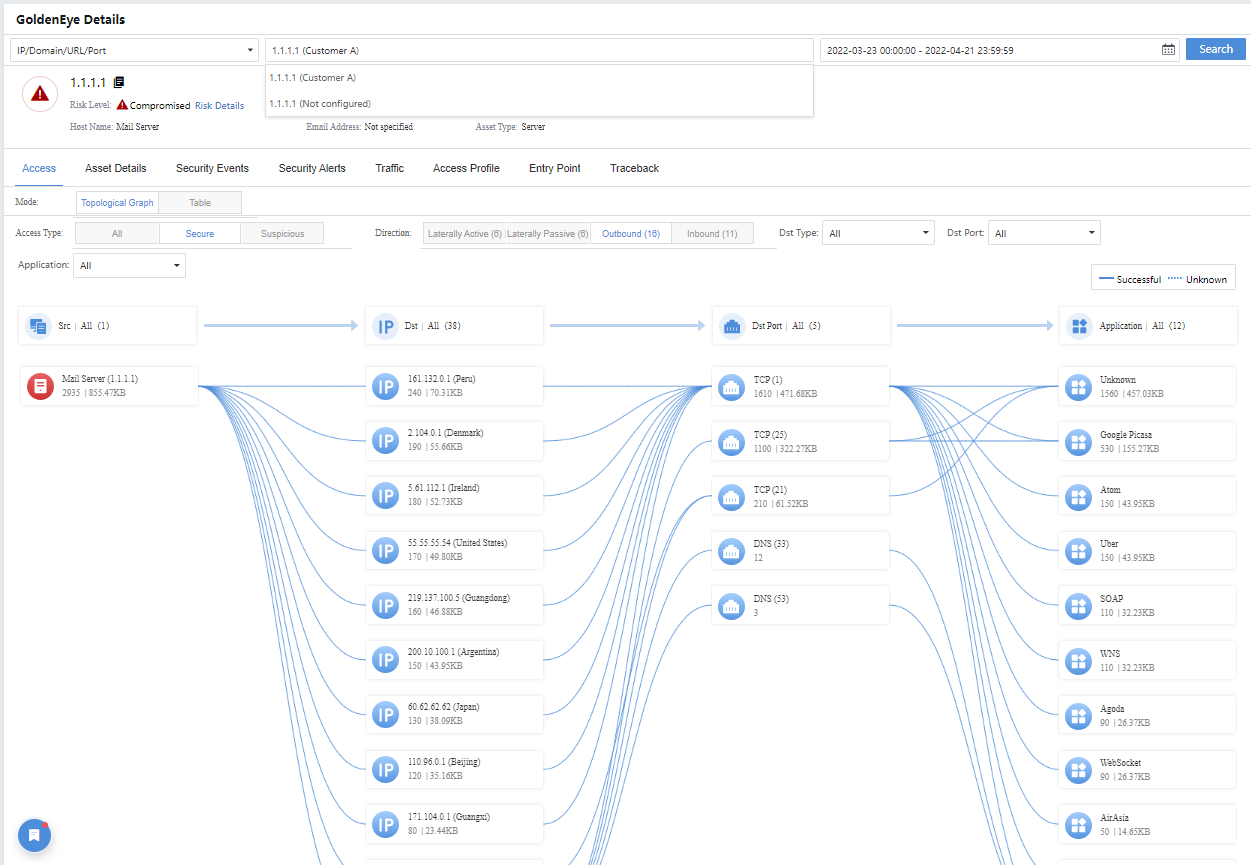
GoldenEye Traceback:A search and tracking tool integrating access relation, UEBA, and host overview. It can perform a search when finding risky hosts or malicious domains. See chapter 3.1.3 for details.
Hot Incidents:Display recent hot incidents in the cyber security industry and rapidly perceive whether they affect the network.
Display Options:Customize contents displayed in the overview.

Server Security
It statistically displays the distribution of business system security, including compromised, high-severity, medium-severity situations, and Top 5 risky servers.
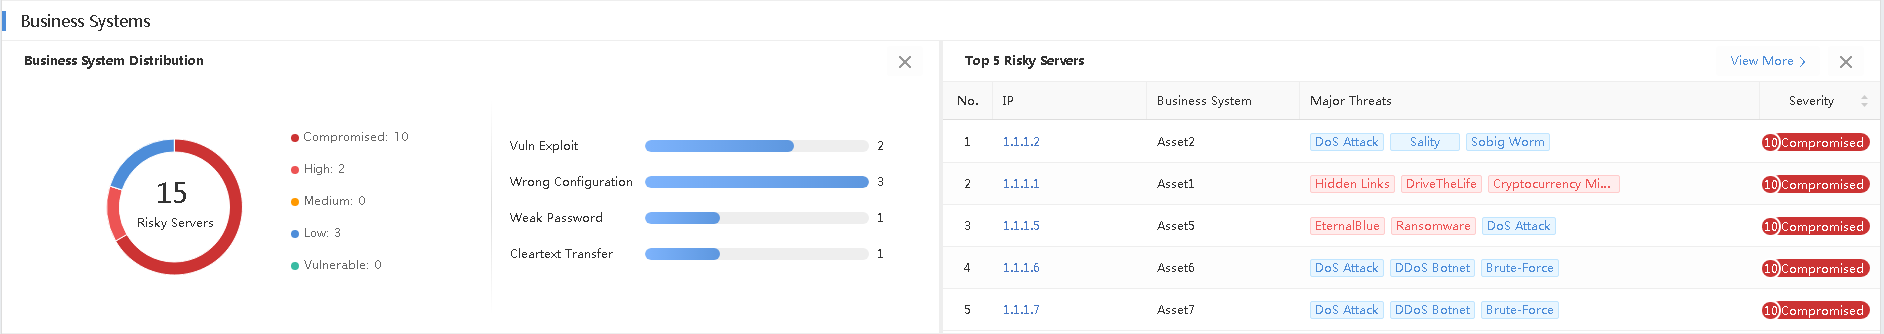
Server Distribution: Count the number of compromised, high-severity, medium-severity, low-severity, and vulnerable servers in the current network, as well as the vulnerability situation of risky servers, including vulnerability, configuration risks, weak password, and cleartext transfer.
Top 5 Risky Servers: Rank the Top 5 risky servers by risk level. Servers with risk levels after the Top 5 are ranked randomly. Click View More>Response > Risky Assets to see more.
Host Security
It statistically displays the distribution of host security status, including compromised, high, medium, low, and Top 5 risky hosts.
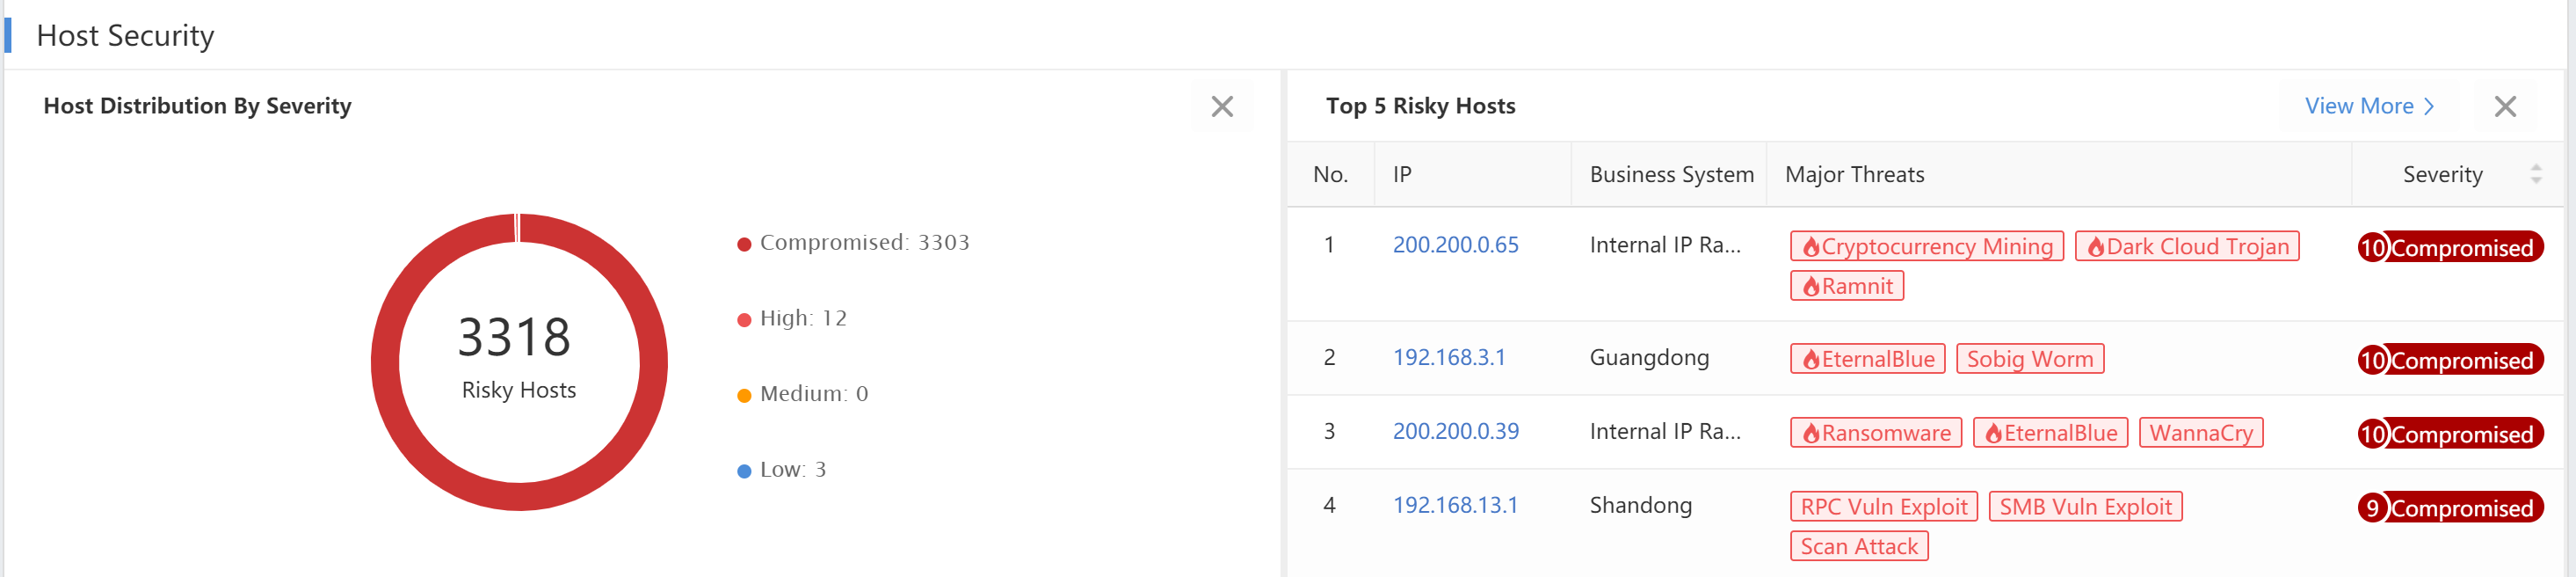
Host Distribution: Count the number of compromised, high, medium, and low-severity hosts in the current network.
Top 5 Risky Hosts:Rank the Top 5 risky hosts by risk level. Hosts with risk levels after the Top 5 are ranked in random order. Click View More > Response > Risky Assets to see more.
Assets
It statistically displays discovered servers and endpoints in the network.
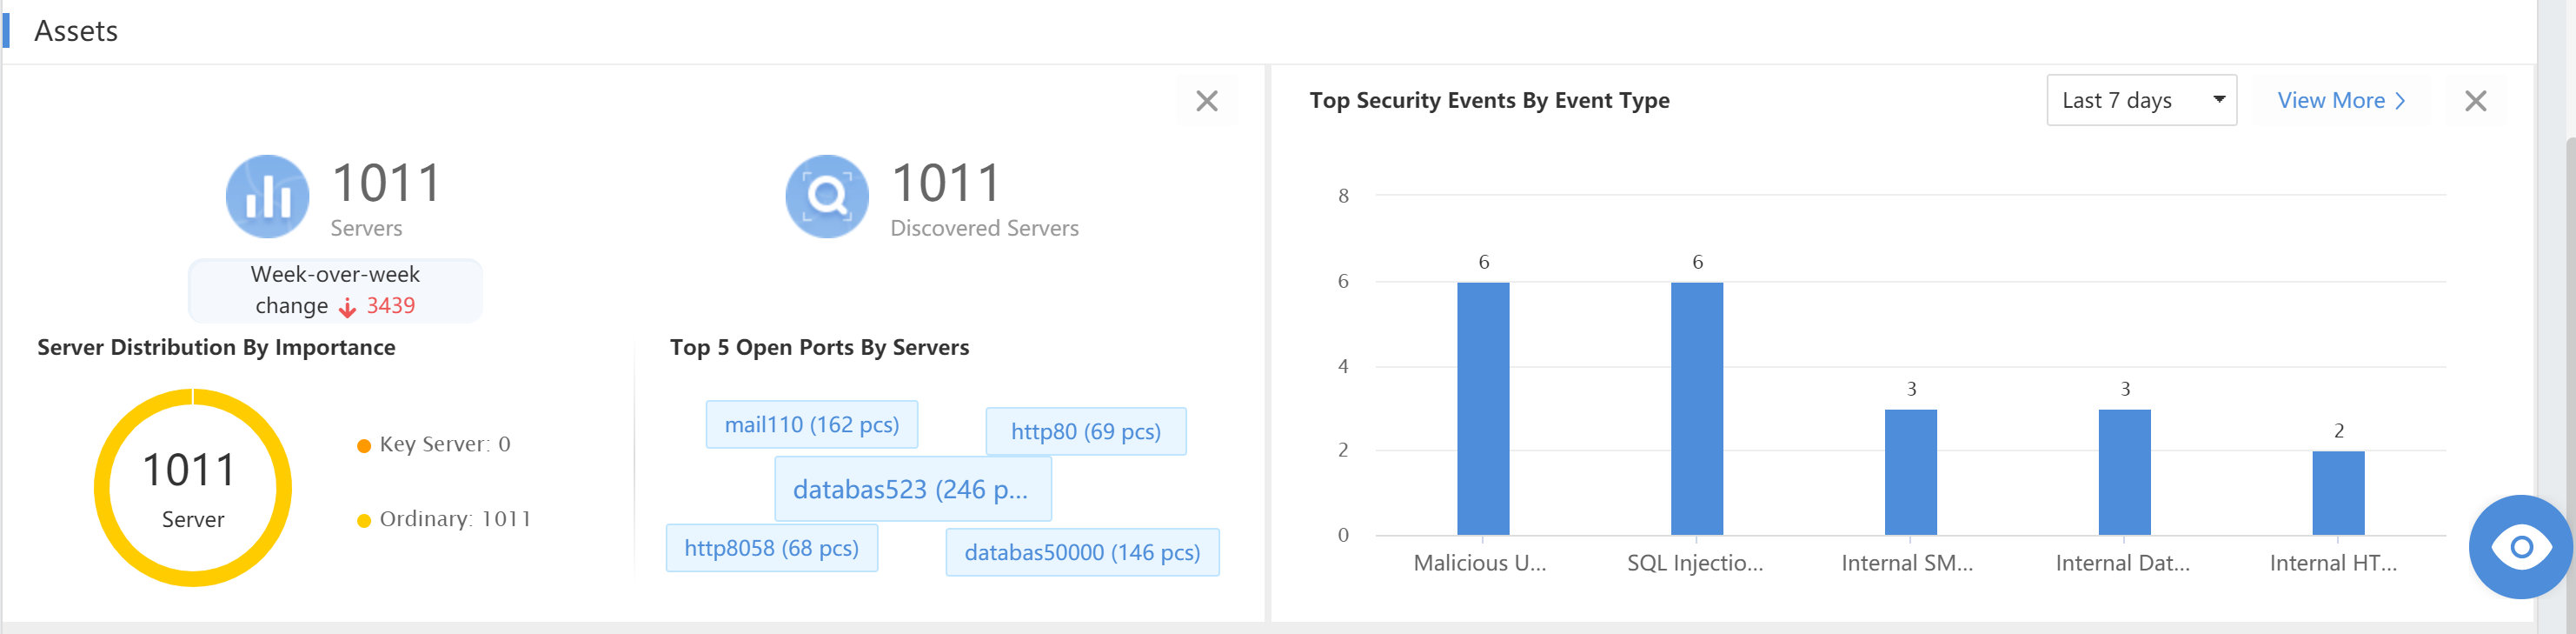
Assets: Display the number of servers, the Server Distribution by Criticality(the server level shall be defined first), and the Top 5 Open Ports By Servers.
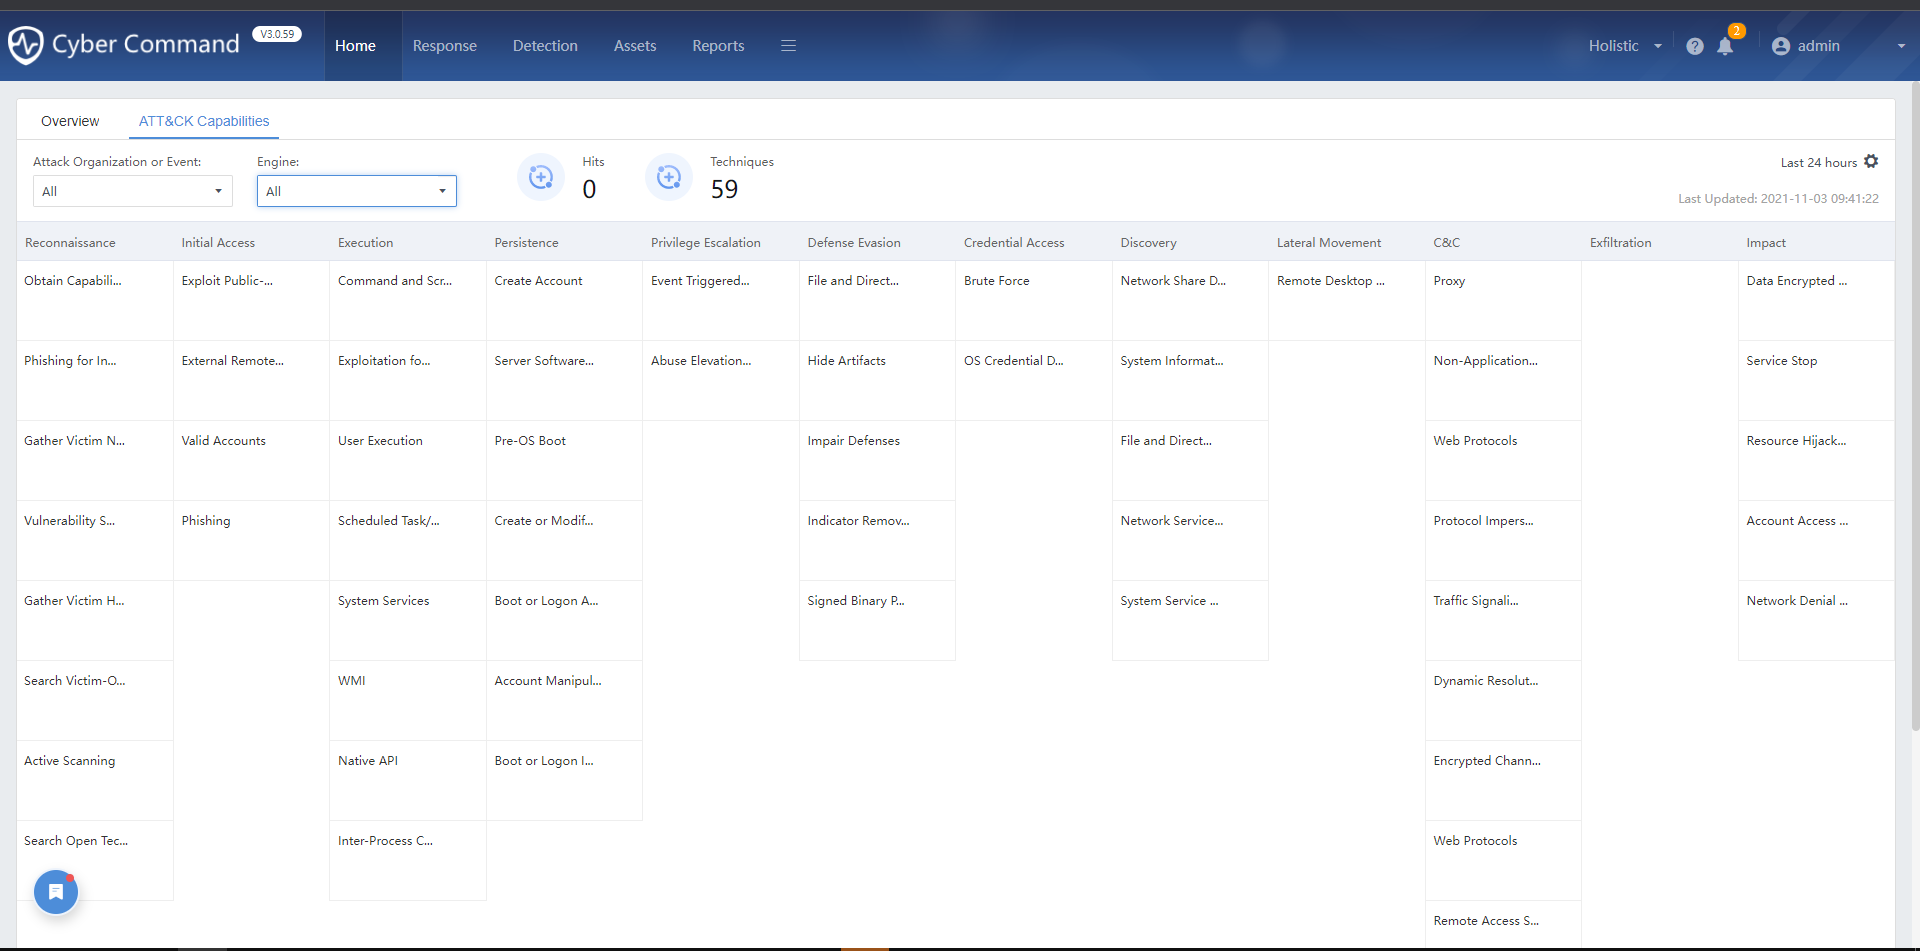
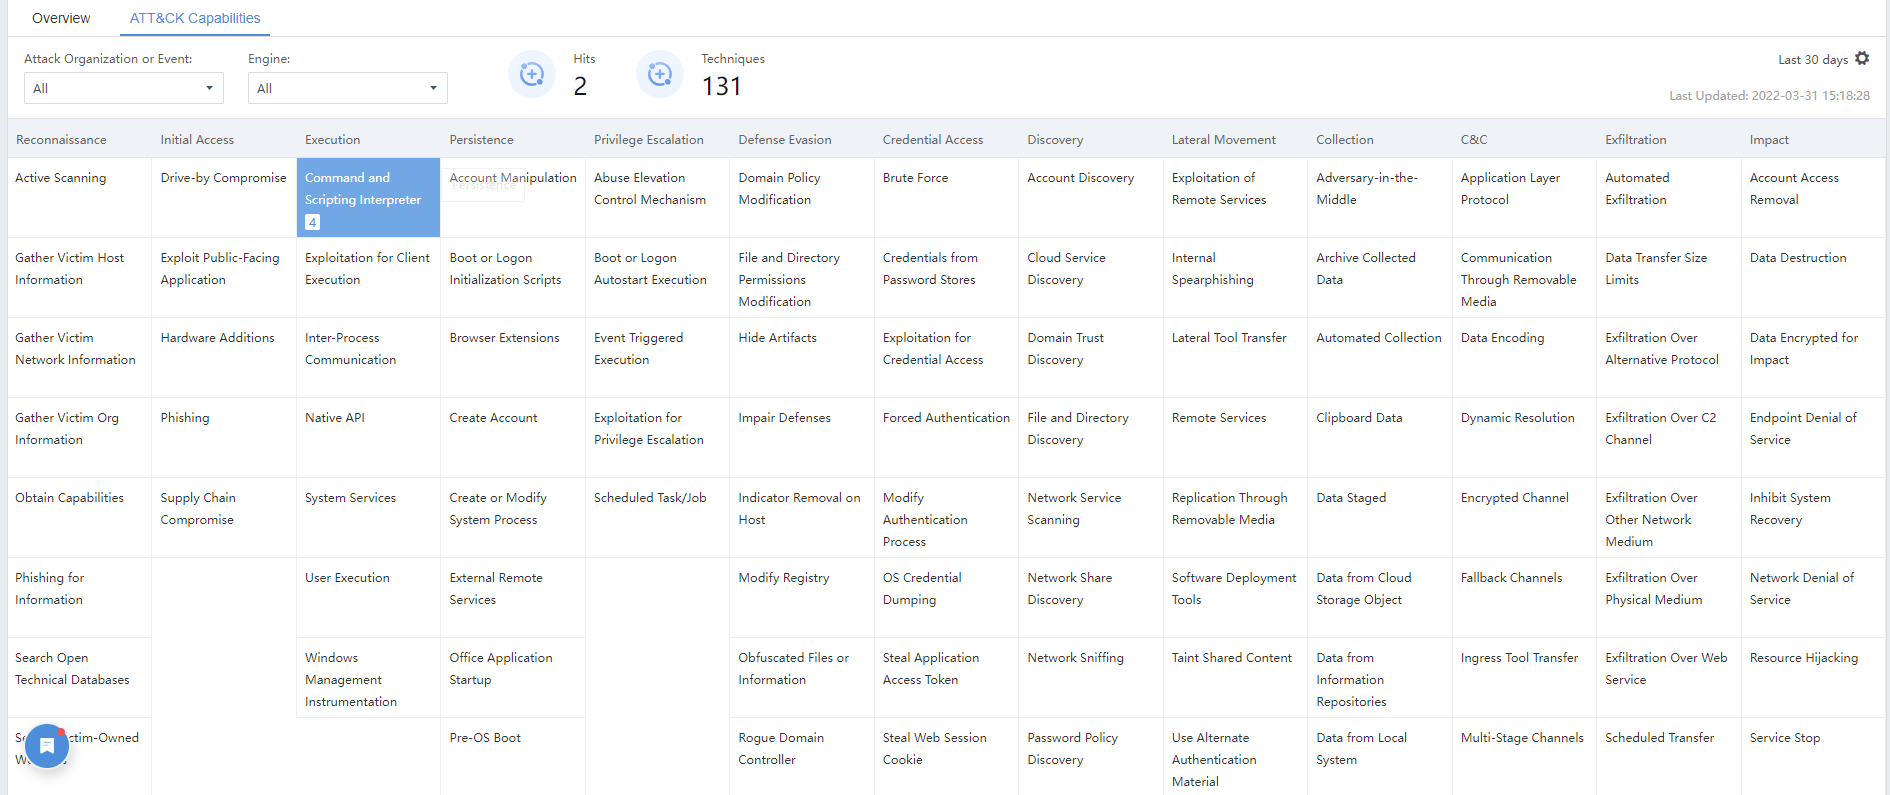
ATT&CK Capabilities
Adversarial Tactics, Techniques, and Common Knowledge (ATT&CK), a framework first proposed by MITRE in 2013, is a knowledge base and model used to describe attack behavior.
The Cyber Command has a built-in ATT&CK security framework in this version. The maps display the threats detected within the organization according to Hits and Techniques.
Monitor
Navigate to Home > Monitor. It visually displays the security insights of the whole network from multiple aspects.
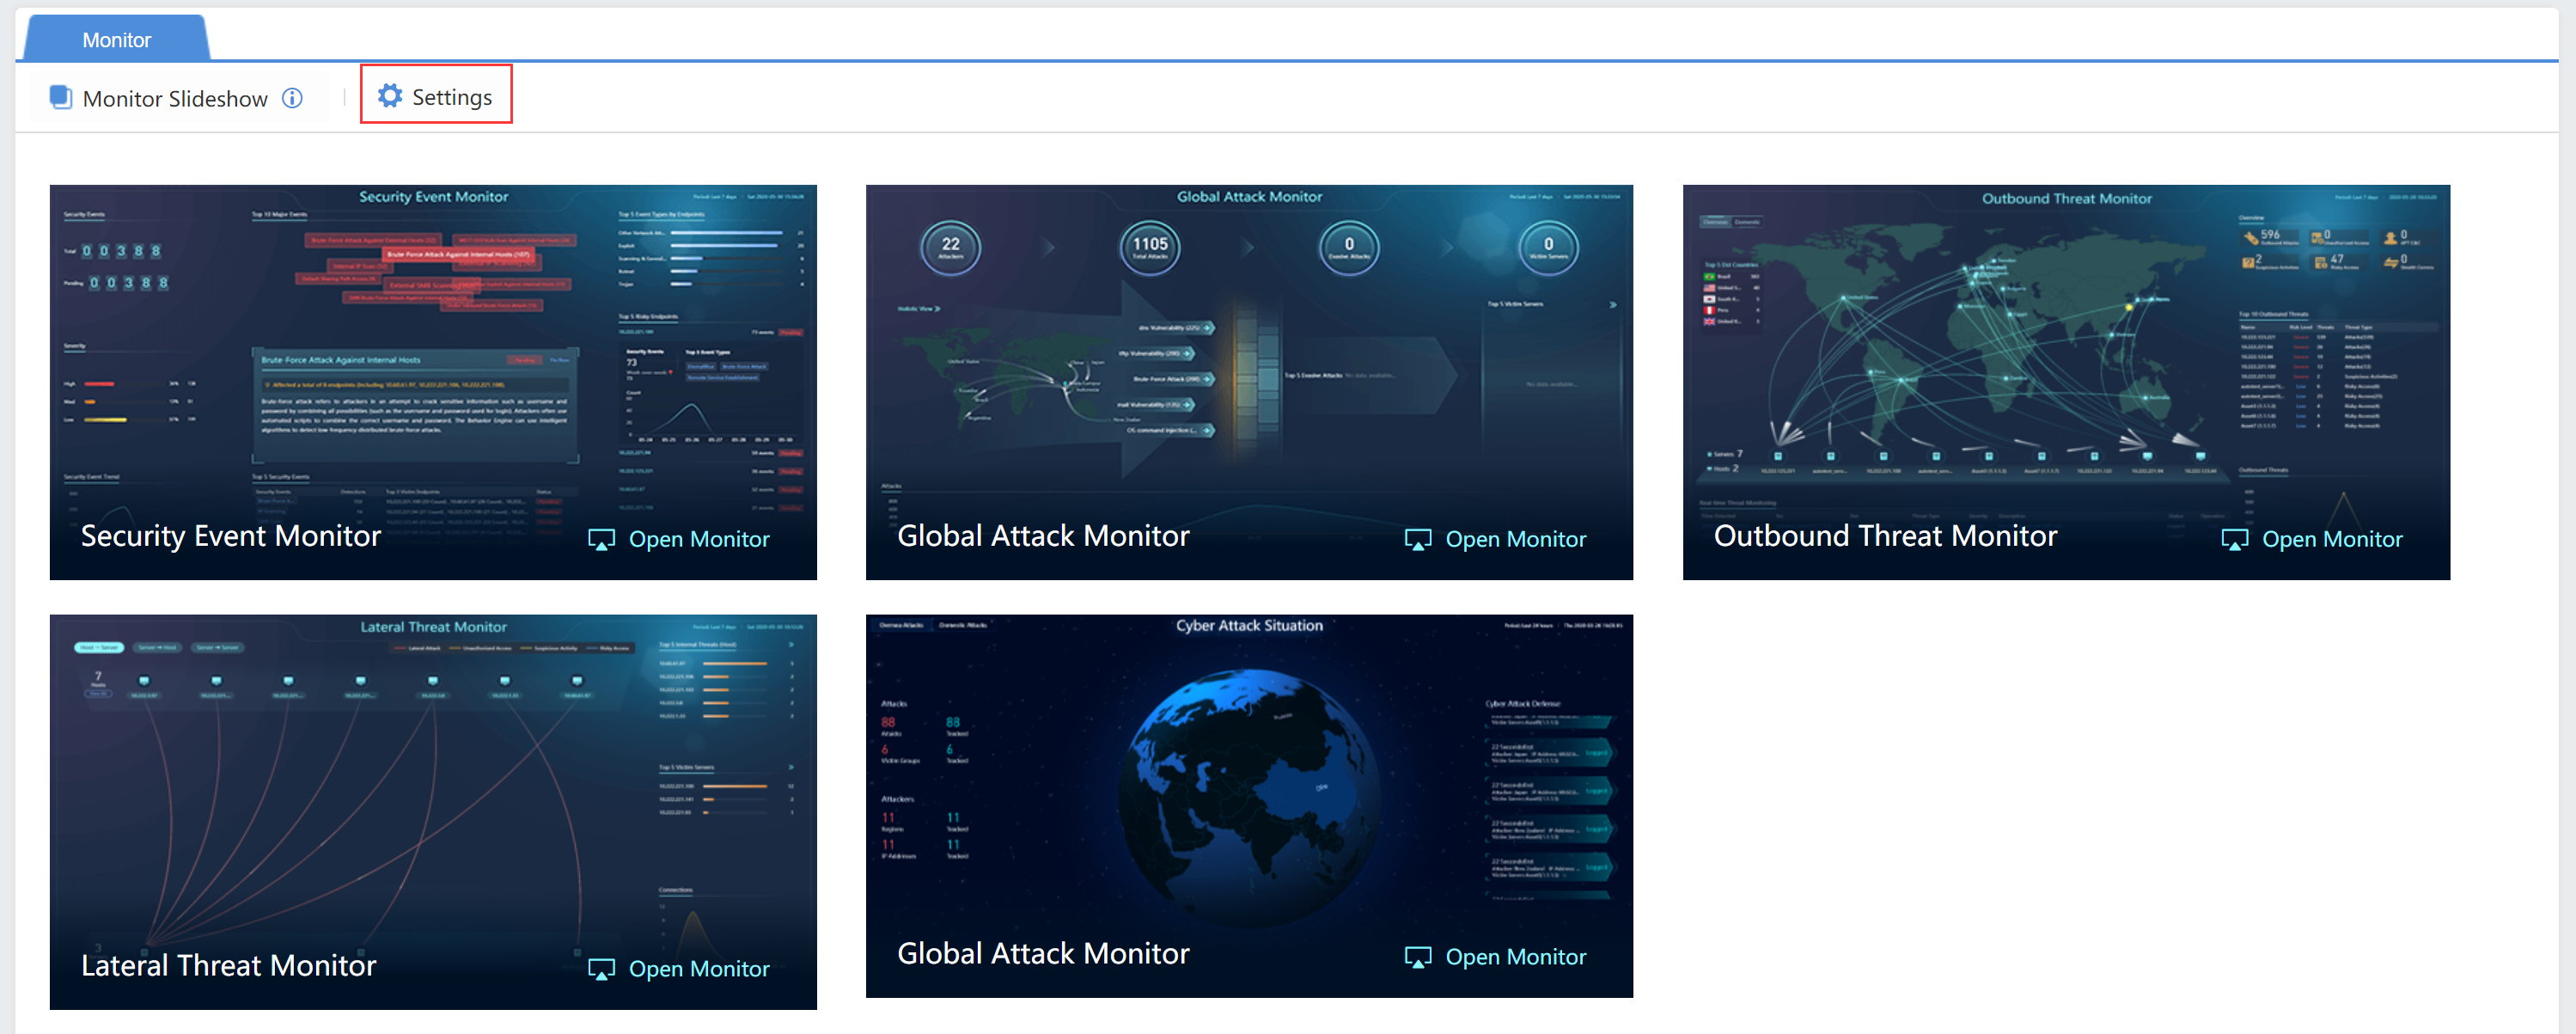
Click Settings at the upper left corner to configure, as shown below:
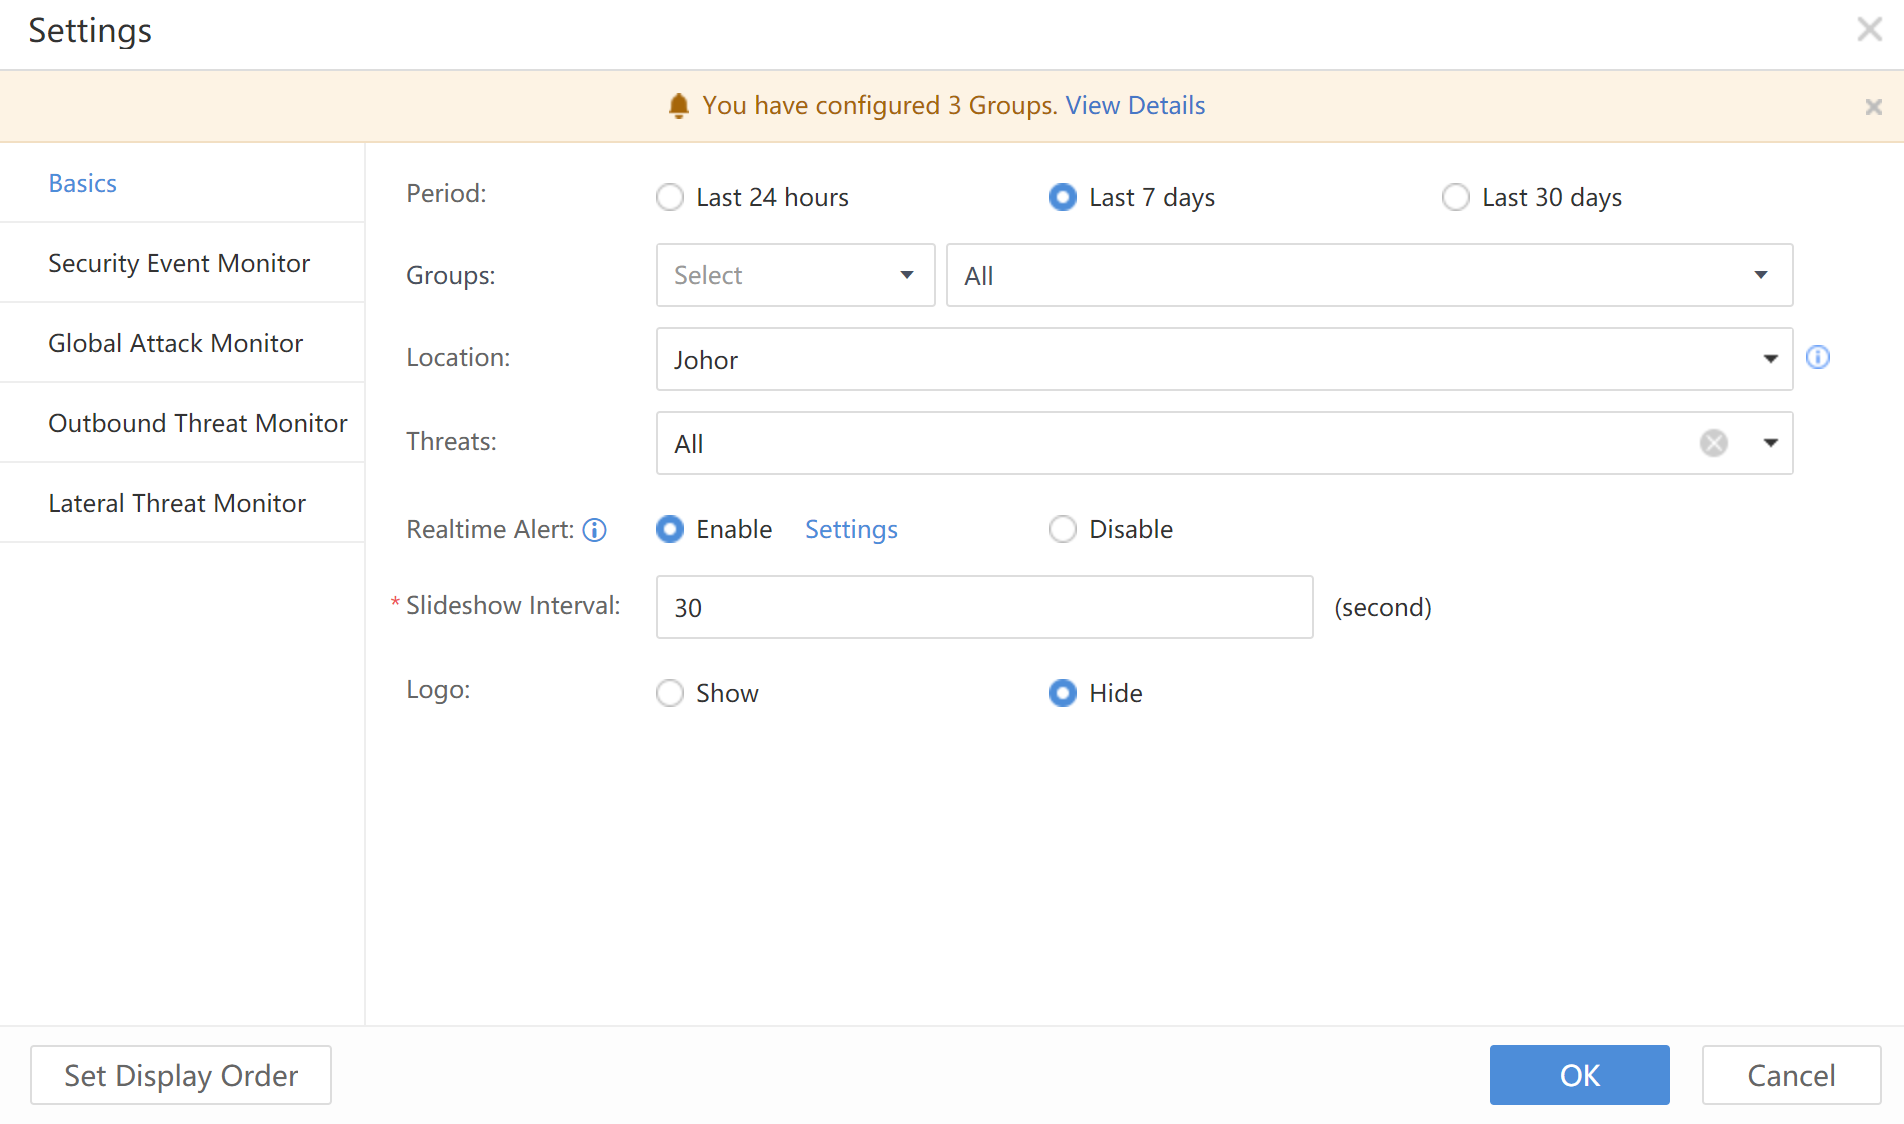
Basics: Define configurations for all interfaces. Choose the data statistics cycle, such as last 24 hours, last 7 days, or last 30 days, enable or disable the Realtime Alert, and select the unit’s physical location and time interval of large screen rotation according to your needs.
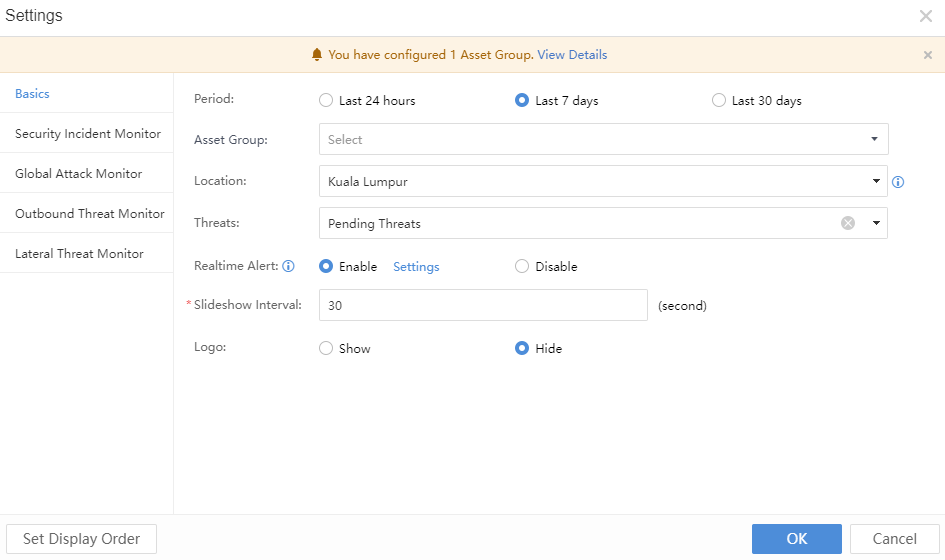
Security Incident Monitor:Display a comprehensive security situation of the whole network, and the subject can be customized.
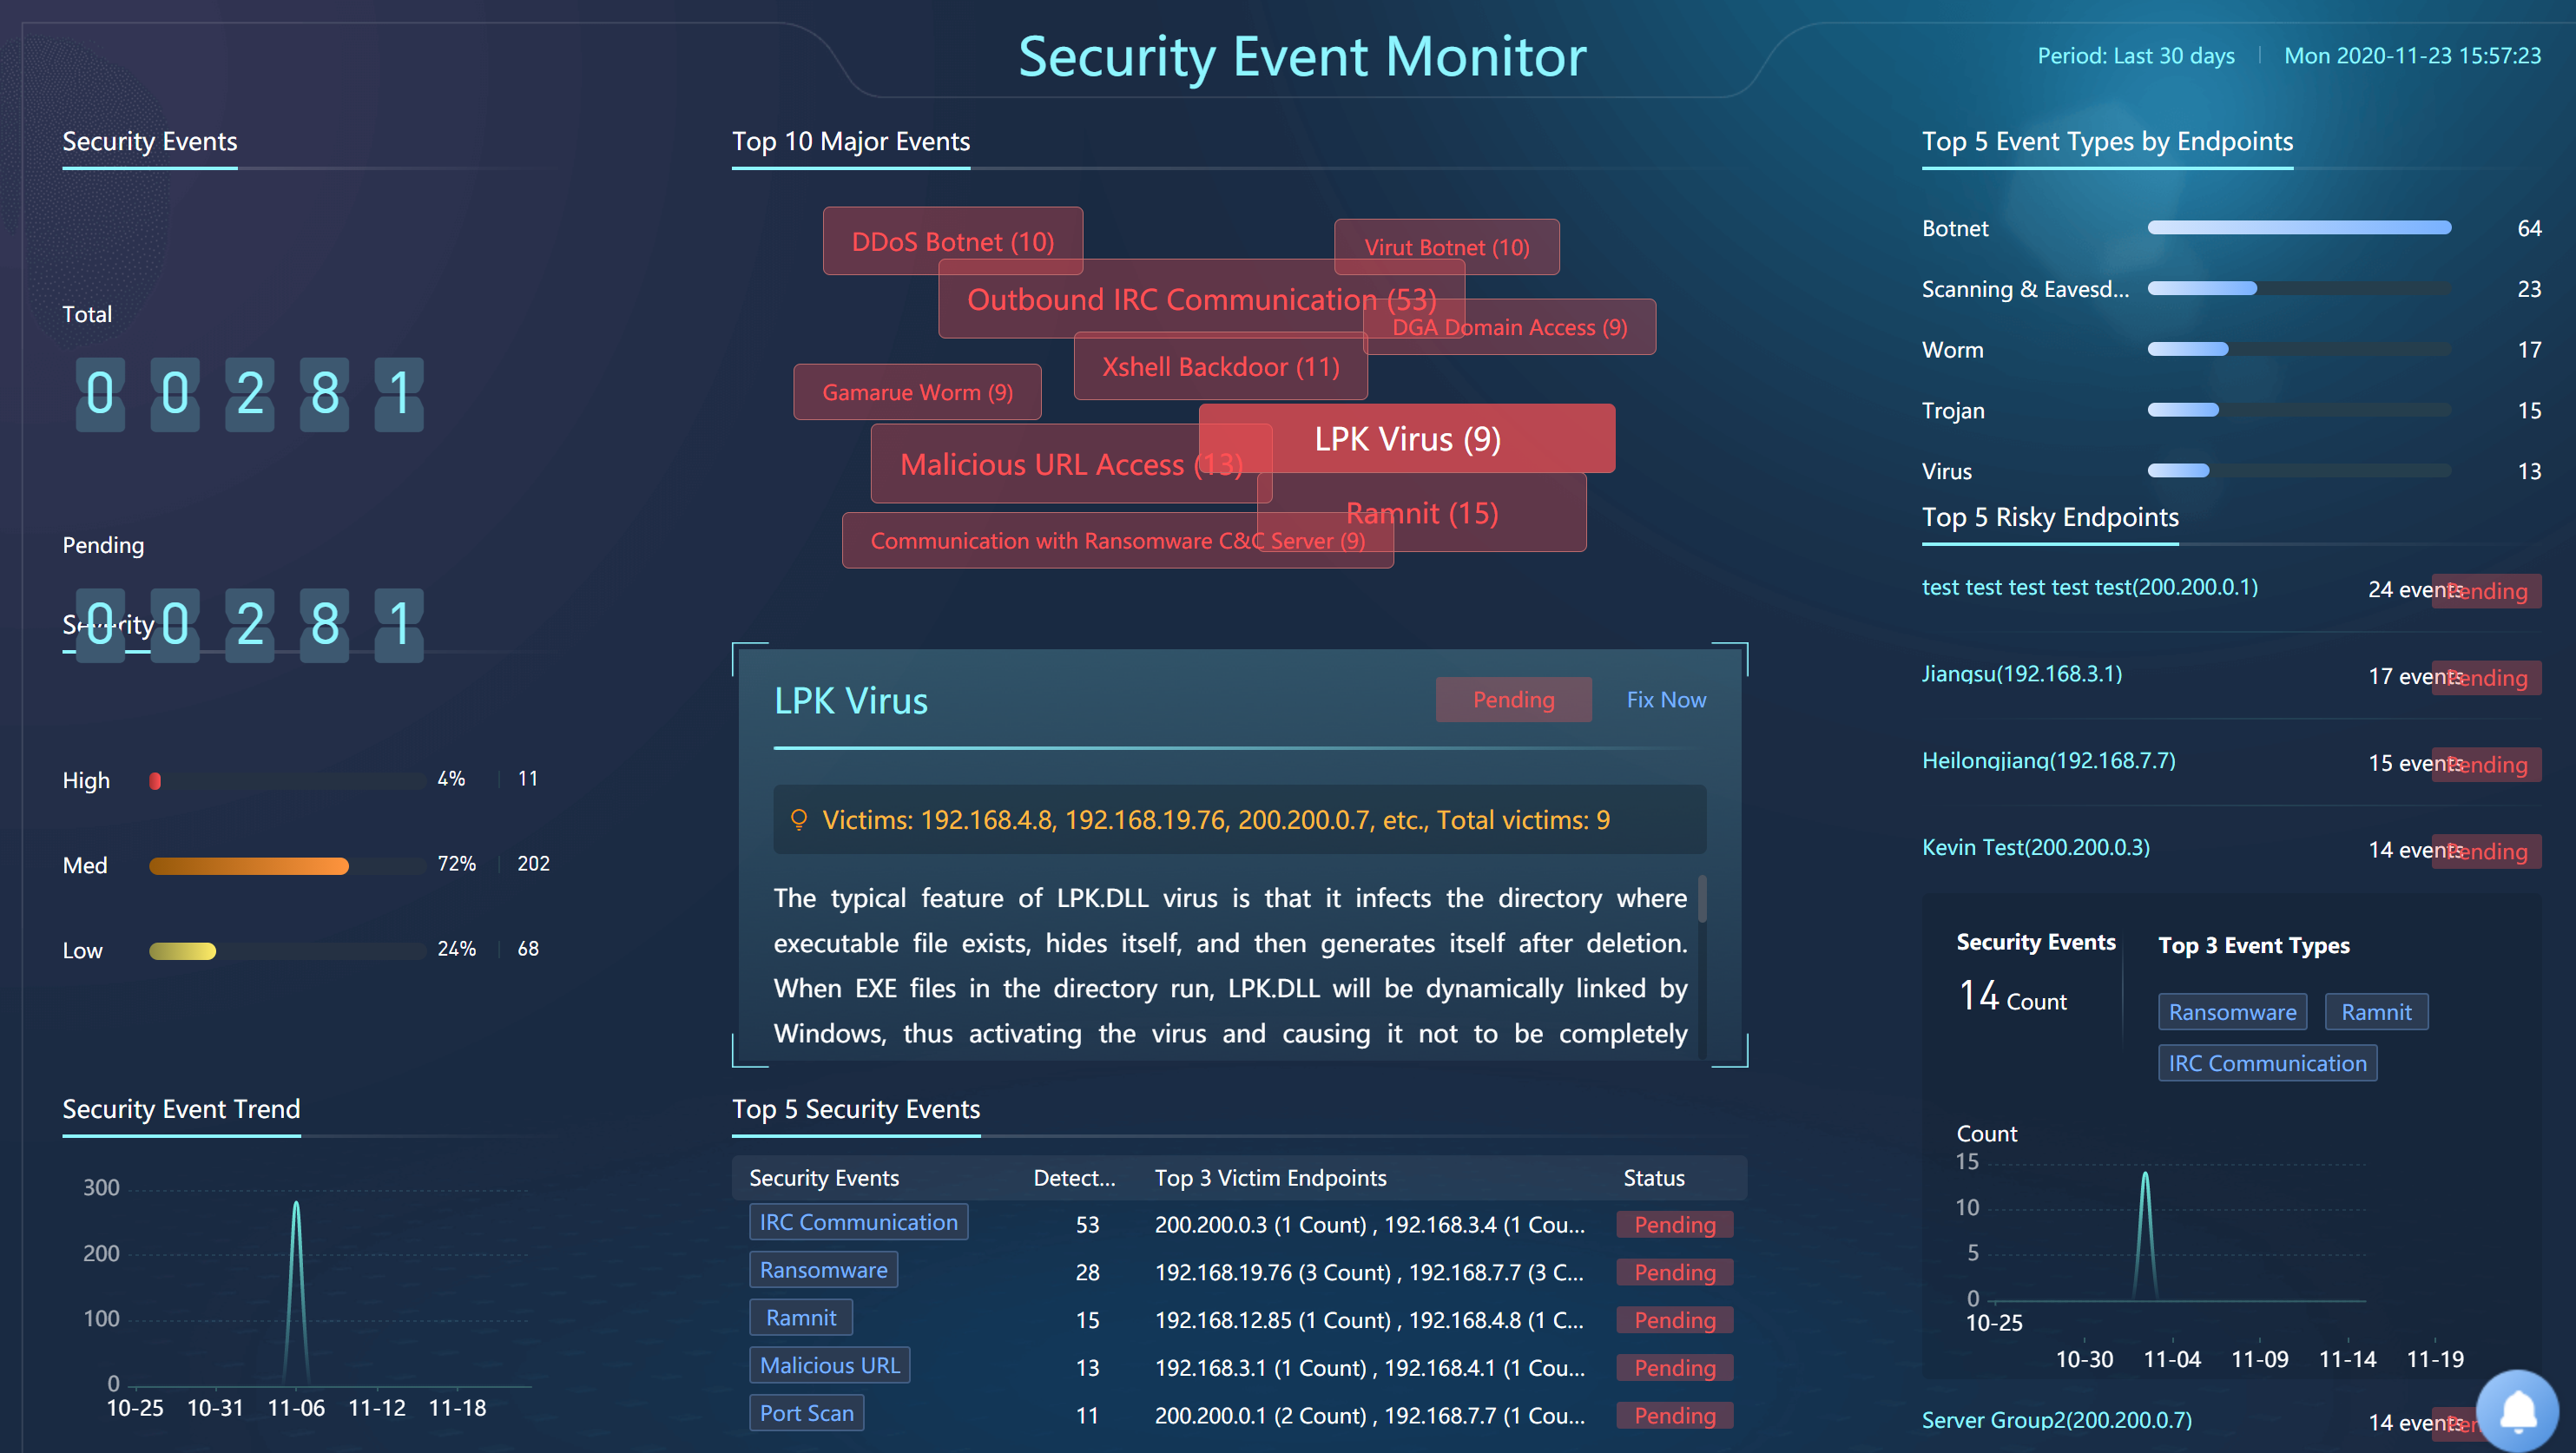
Security Incident Monitor
It monitors security incidents in LAN and recent hot cyber security events in real-time to perceive LAN’s security situation rapidly.
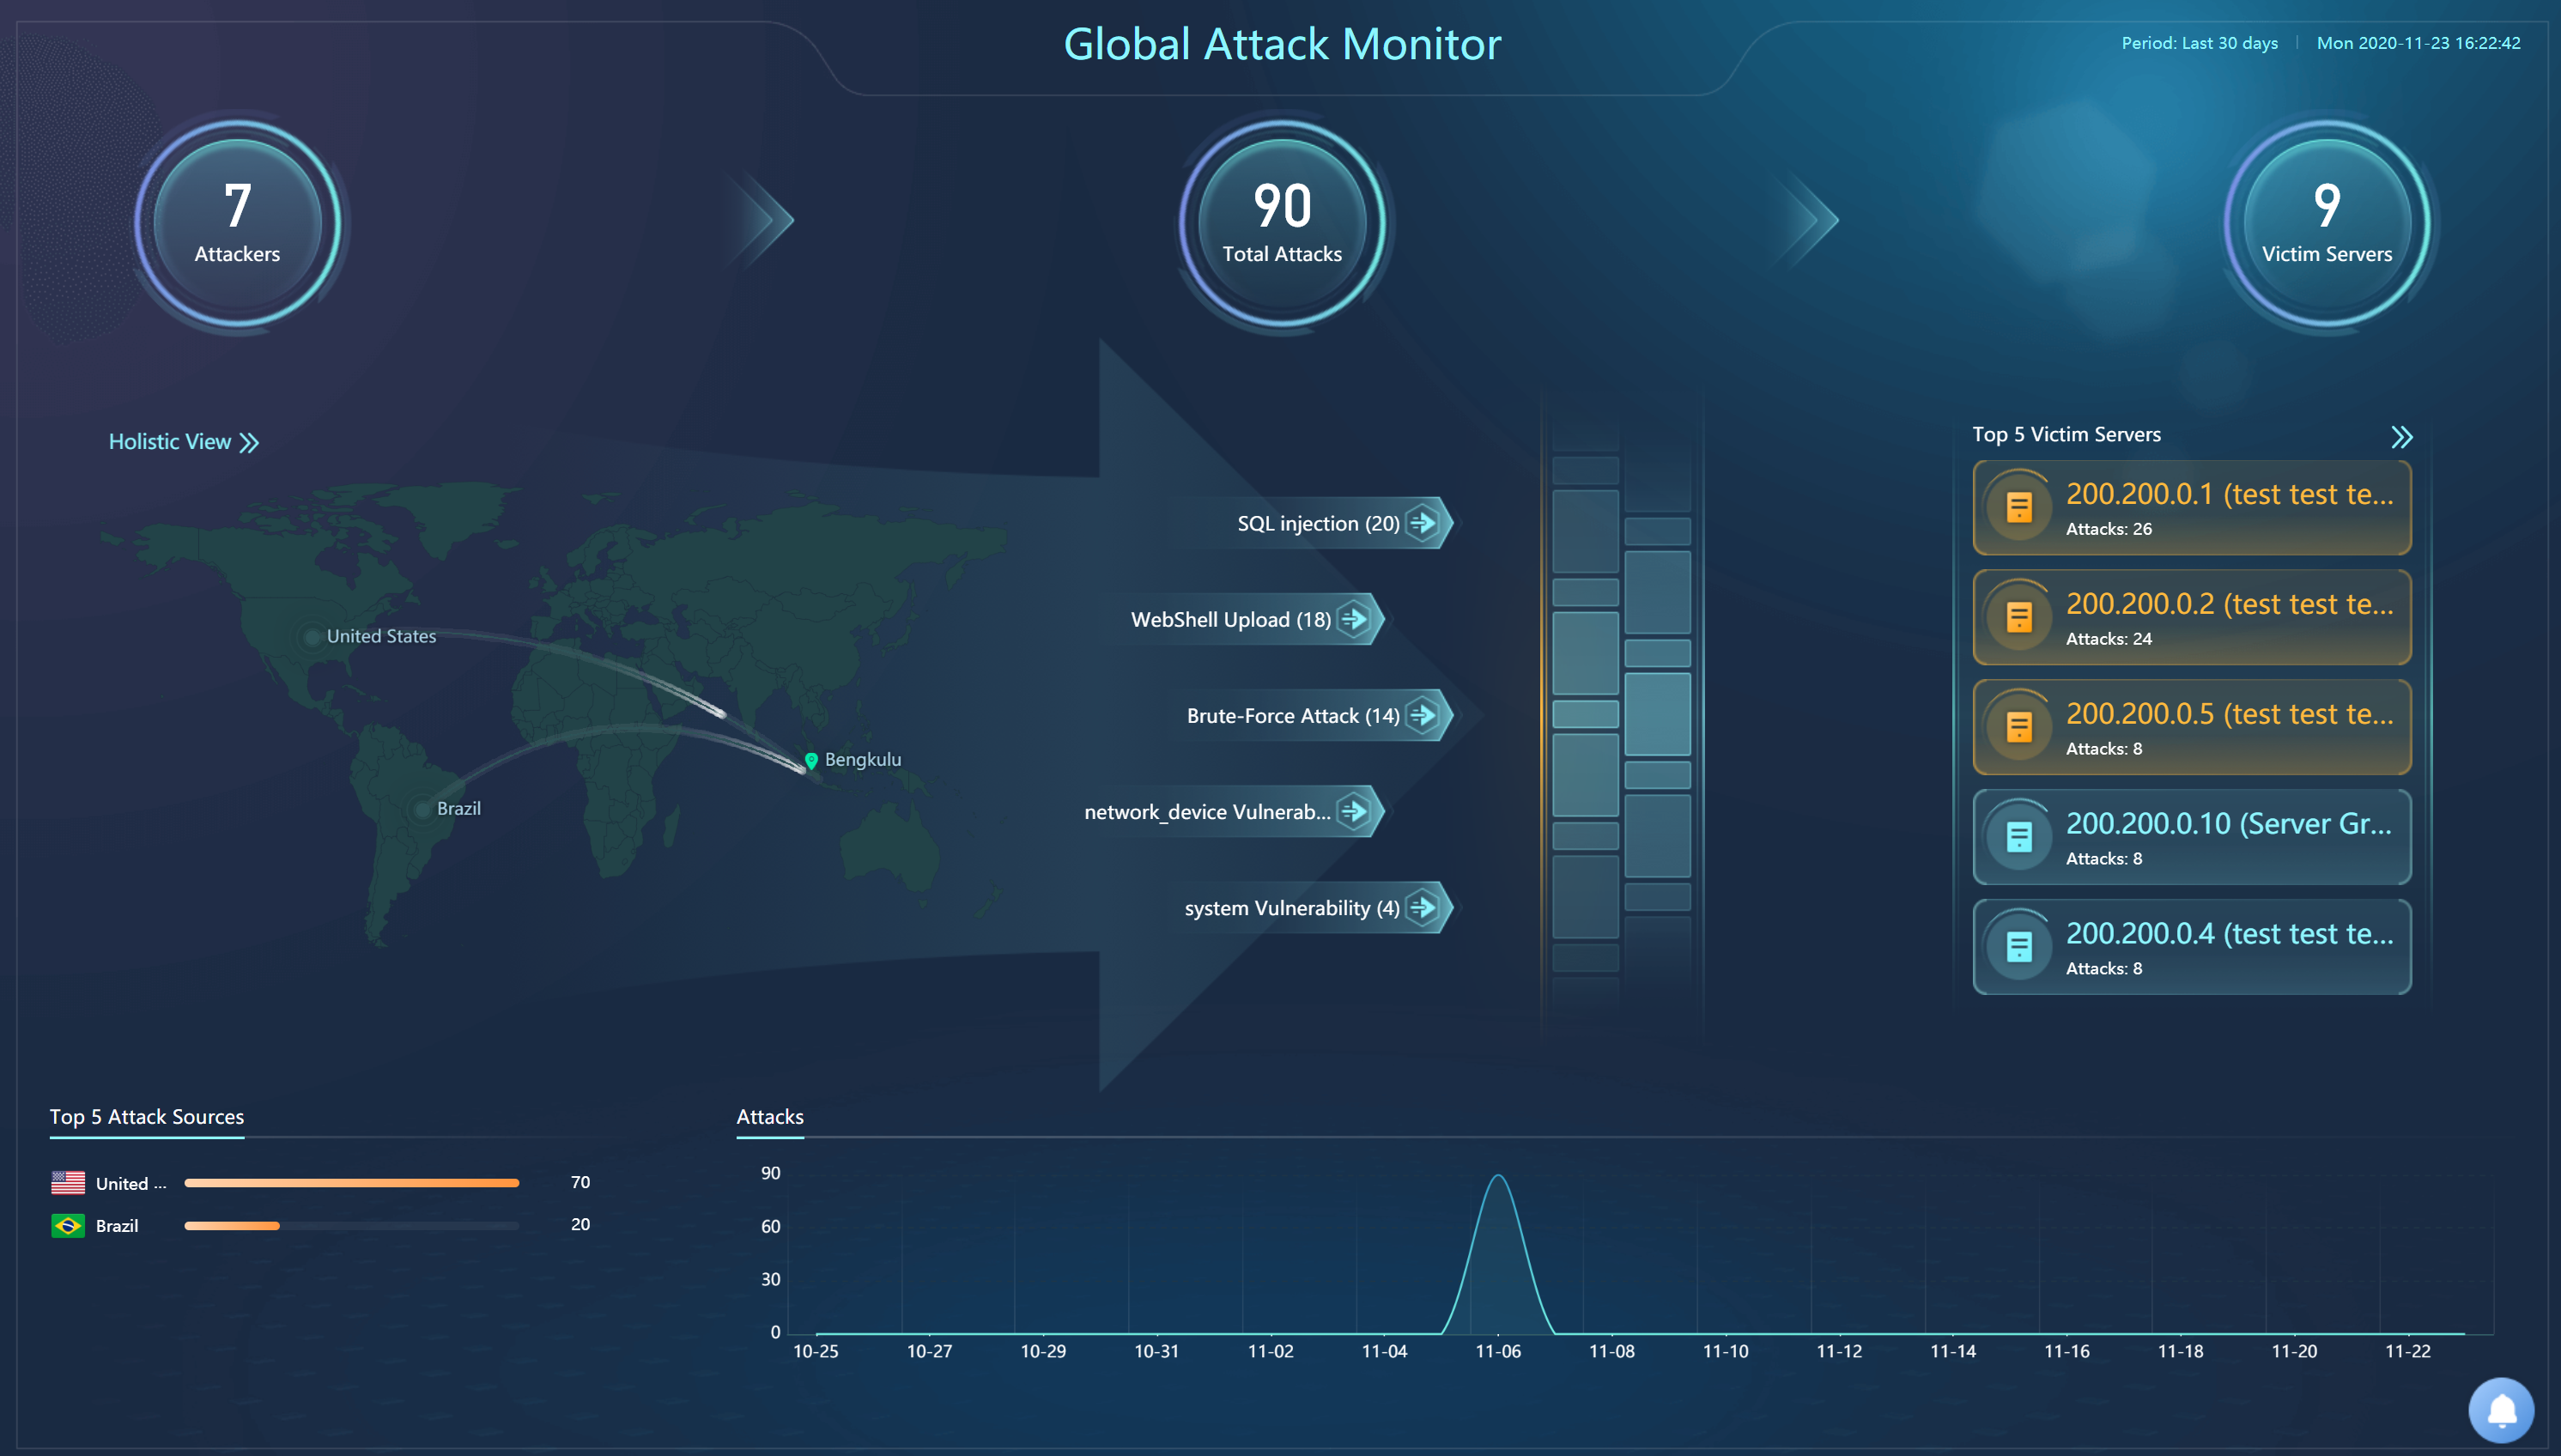
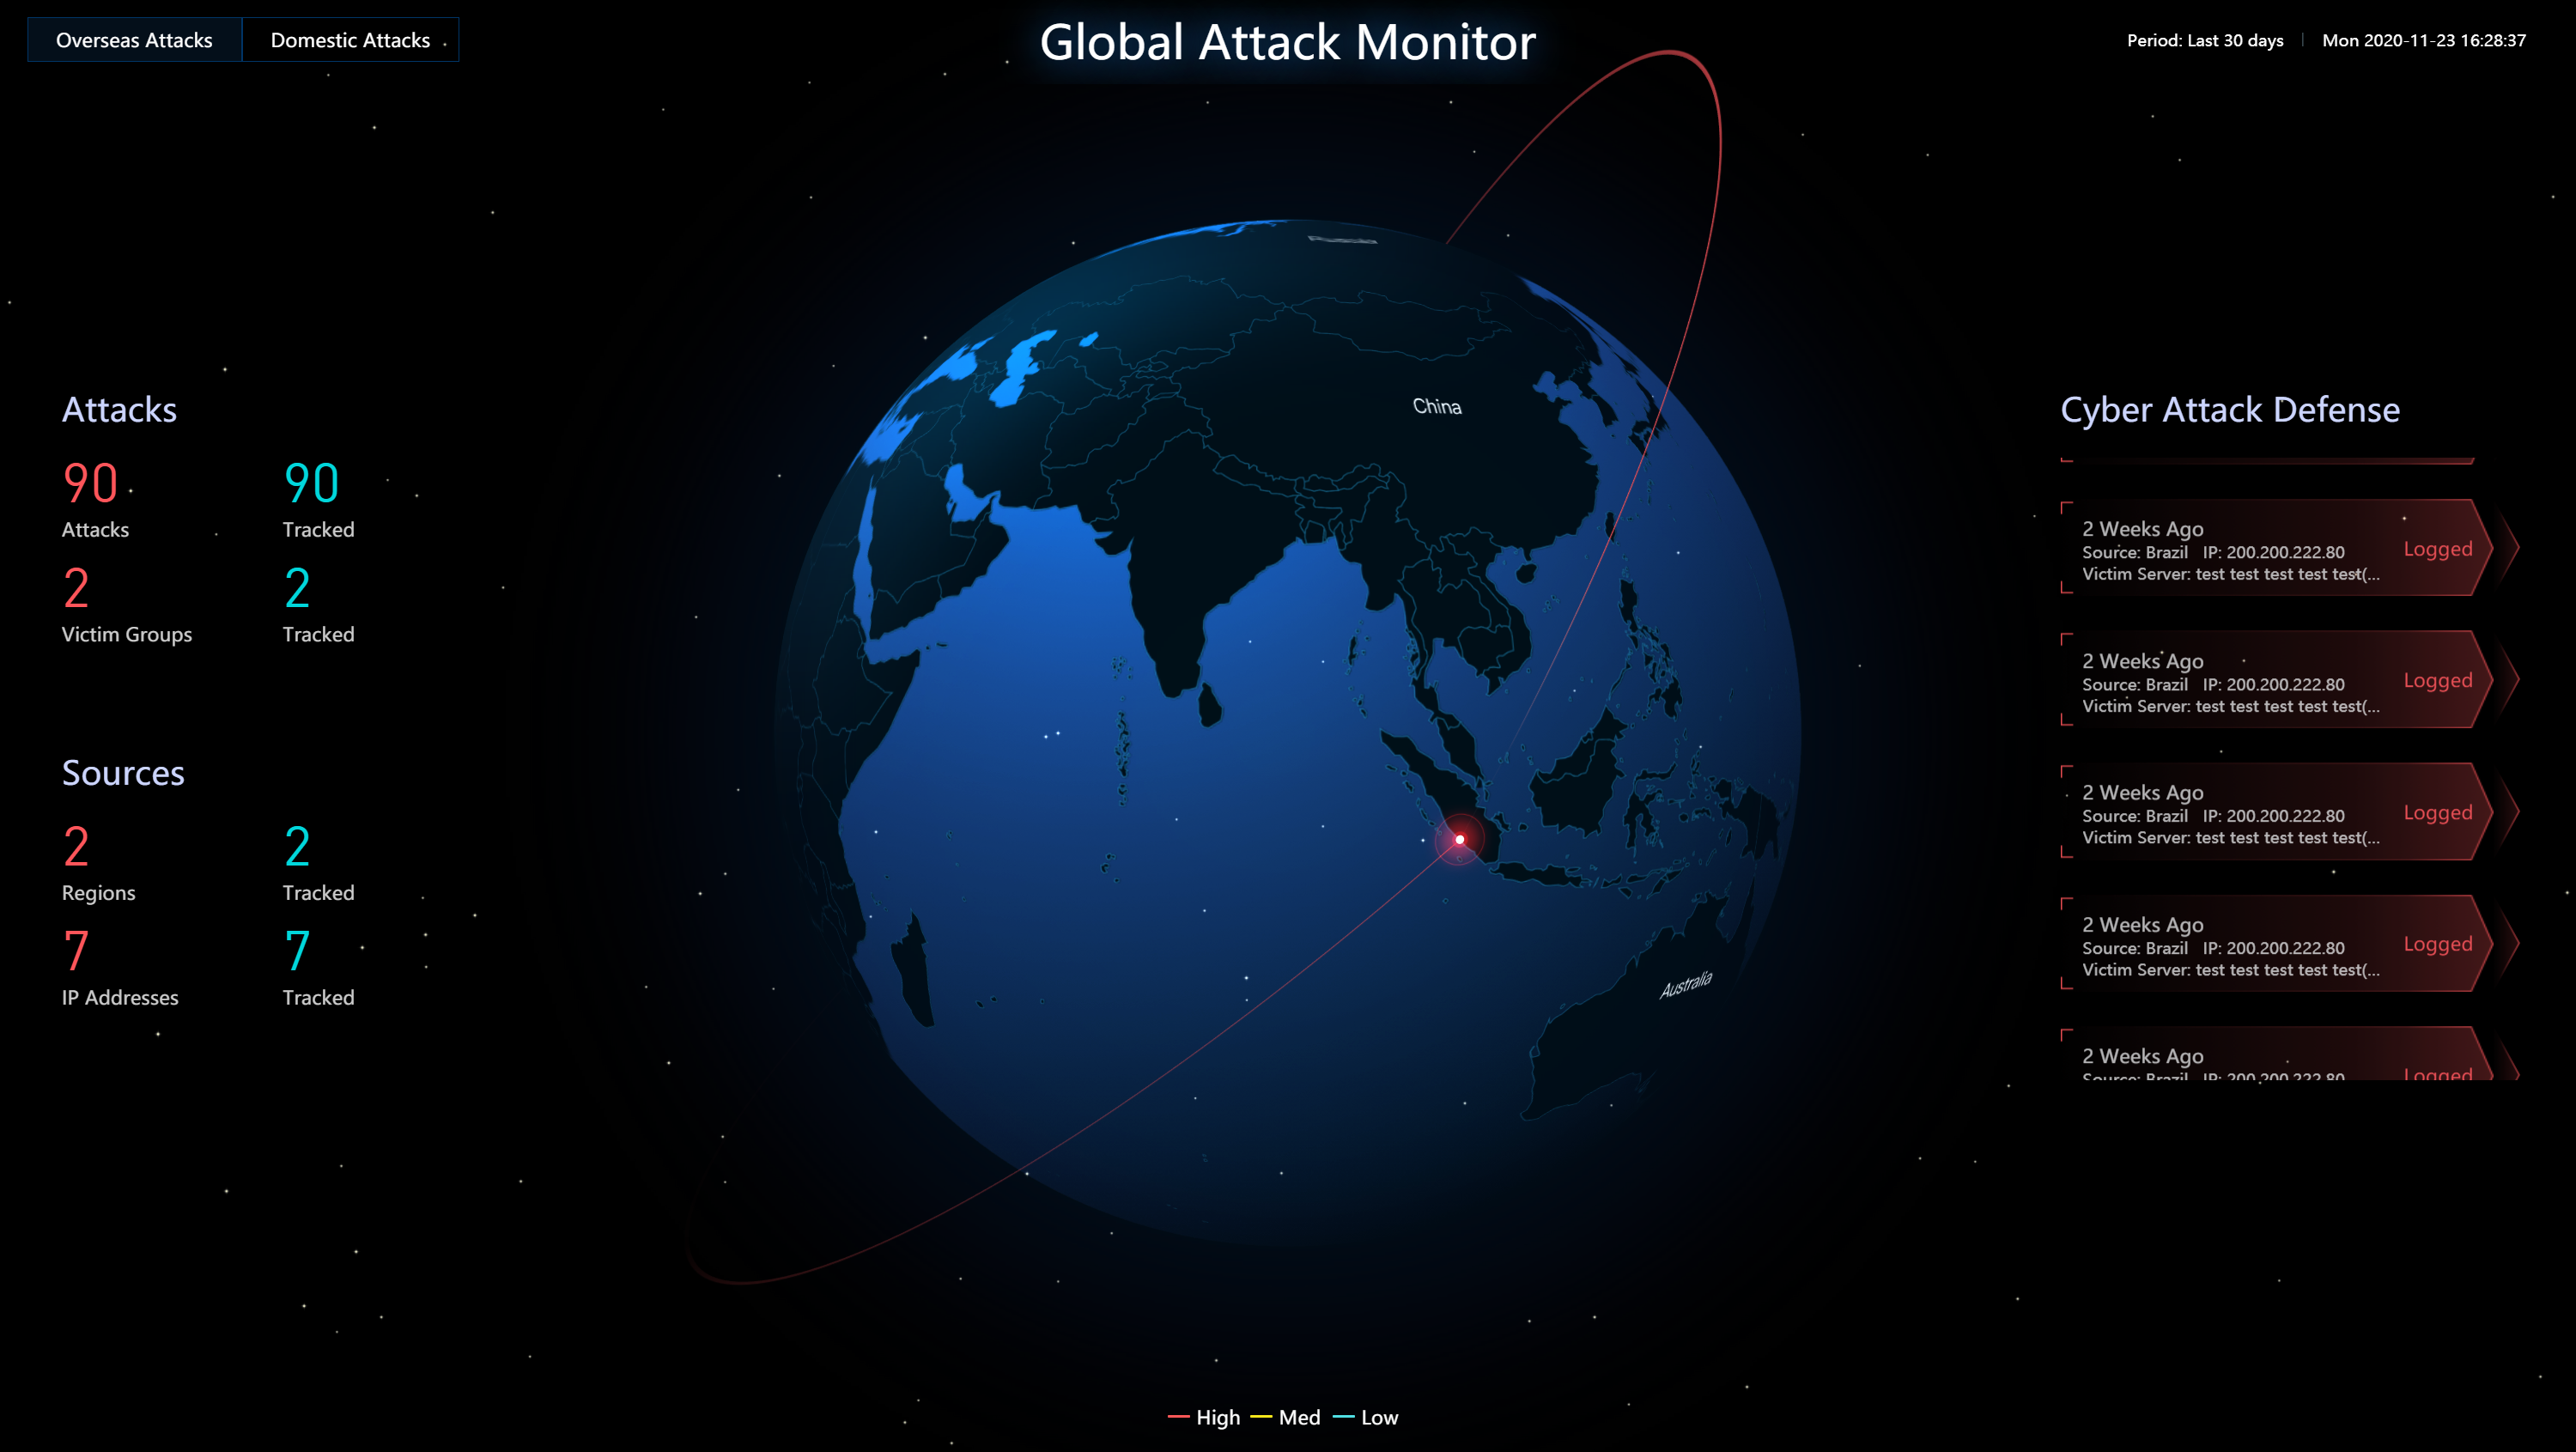
Global Attack Monitor
It monitors attacks from the outside and visually displays global attacks and threats confronted by LAN. The physical location of attack sources, attack methods, and attack services are displayed clearly.
2D Monitor
3D Monitor
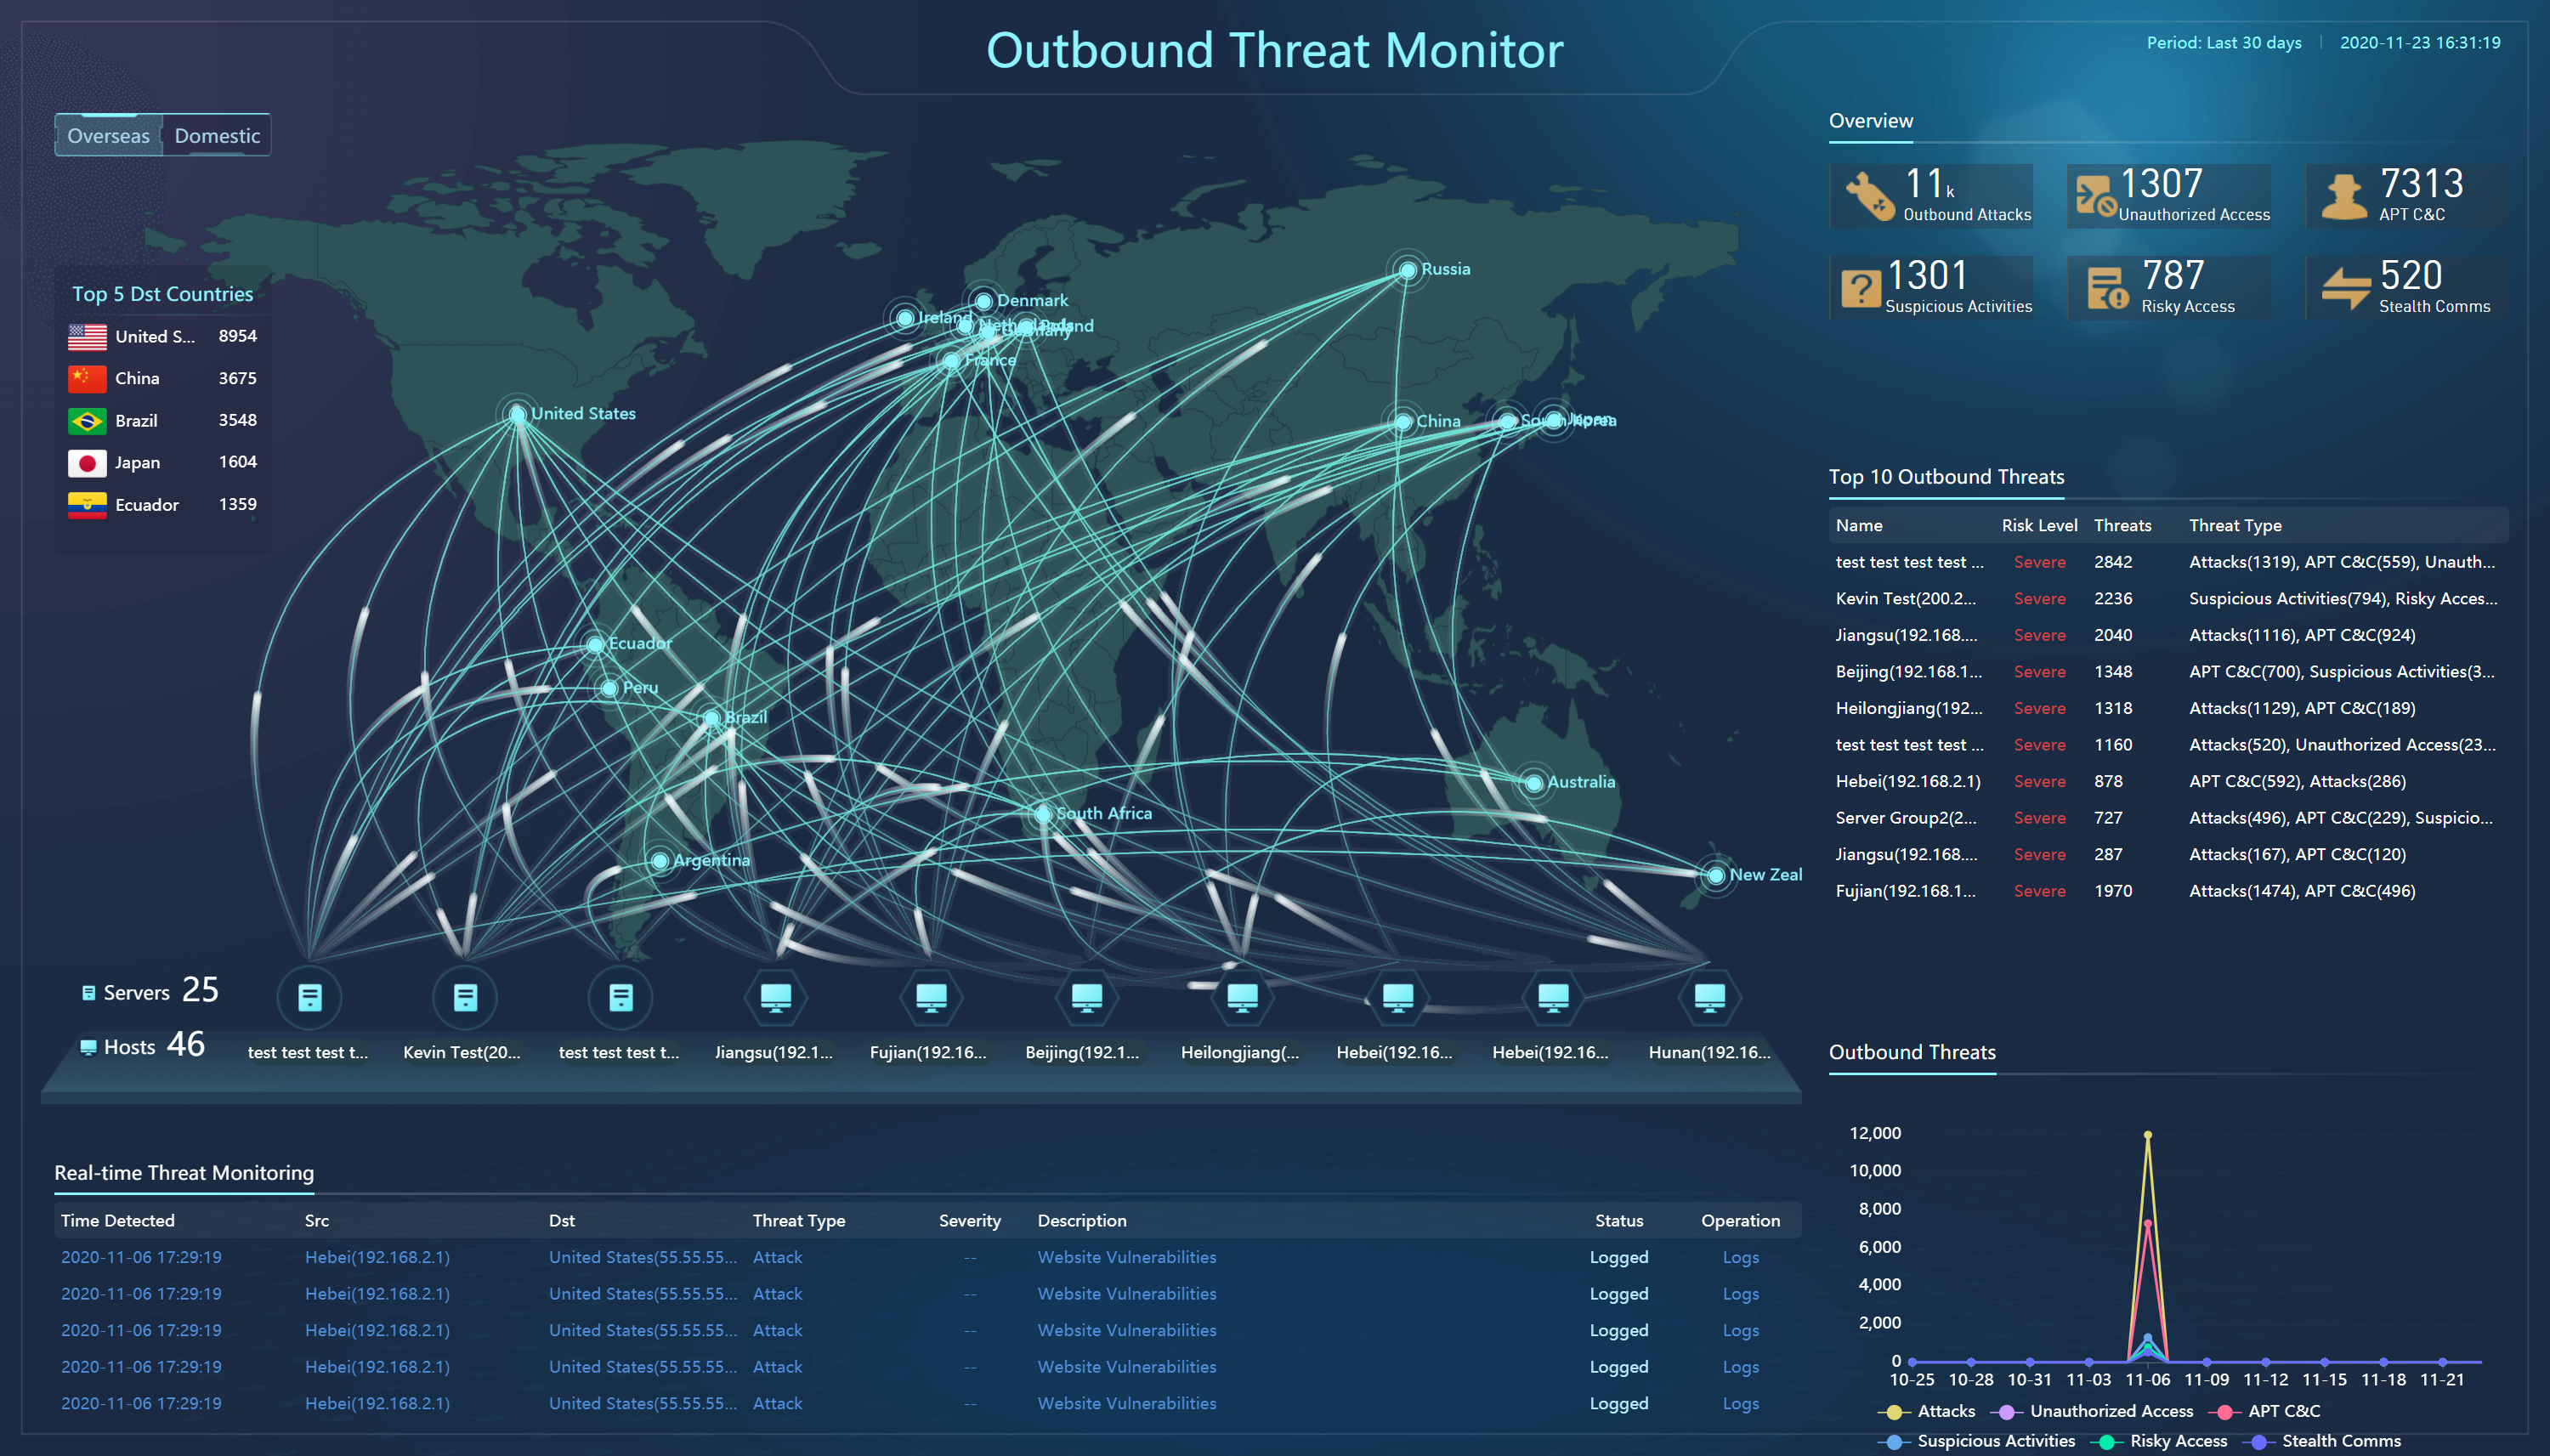
Outbound Threat Monitor
It monitors the risky external connection of services, attacks, C&C communications, and illegal access initiated by the business systems to the outside.
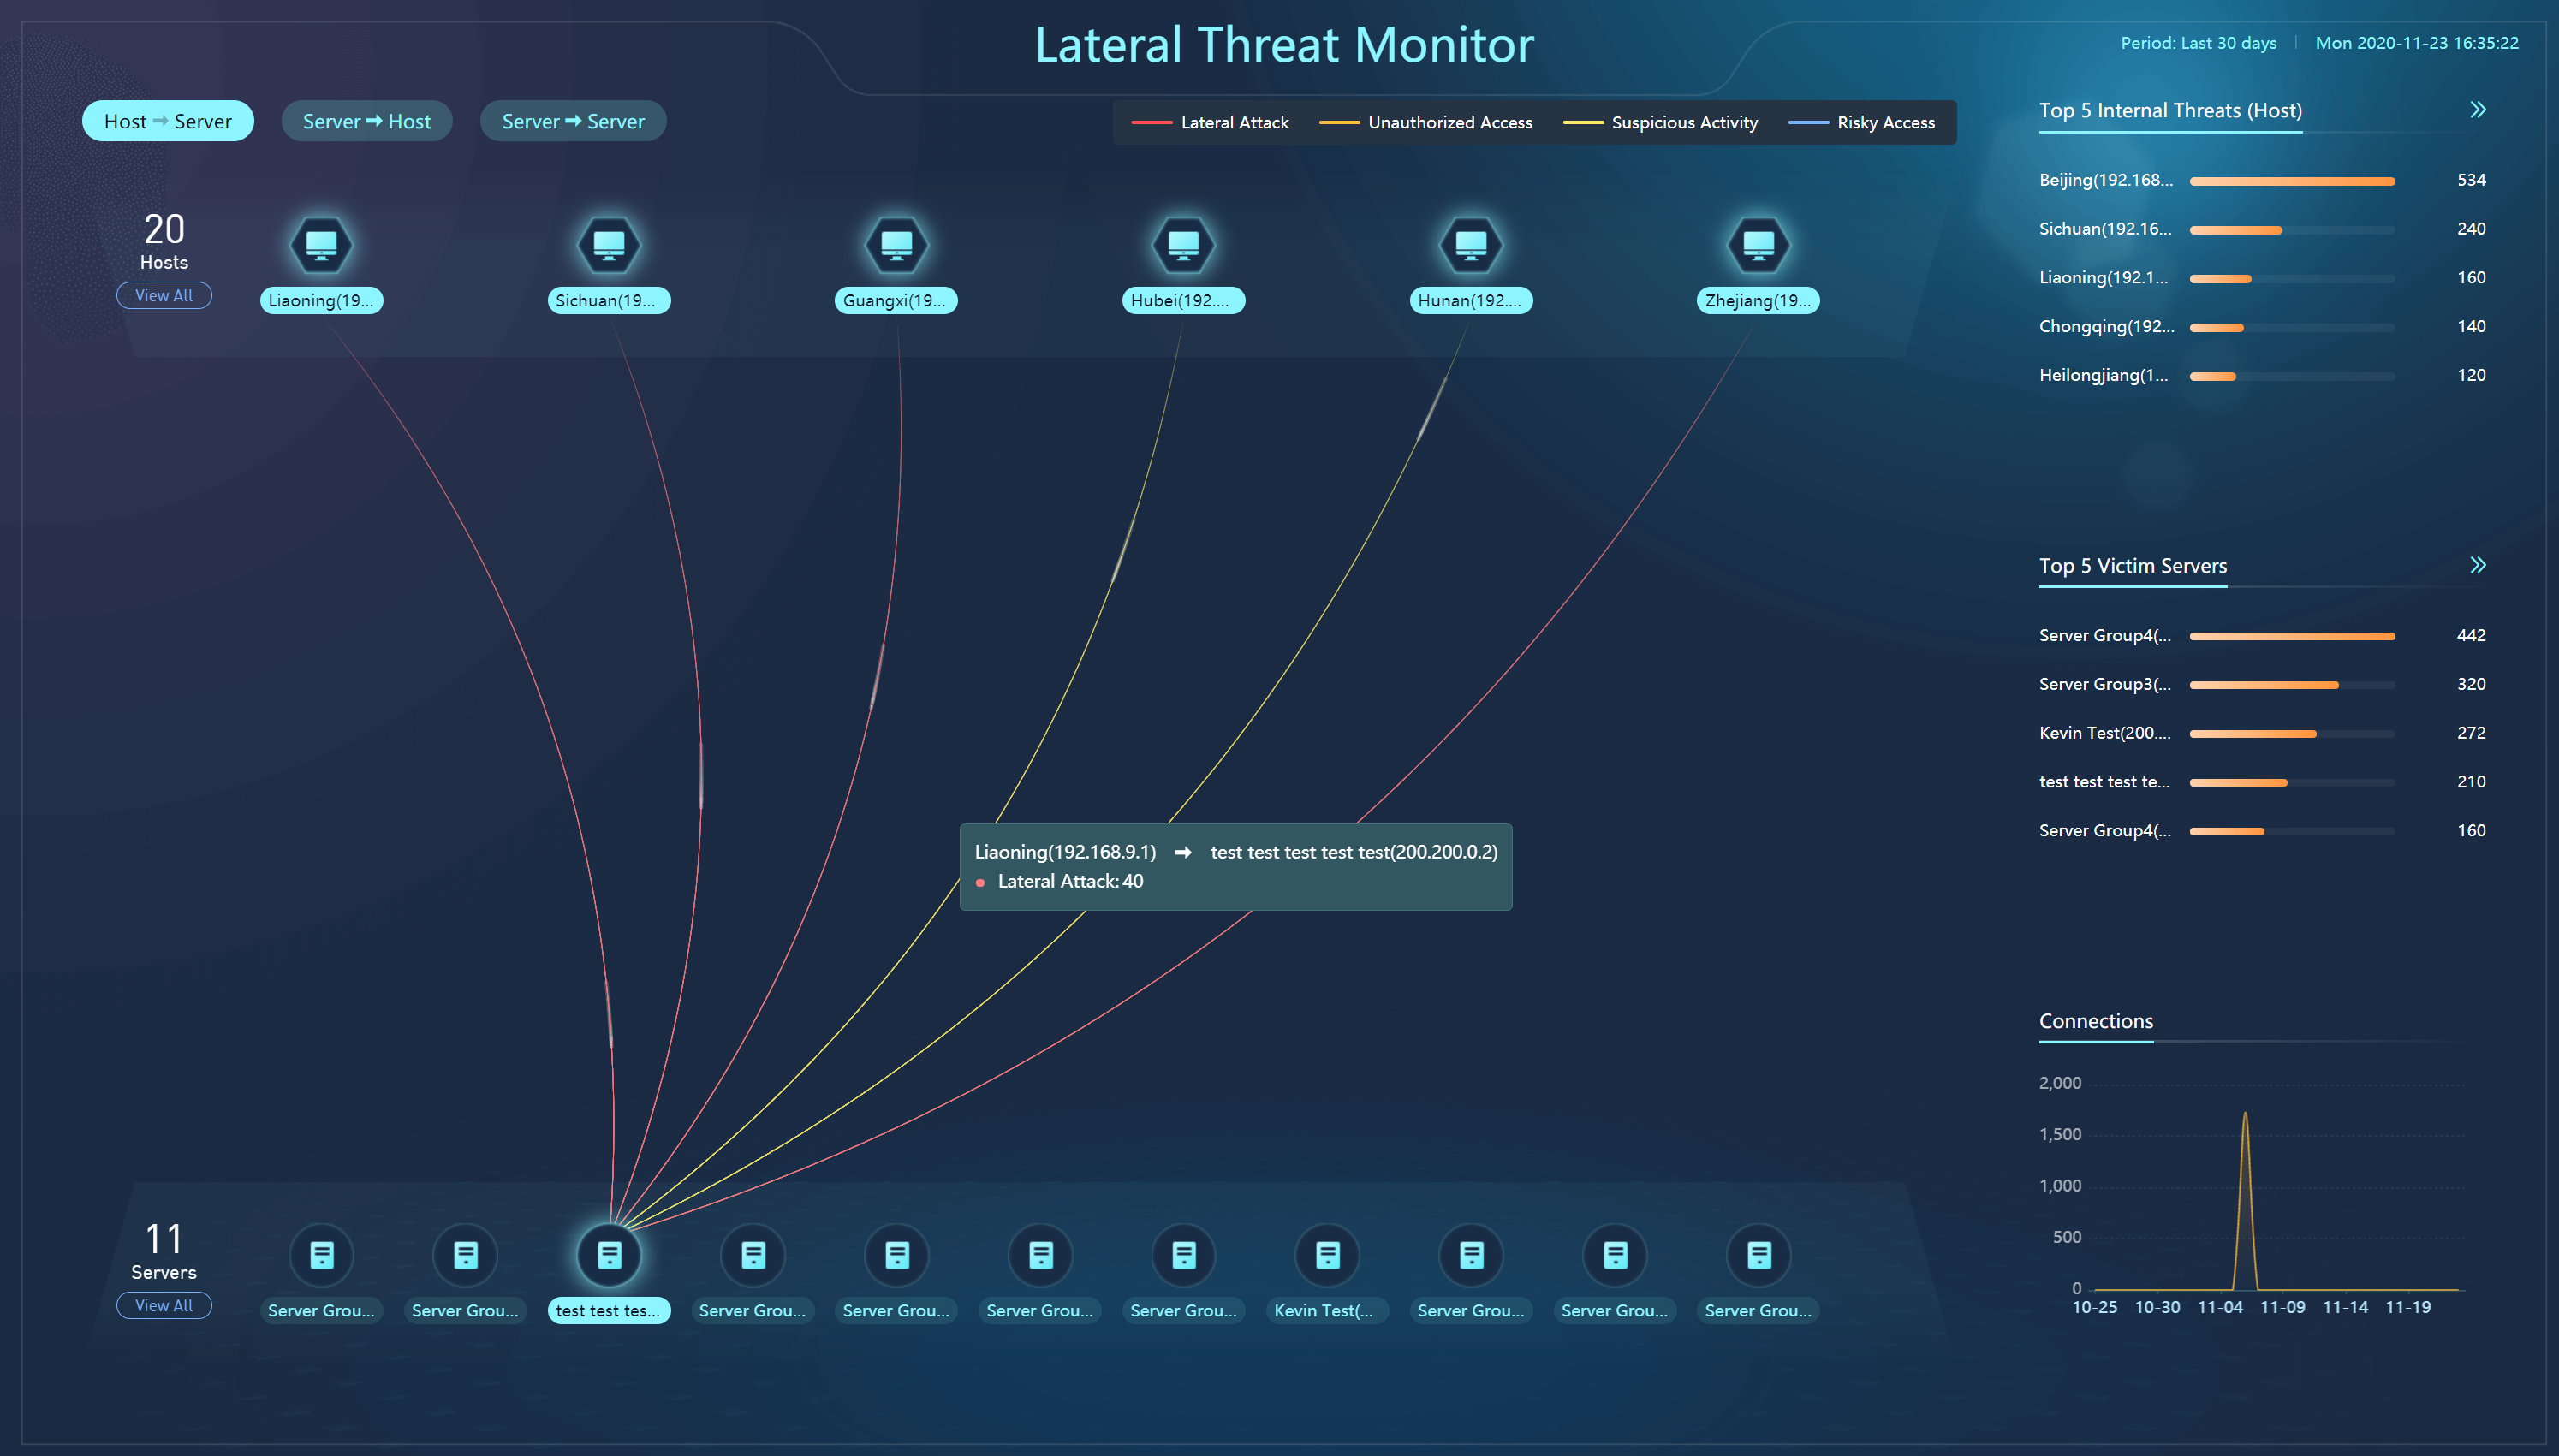
Lateral Threat Monitor
It monitors internal and lateral threats. The internal threats are displayed clearly, including Lateral Attack, Unauthorized Access, Suspicious Activity, and Risky Access.
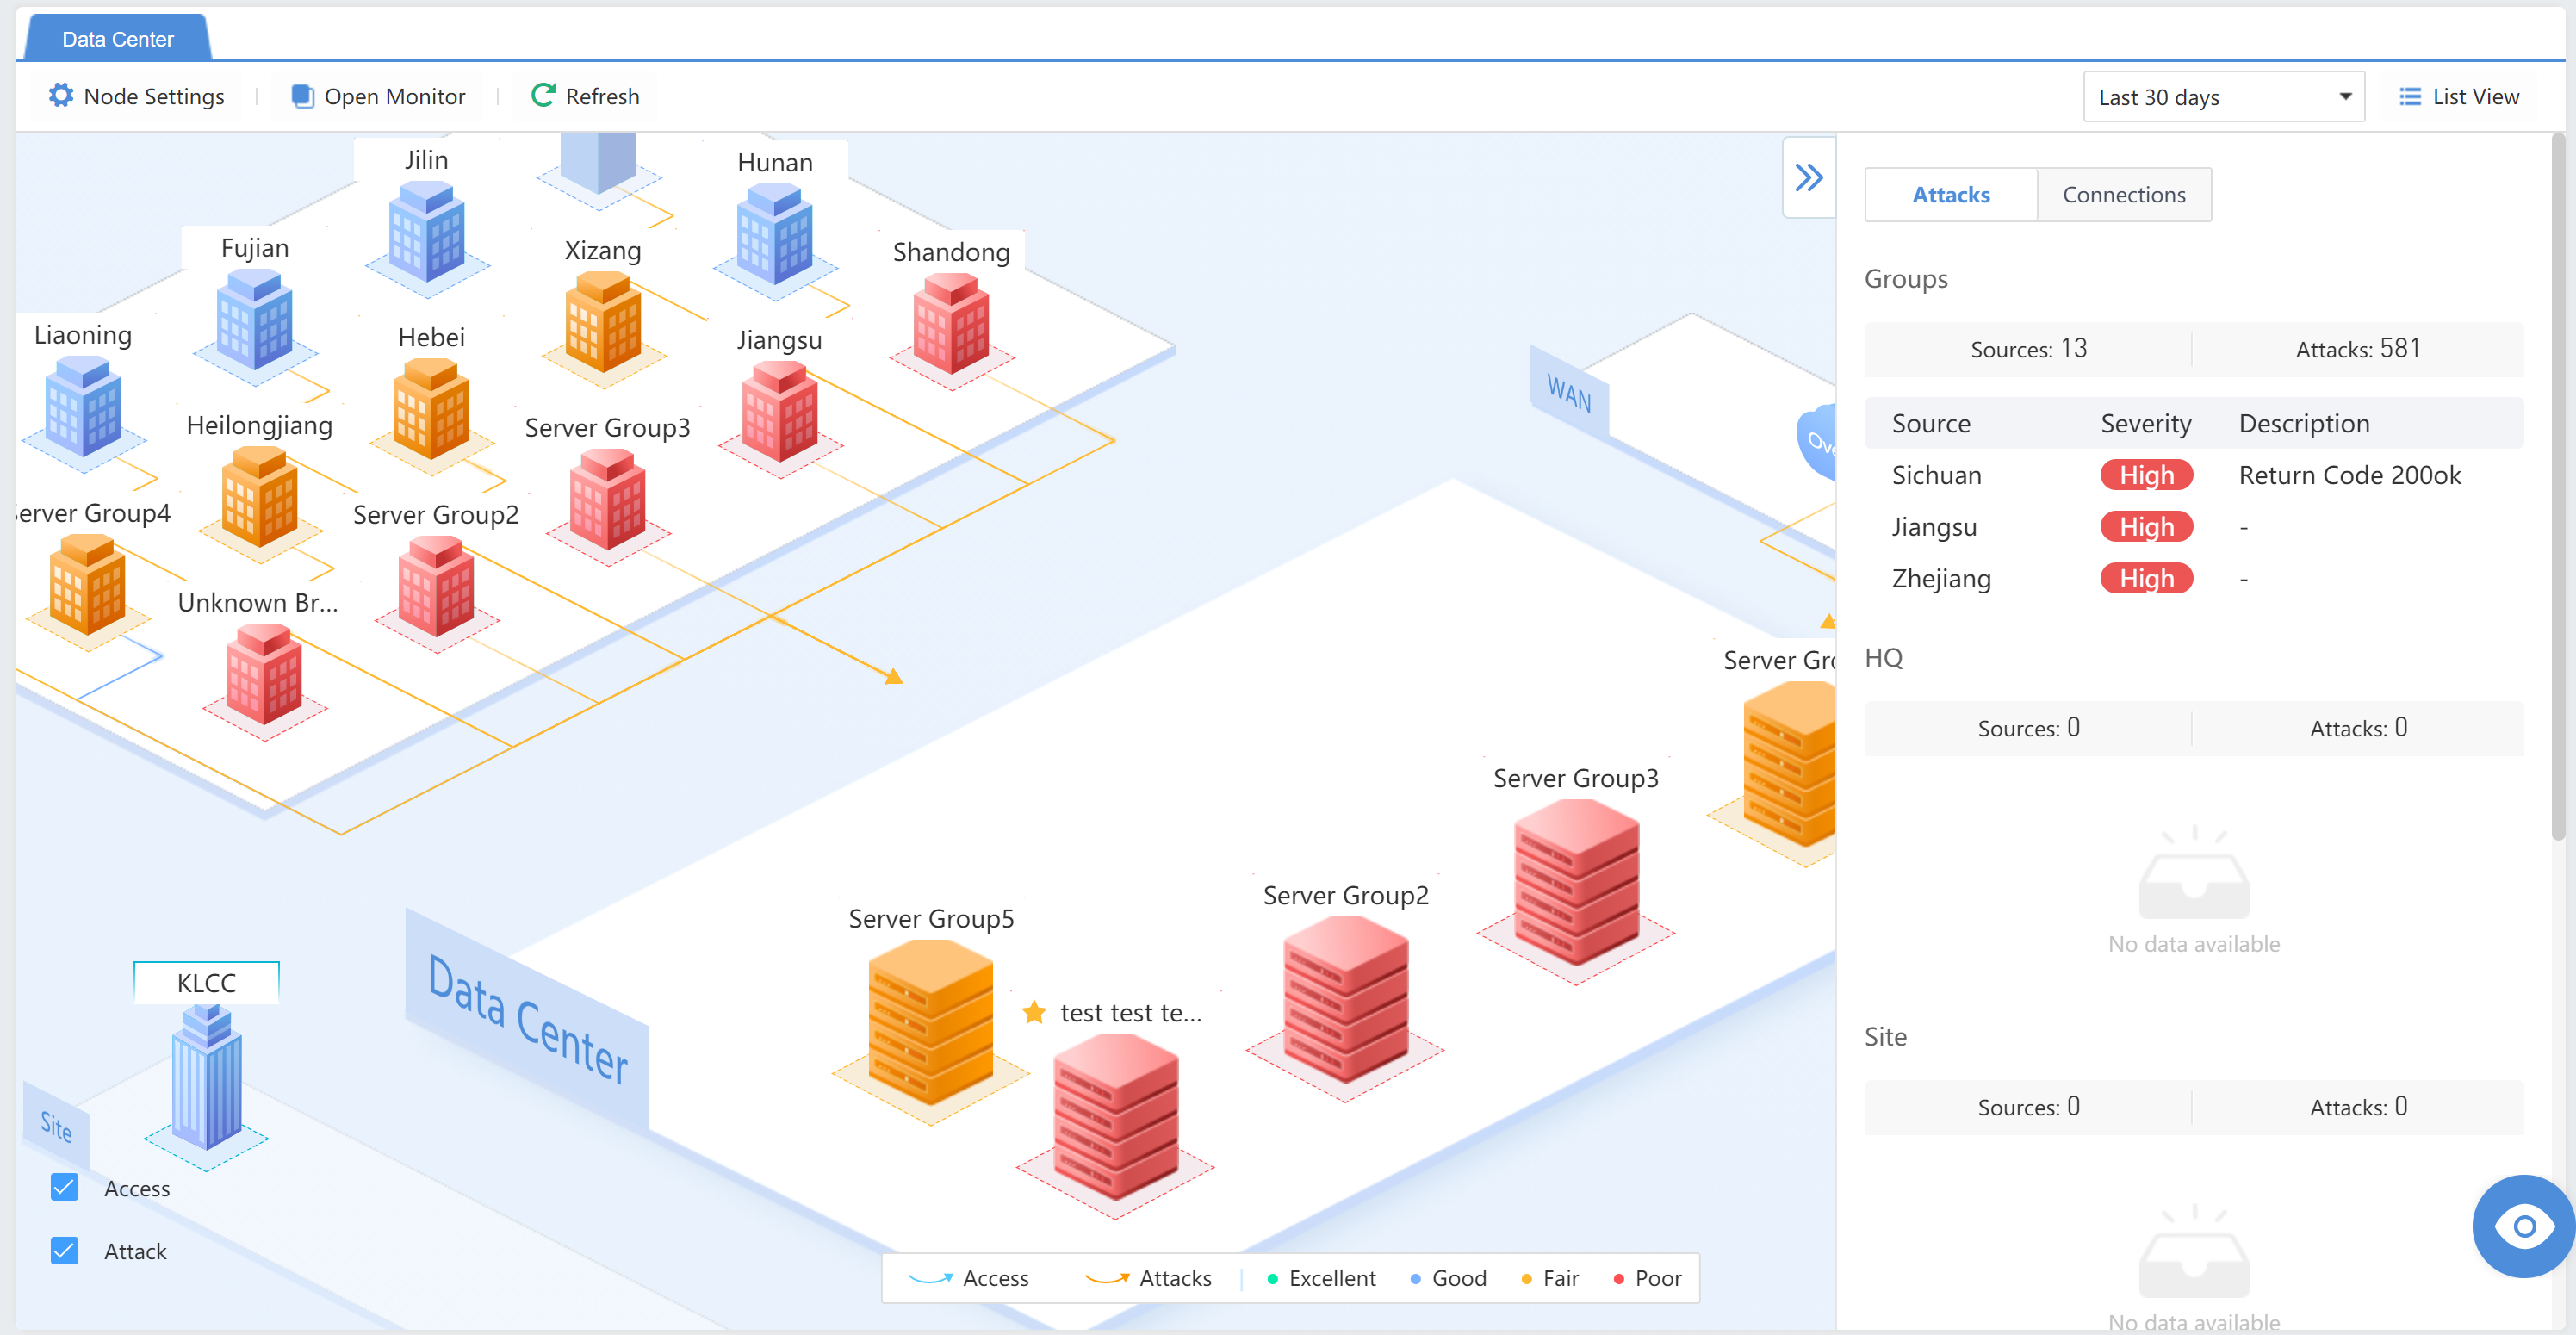
Data Center
Administrators can visually check the security status of server assets and support filtering based on the time range.
ATT&CK Capabilities
The ATT&CK model mainly integrates historical hacking organizations and attacks by using attack strategies as clues to link attack techniques and software corresponding to different attack strategies. It provides an executable and moderately abstract model for information security practitioners. The ATT&CK Capability Map maps the current state of intranet security to the various stages of the model, as shown in the figure below.
Attack Organization or Incident: Famous hacking organizations or attacks in the past, such as APT32, APT28, DarkVishnya, Kinsing, etc.
Engine: It includes Cyber Command’s five major detection engines, i.e. Rule Engine, Threat Intelligence Engine, File Analytics Engine, Attack Analytics Engine, and Abnormal Behavior Analytics Engine.
Hits
Techniques
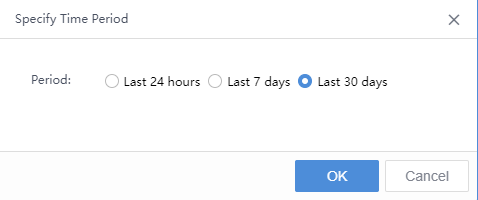
Specify Time Period:By default, it displays the data of the last 24 hours. It also supports displaying the data of the last 7 days and the last 30 days. You can adjust it by clicking , as shown in the figure below.

ATT&CK model phase:It includes Reconnaissance, Initial Access, Execution, Persistence, Privilege Escalation, Defense Evasion, Credential Access, Discovery, Lateral Movement, Collection, C&C(Command control), Exfiltration, and Impact, as shown in the following figure.
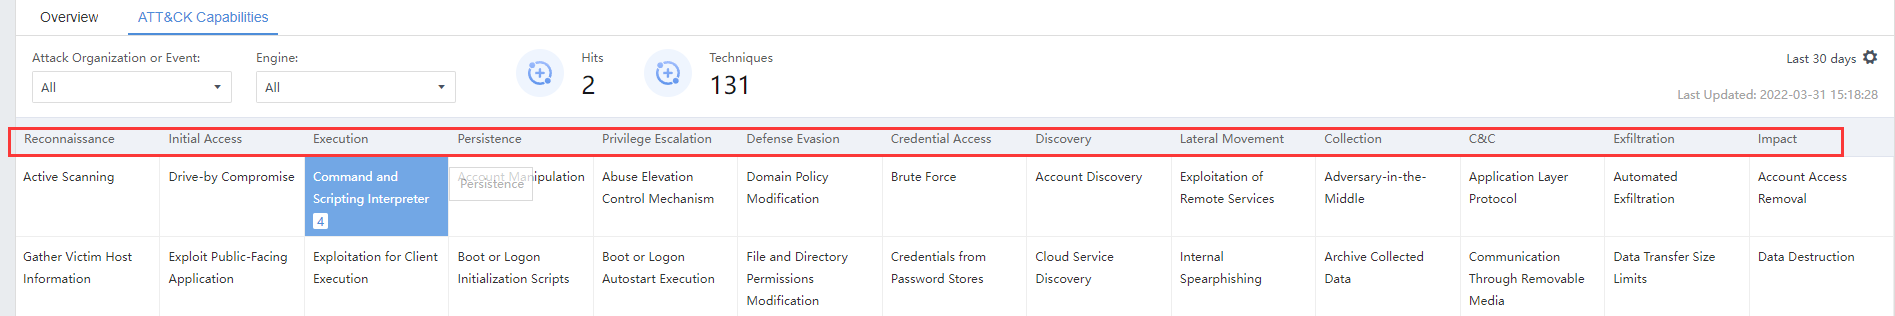
Detection technology cell:ATT&CK capability spectrum below each stage of detection technology. When the color is dark blue, indicating that the detection technology is currently hit. The white color with a specific detection technology name means that the phase Cyber Command has a corresponding detection technology but has not been hit. Null indicates that the detection technology is empty, as shown in the figure below.
Note: The color distribution and detection technology distribution of the ATT&CK capability map will change as the version evolves, the time of Cyber Command deployment on the intranet, and changes in abnormal traffic such as attacks.
At each stage of the ATT&CK graph, several detection technologies of the Cyber Command will be matched. Click the detection technology cell to view the description details on the right side of the desktop, as shown in the figure below.
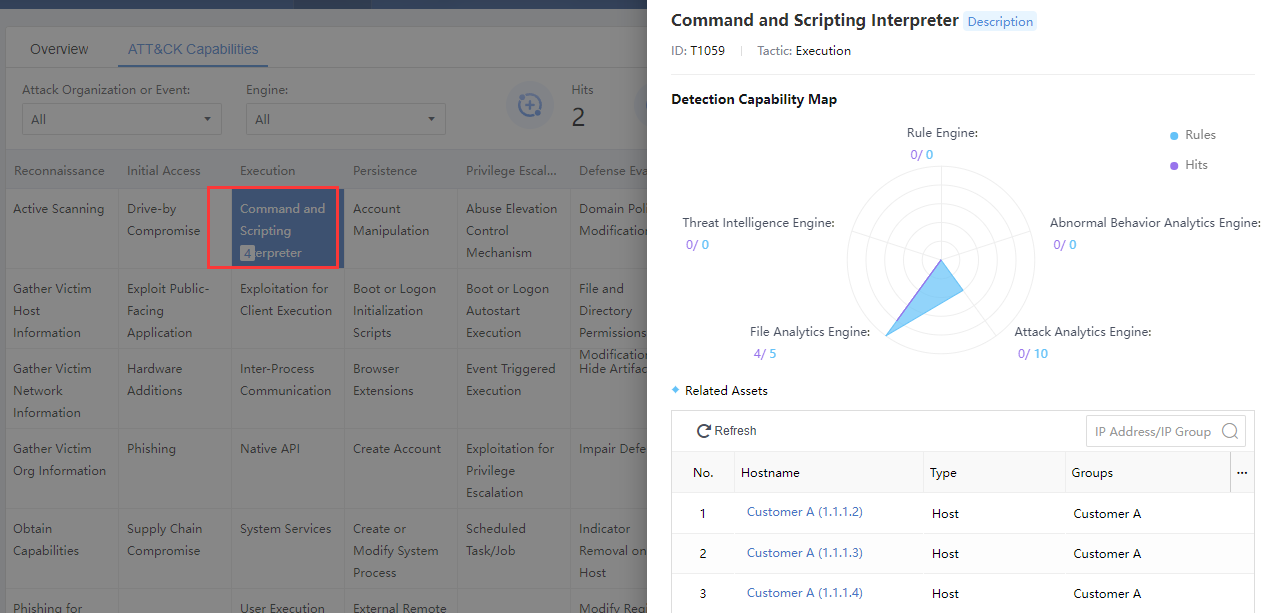
The detection engines include File Analytics Engine, Threat Intelligence Engine, Attack Analytics Engine, Abnormal Behavior Analytics Engine, and Rule Engine. The blue numbers represent the number of rules for the engine types, and the purple numbers represent the number of hits, as shown in the figure below.
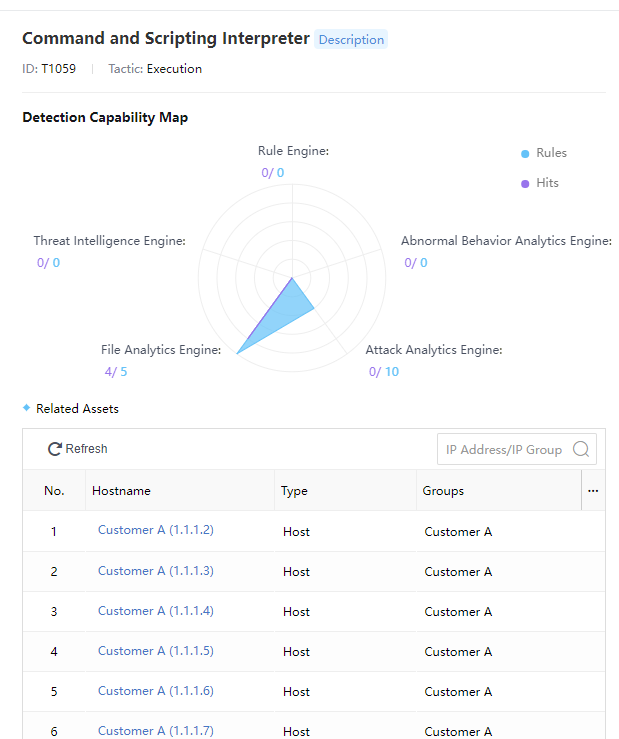
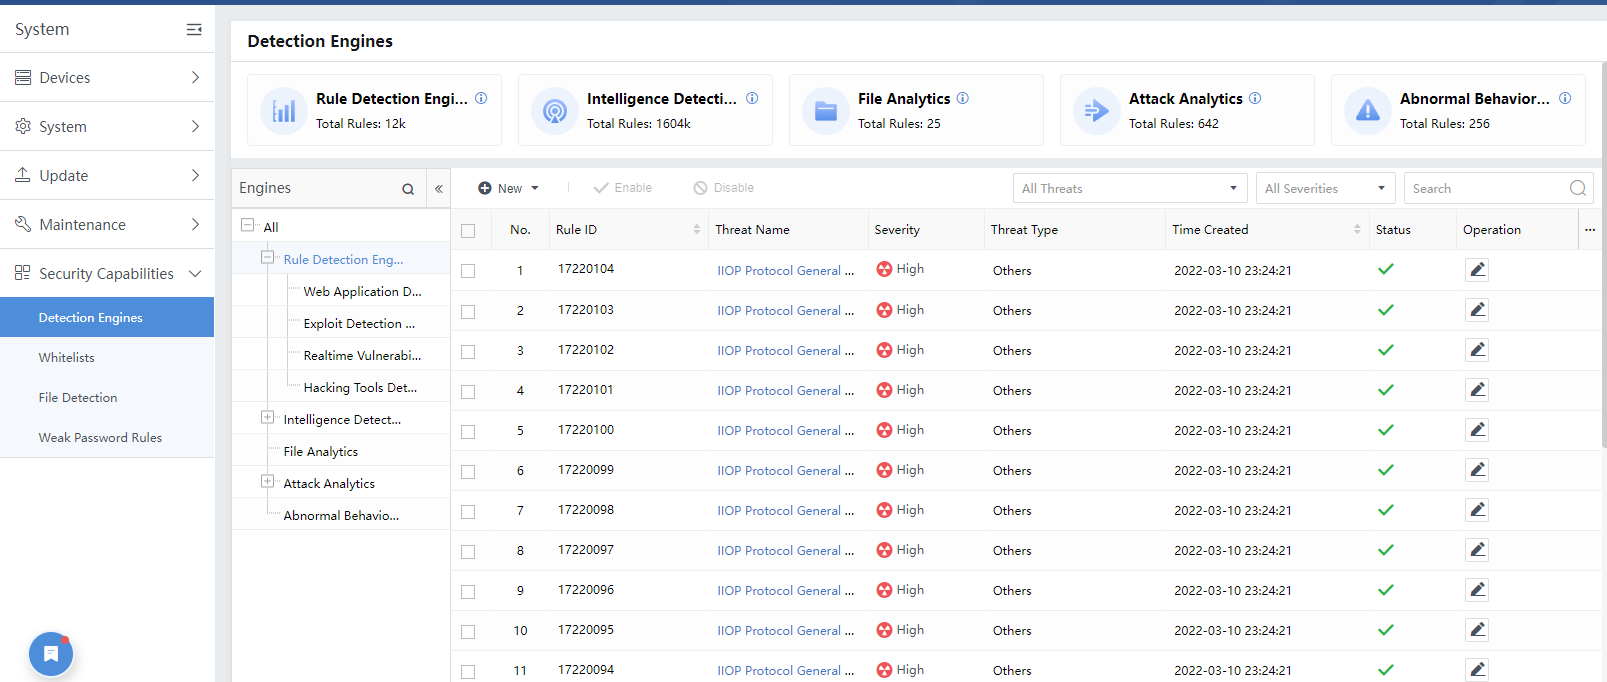
Clicking the number to enter the System> Security Capabilities > Detection Engines page, as shown in the figure below.
Note: ATT&CK and Security Alert are two independent modules. Logically, there is no dependency between the two. The rule’s properties include both ATT&CK-related words and security alert-related columns.
Response
Cyber Command collects log information by accessing devices such as STA (Stealth Threat Analytics) and Network Secure(NGAF). It discovers security incidents in the corresponding services or endpoints based on big data analysis. You can find risky services and endpoints and view, analyze, and handle corresponding security incidents in Response.
Risky Assets
Cyber Command can classify and display risky assets according to risk level, status, etc., so administrators can screen and respond to the risky assets.
Risk Asset Filtering
Administrators can perform filtering in the following ways. Log in to Cyber Command and navigate to the Response > Risky Assets page:
Filter the details of risky assets under the specific asset group through the Groups in the left column.
Status filters risky assets in the same status to facilitate batch fixed, including All, Pending, Suspended, Fixing, and Fixed.
All risky assets with the same risk level are screened by Risk Level, including All, Compromised, High Risk, and Medium. When the risk level of the risky asset is Compromised or High, the administrator needs to fix it promptly to avoid business interruption caused by the spread of risk.
Note: Compromised events occurred in the following attack stages: C&C, propagation, and impact. The endpoint has been or is about to be controlled. Please fix it as soon as possible.
High Risk Incident occurred in the following attack stages: weaknesses found, reconnaissance, and exploitation. Please fix it as soon as possible.
- Filter all risky assets within a specific period by Period to view and handle the risk details. The time range includes the Last 30 days, the Last 7 days, the Last 24 hours, and Custom.
Cyber Command supports filtering by IP, IP range and hostname.
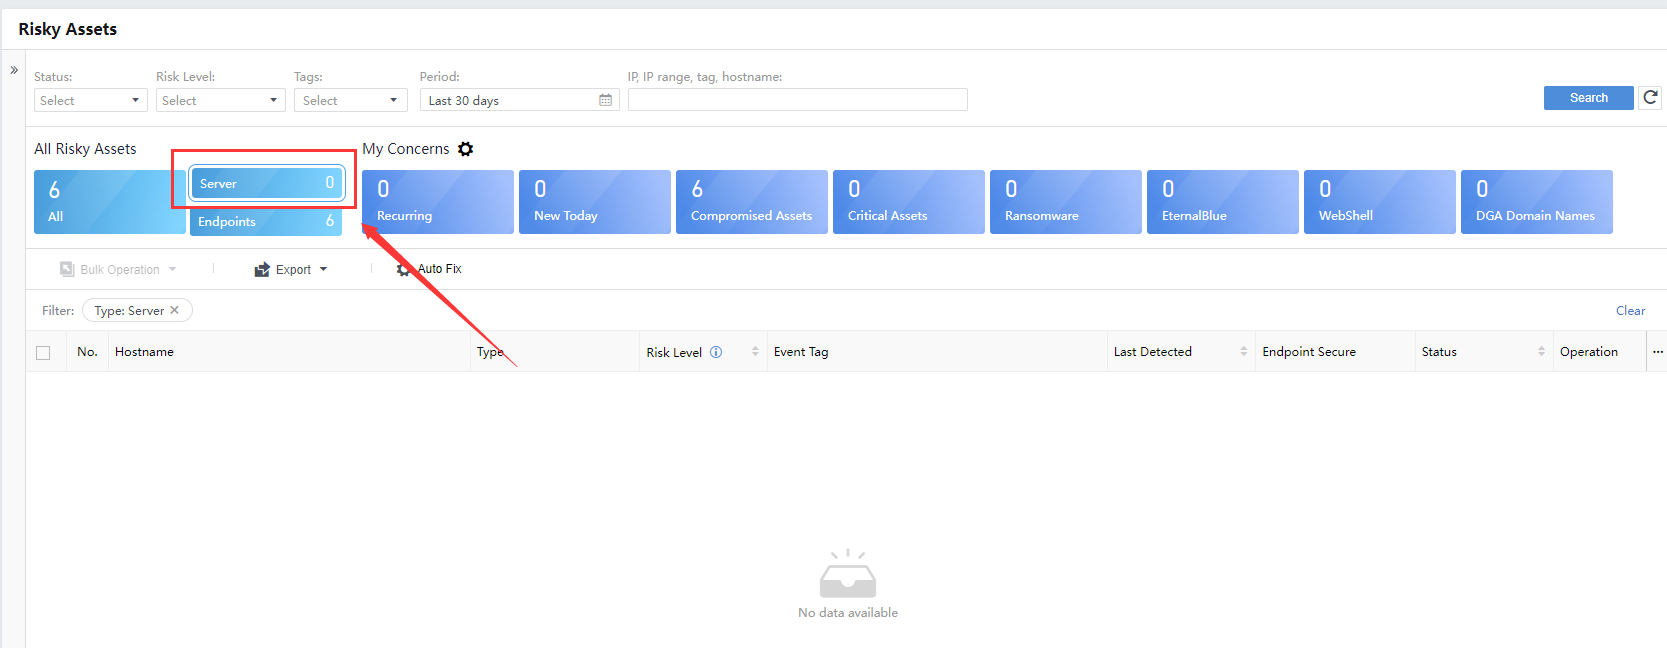
Module filtering is also supported. For example, if you click Server, all risky assets with the asset type of server will be displayed in the list.
Filtering in one or more ways helps administrators locate risky assets accurately and respond to them by analyzing their details in multiple aspects. For example, the filter will also filter the asset group and list data, as shown below. At the same time, the filter box will remember your last selected filter criteria, so you do not have to select it again.
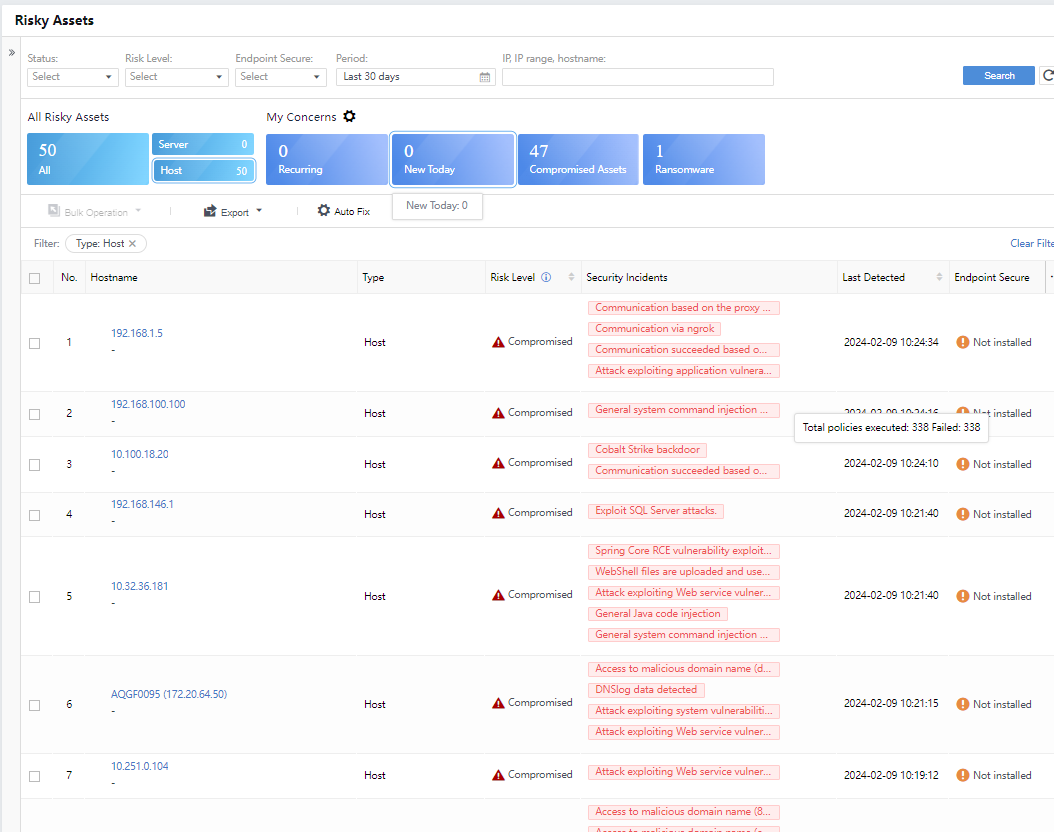
View Risky Assets
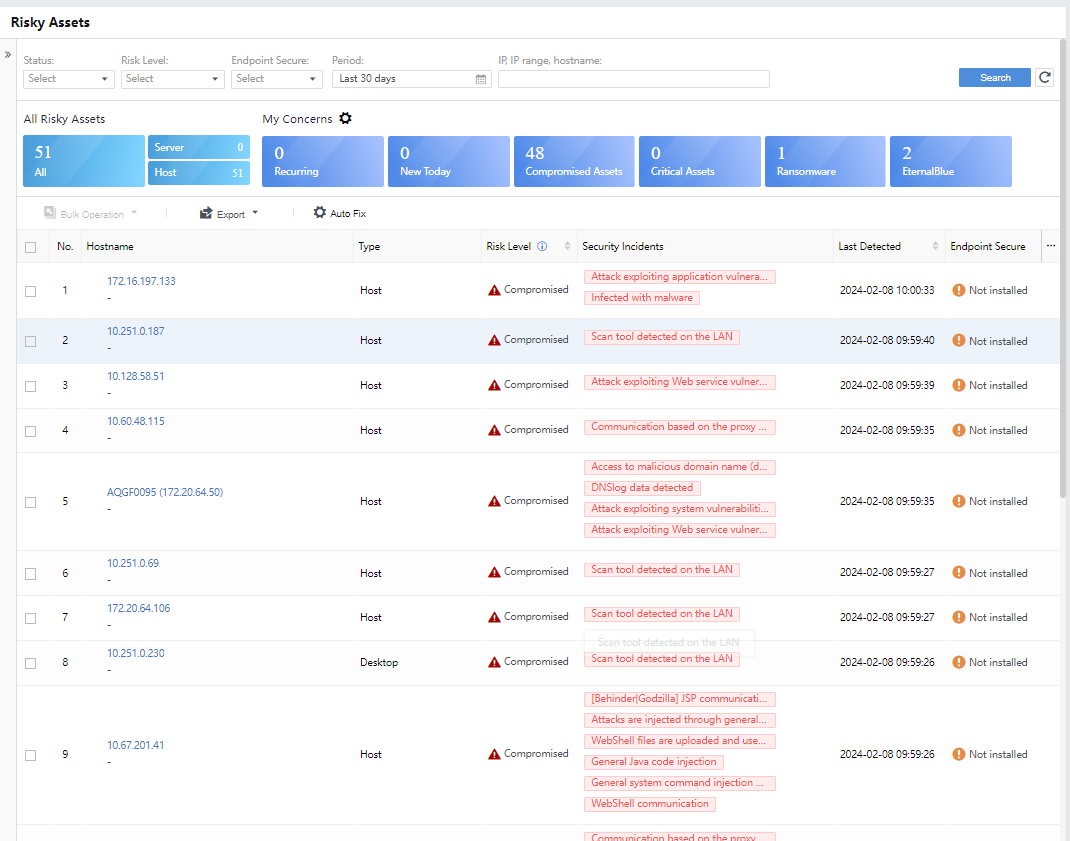
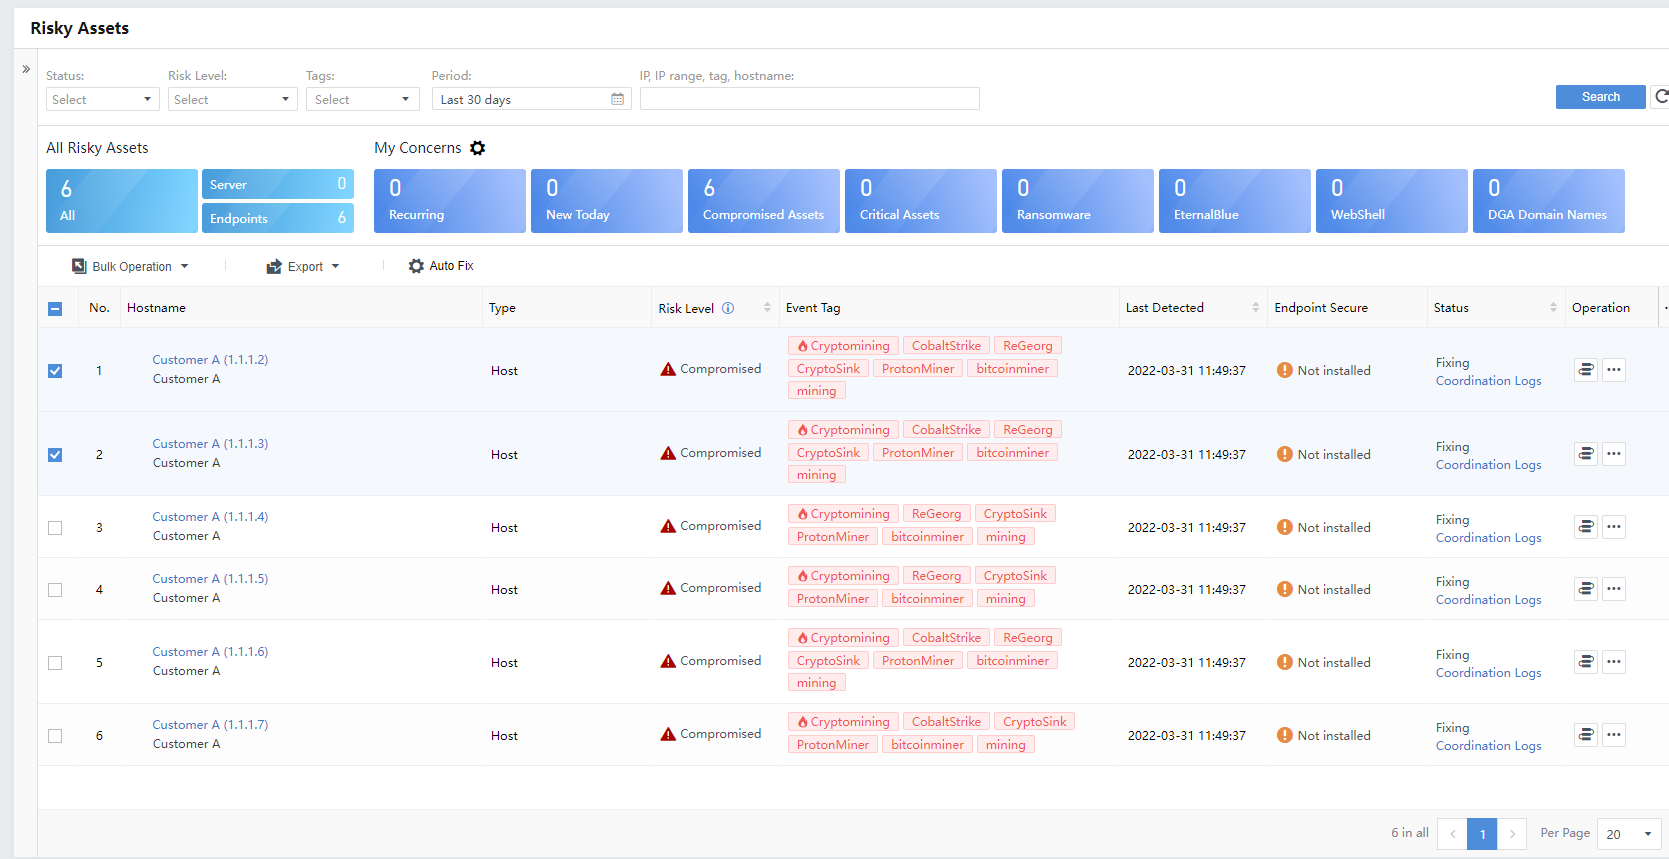
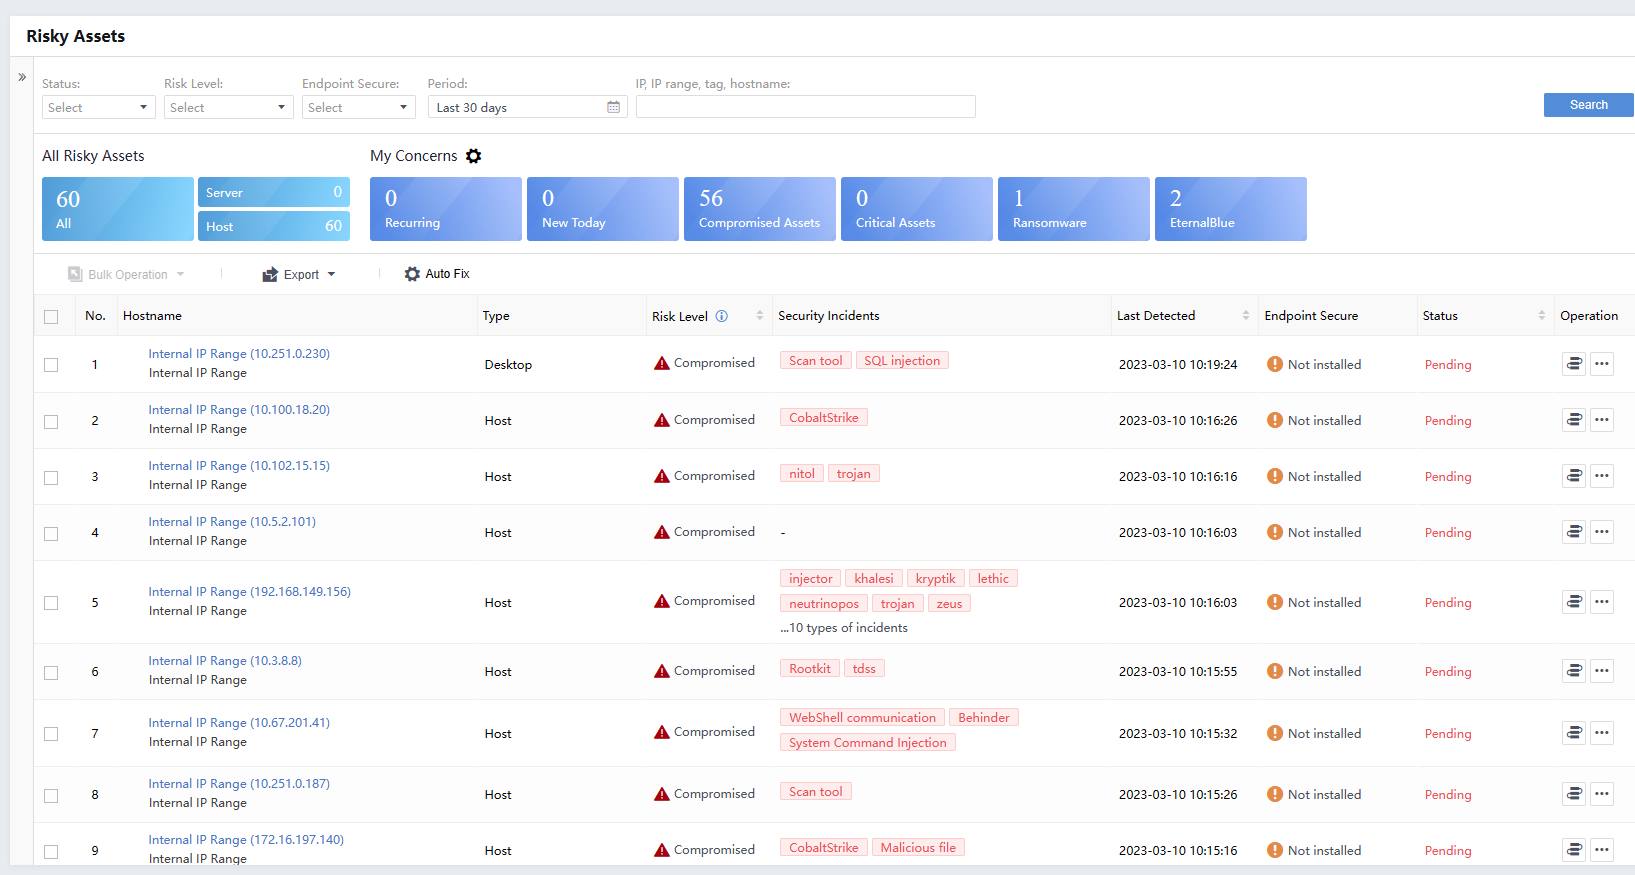
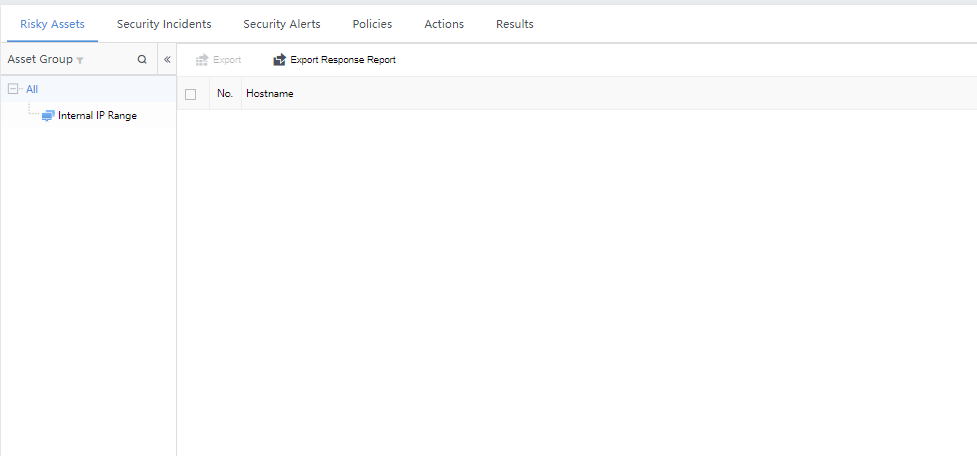
On the Risky Assets page, administrators can view the asset organization structure of the current platform, an overview of all risky assets, details of the asset risks of My Concerns, and a list of risky assets, as shown in the following figure.
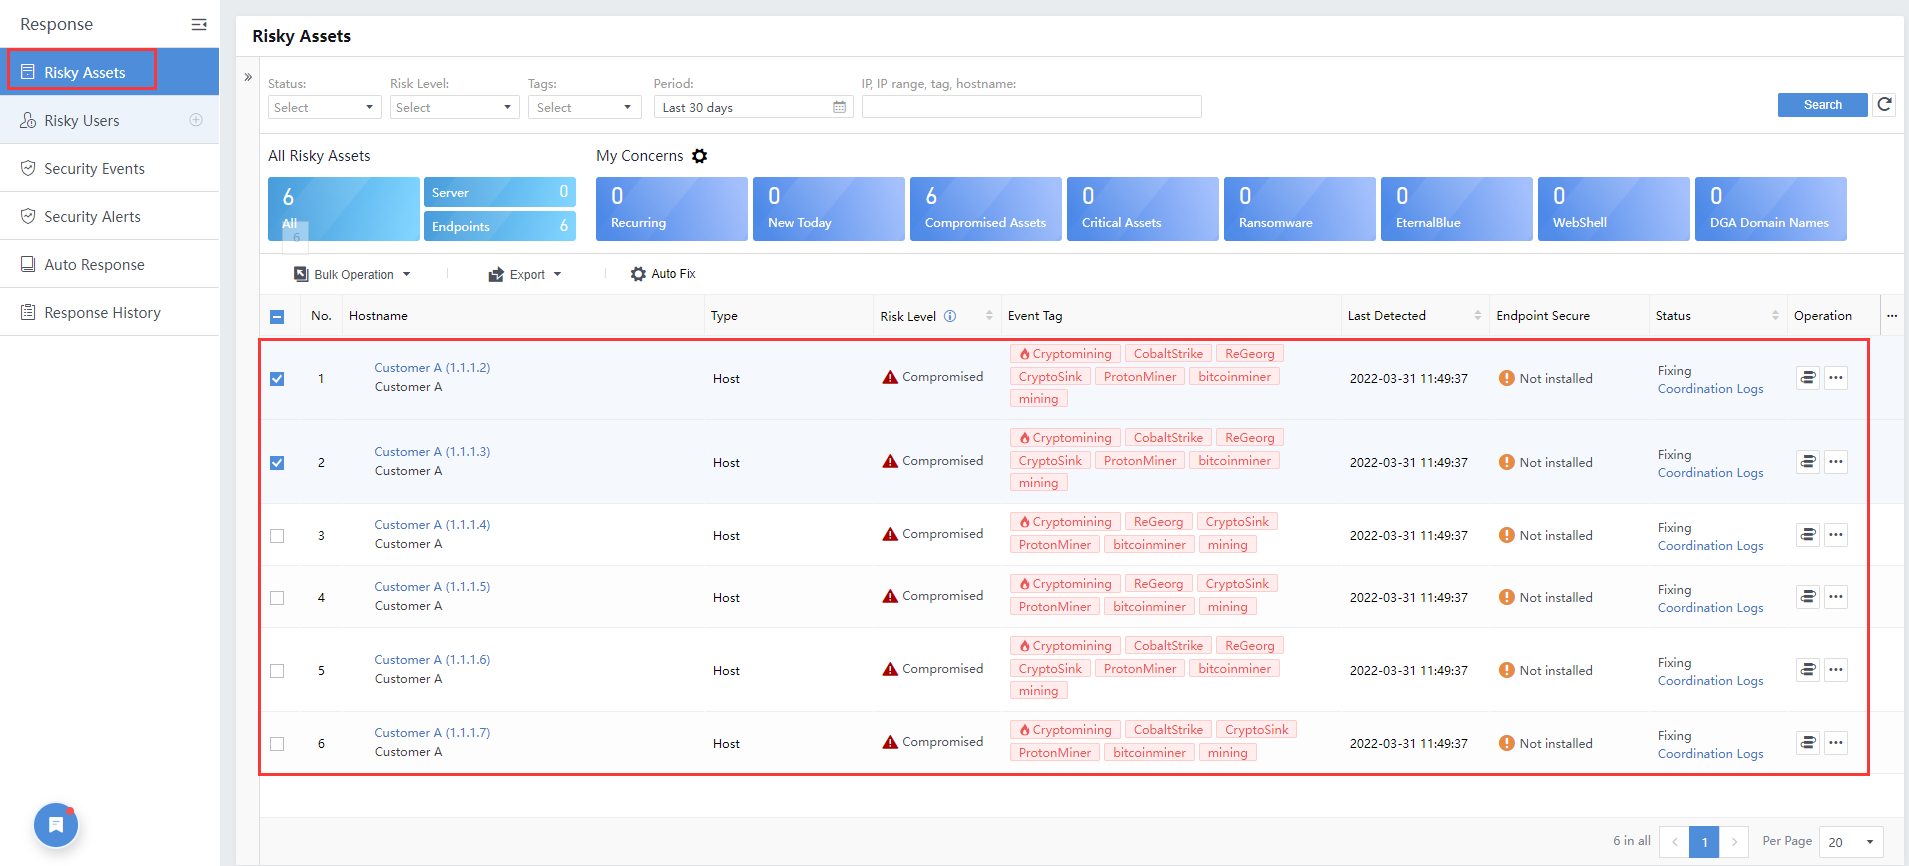
All Risky Assets
By default, the platform displays all the risky assets in the last month, identified as risky hosts and risky servers. It can be filtered according to requirements. The filter will filter the asset group, my concerns, and the list of data. Click the hostname to view the corresponding risk asset details in the asset list.
My Concerns
The administrator can specify the content to follow by clicking the item under My Concerns. You can display the filtered content and click the icon again to cancel the filter.
Configure My Concerns
Click the configuration button to configure My Concerns, as shown in the figure below:

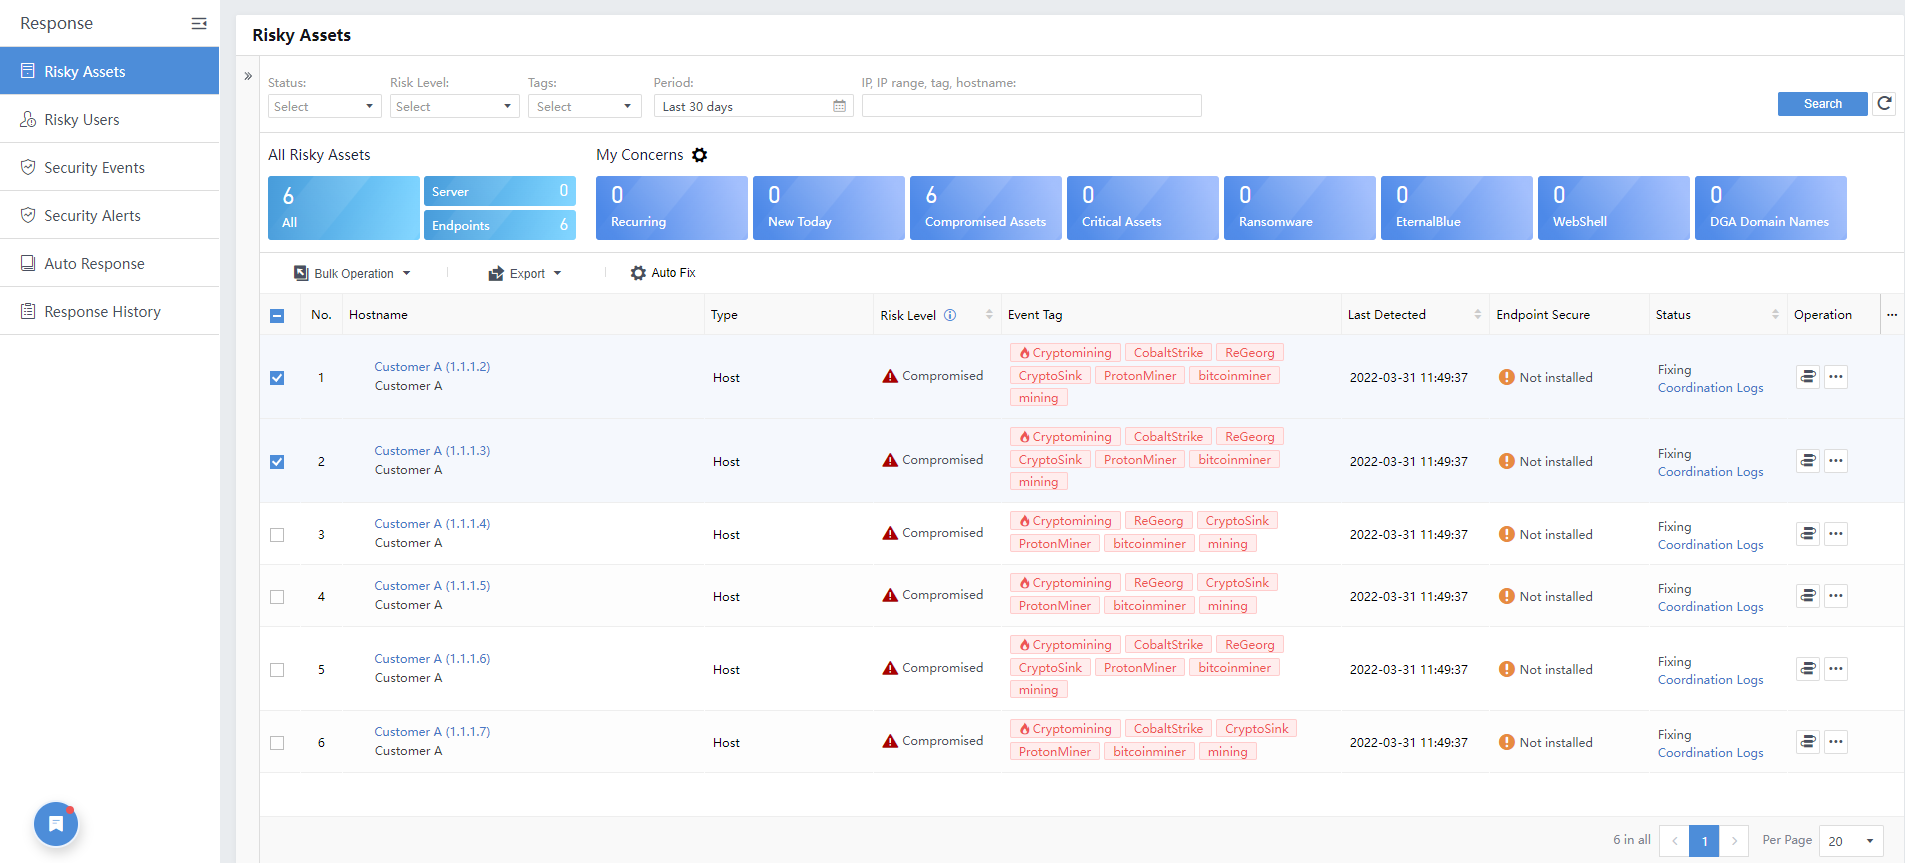
You can customize My Concerns. By default, it will show Recurring, New Today, Compromised Assets, Critical Assets, Ransomware, Eternal Blue, WebShell,and DGA Domain Names. You can uncheck the box if you do not want to show a specific item.
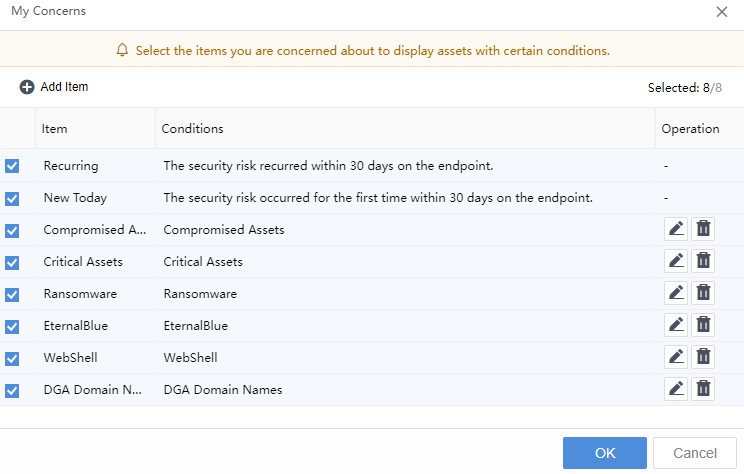
You can also add a new My Concerns group, configure the content, and check the box to display it. Take the example of configuring the item type of the Conditions group. For the groups you follow, you can also edit them by clicking the edit button.

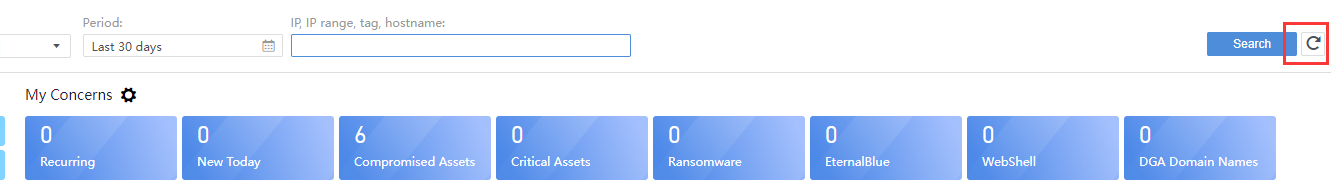
Click the button to refresh the content list after configuring My Concerns, as shown in the image below.
- Risky Assets
Administrators can view the Hostname, Risk Level, Type, Security Incidents, Last detection,Endpoint Secure in the list.
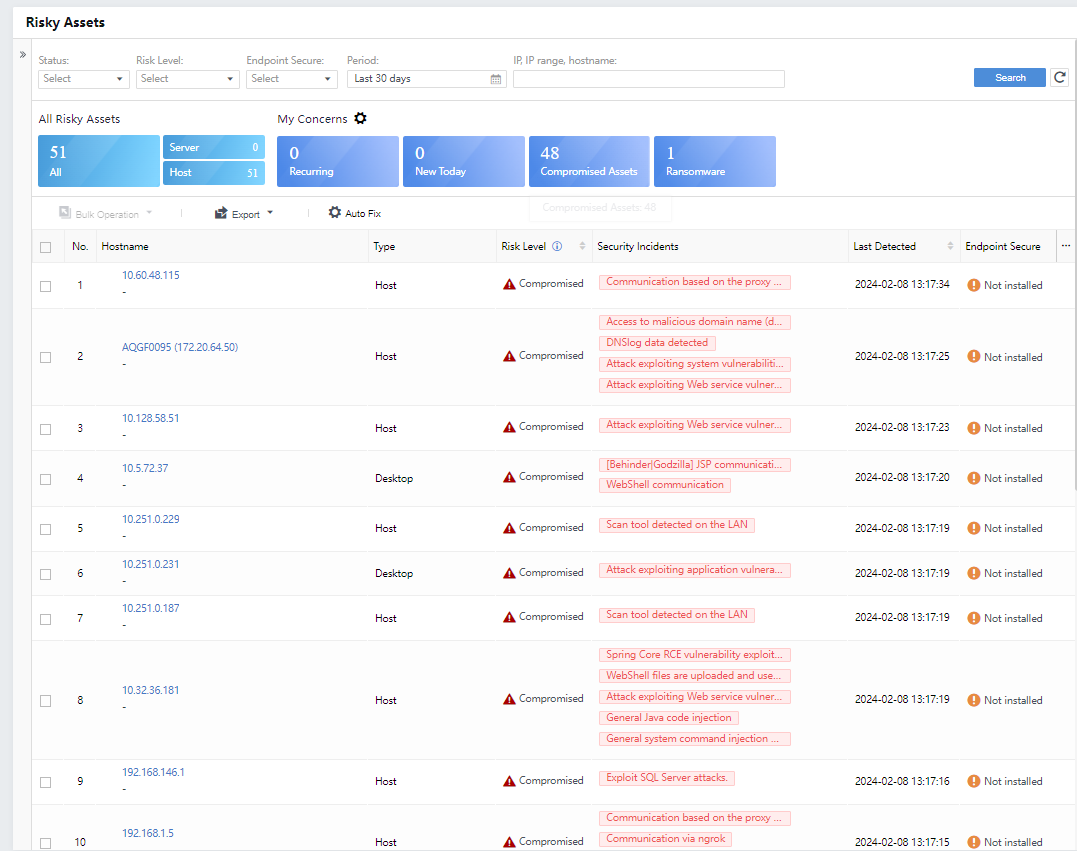
Click the icon under Operation to handle the corresponding incidents:
- By Server
Under All Risky Assets, click Server, and the list displays all risky assets classified as the server.
Click the listed Hostname to view the details of the risky server, displaying data statistics, security incidents, event perspectives, and threat entities, as shown in the following figure.
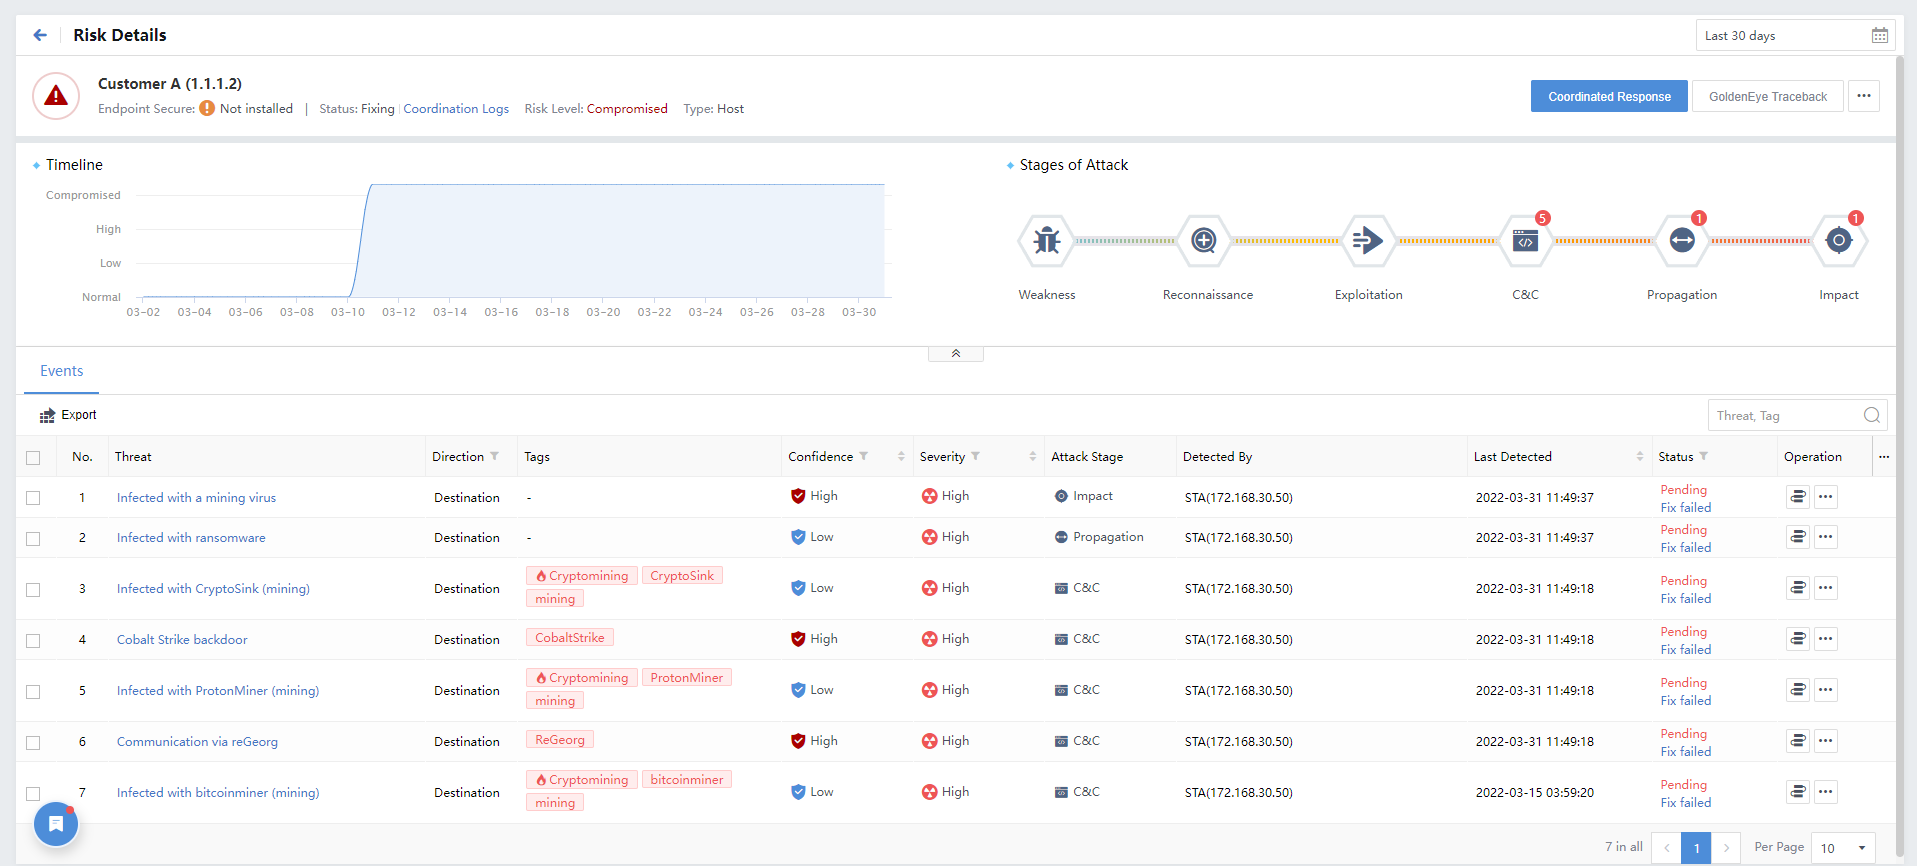
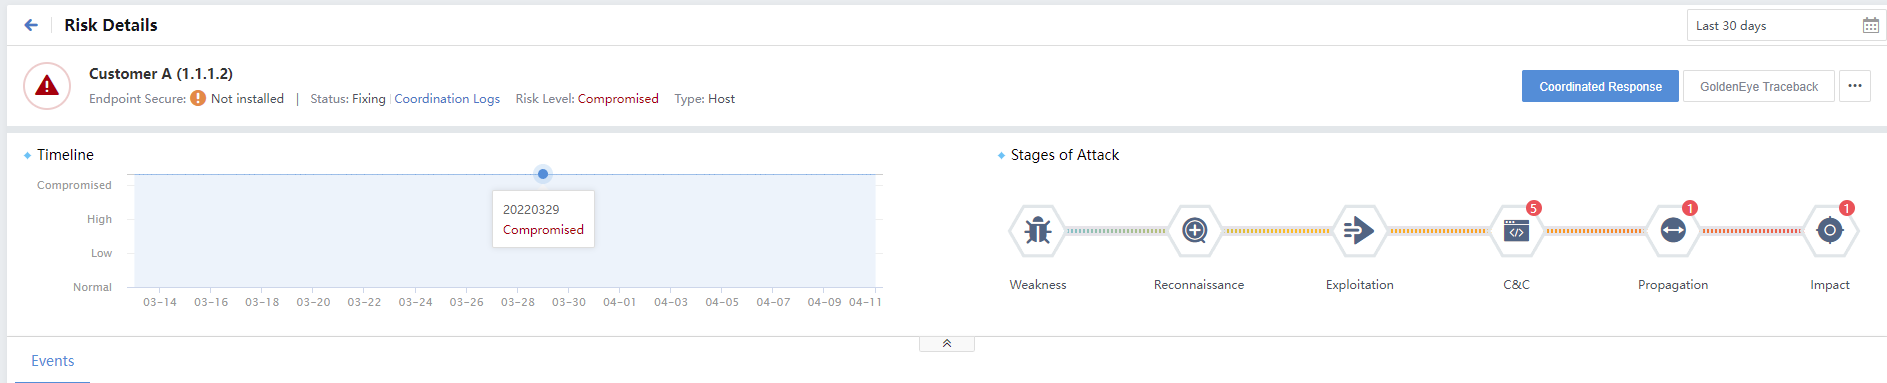
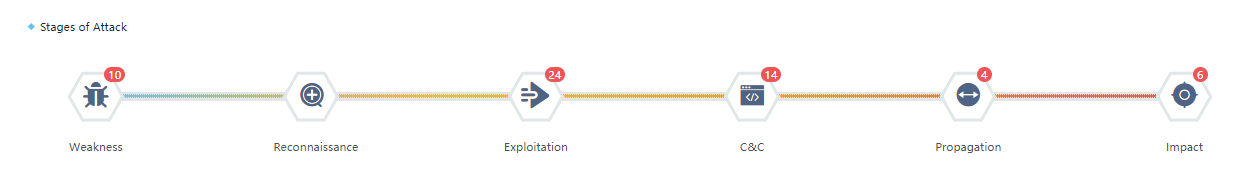
By default, the Timeline and Stages of Attack distribution are displayed under the statistics column, as shown in the following figure.
Click the Threat name to view detailed information such as Threats, Hit rules, Recommendations, and the risk of specific security incidents, as shown in the following figure.
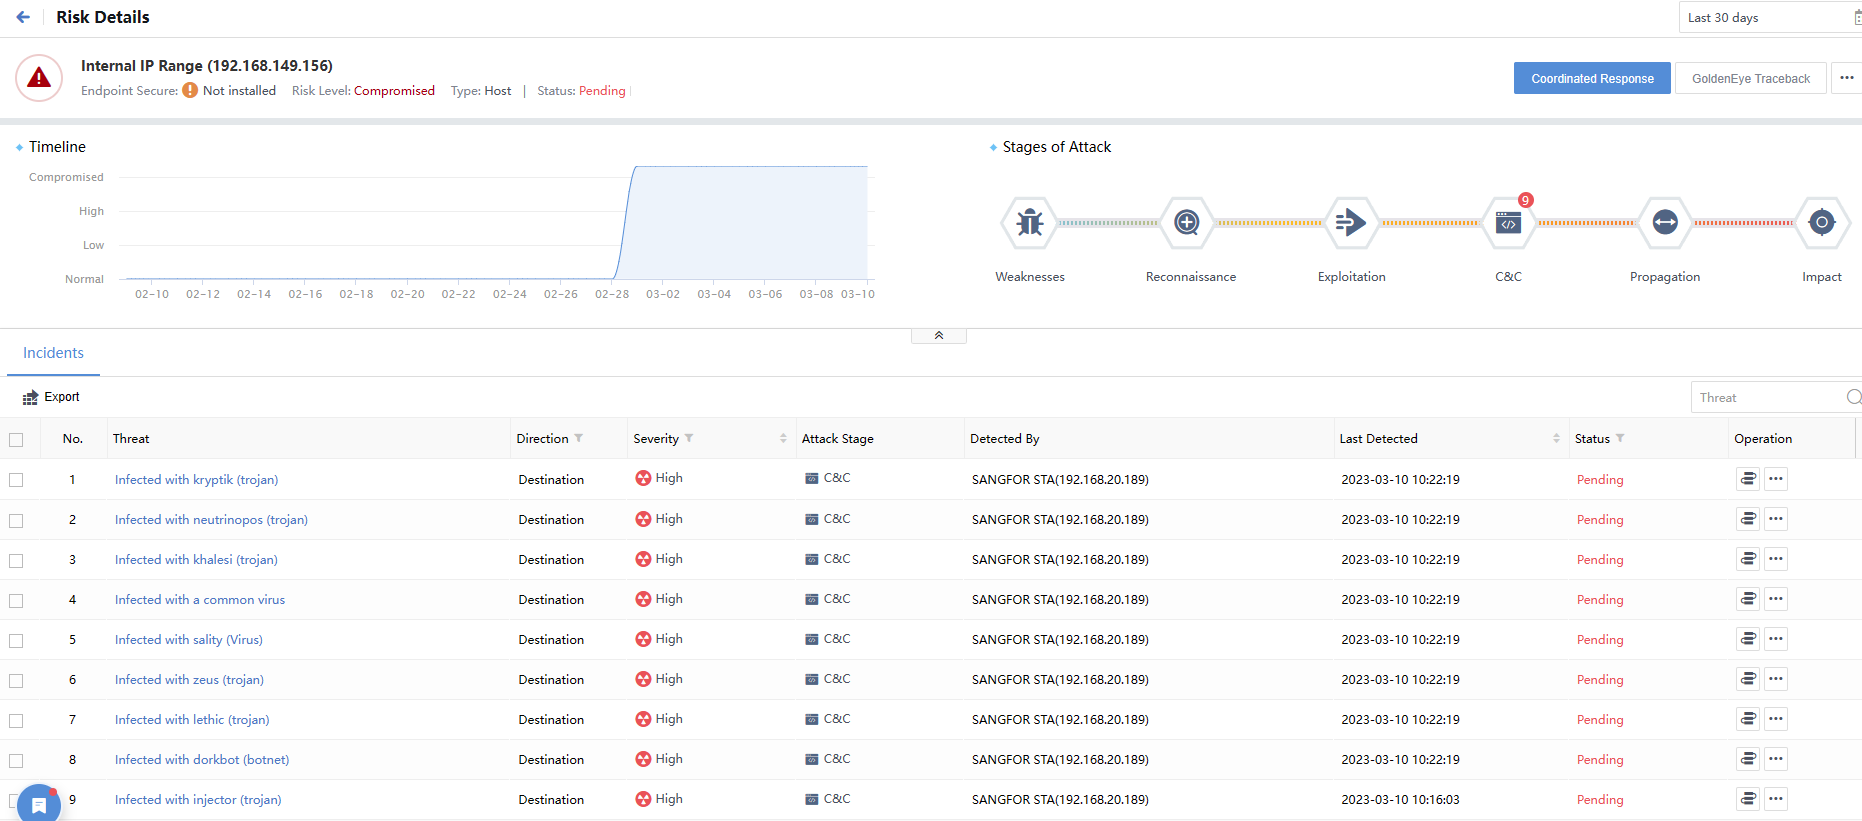
- By Host
Under All Risky Assets, click Host, and the list displays all risky assets classified as the host.
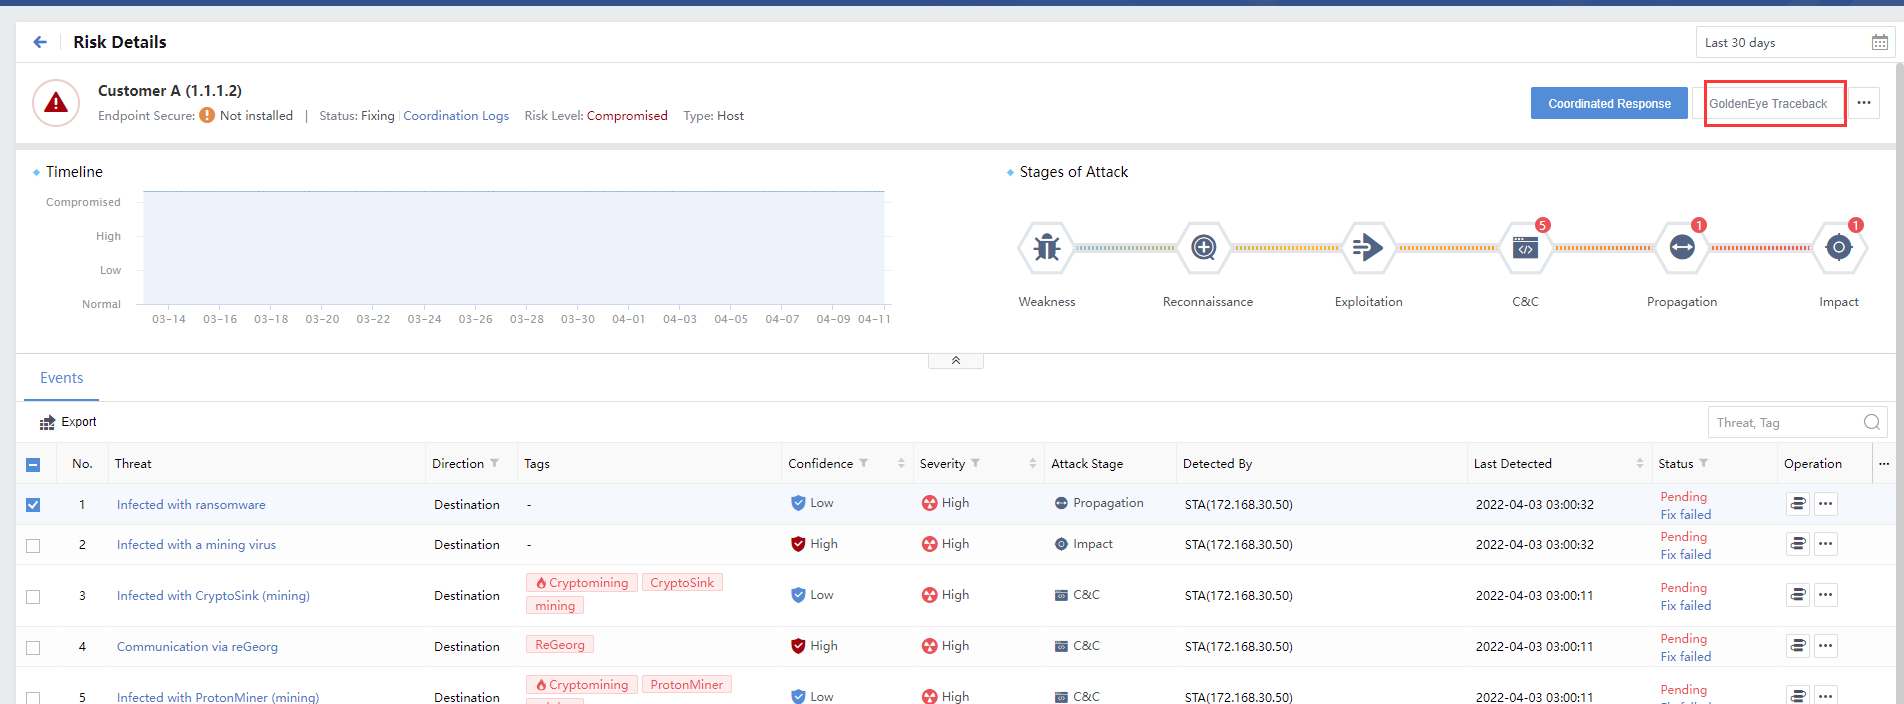
Click the hostname to view its risk details, showing the stages of attack, incidents, threat entities, etc., as shown in the following figure.
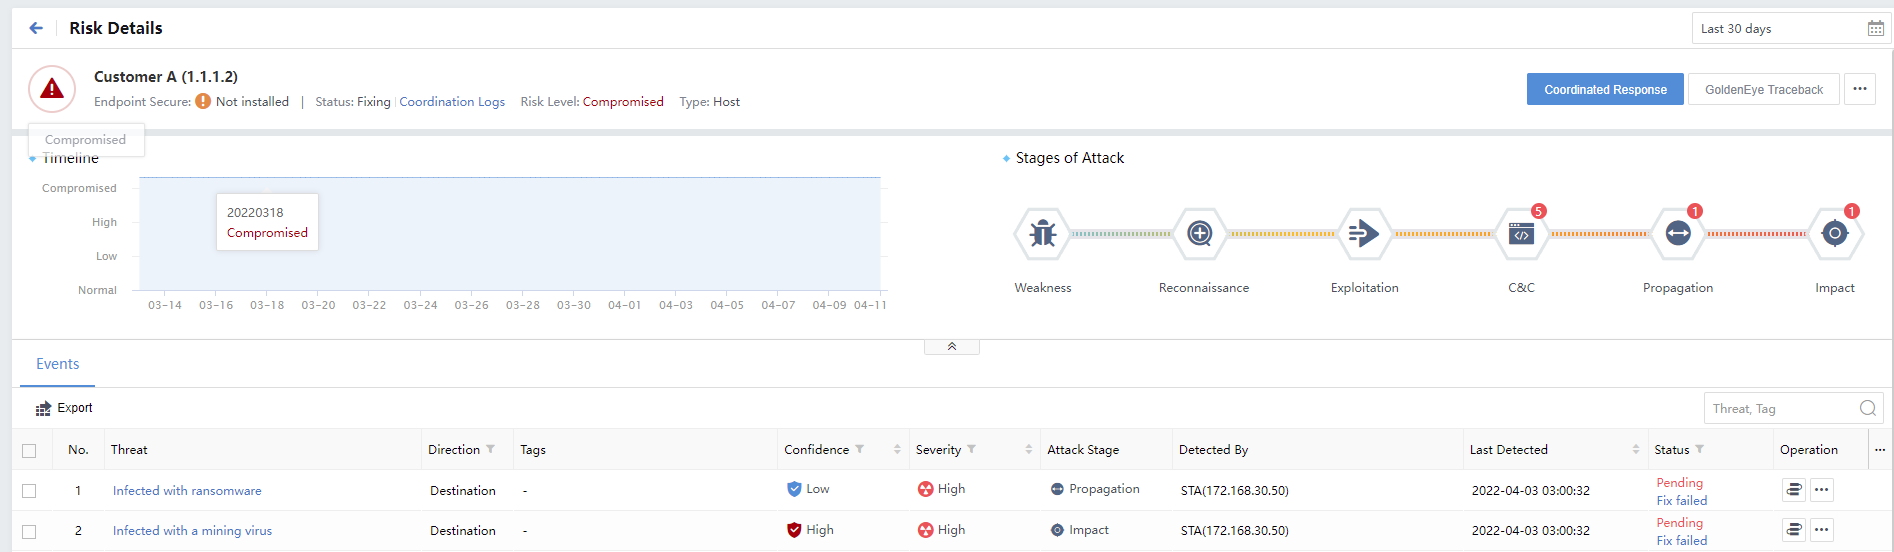
Click a specific event to view the detailed information, such as Original Logs, Recommendations, and risk impact of the events, as shown in the following figure.
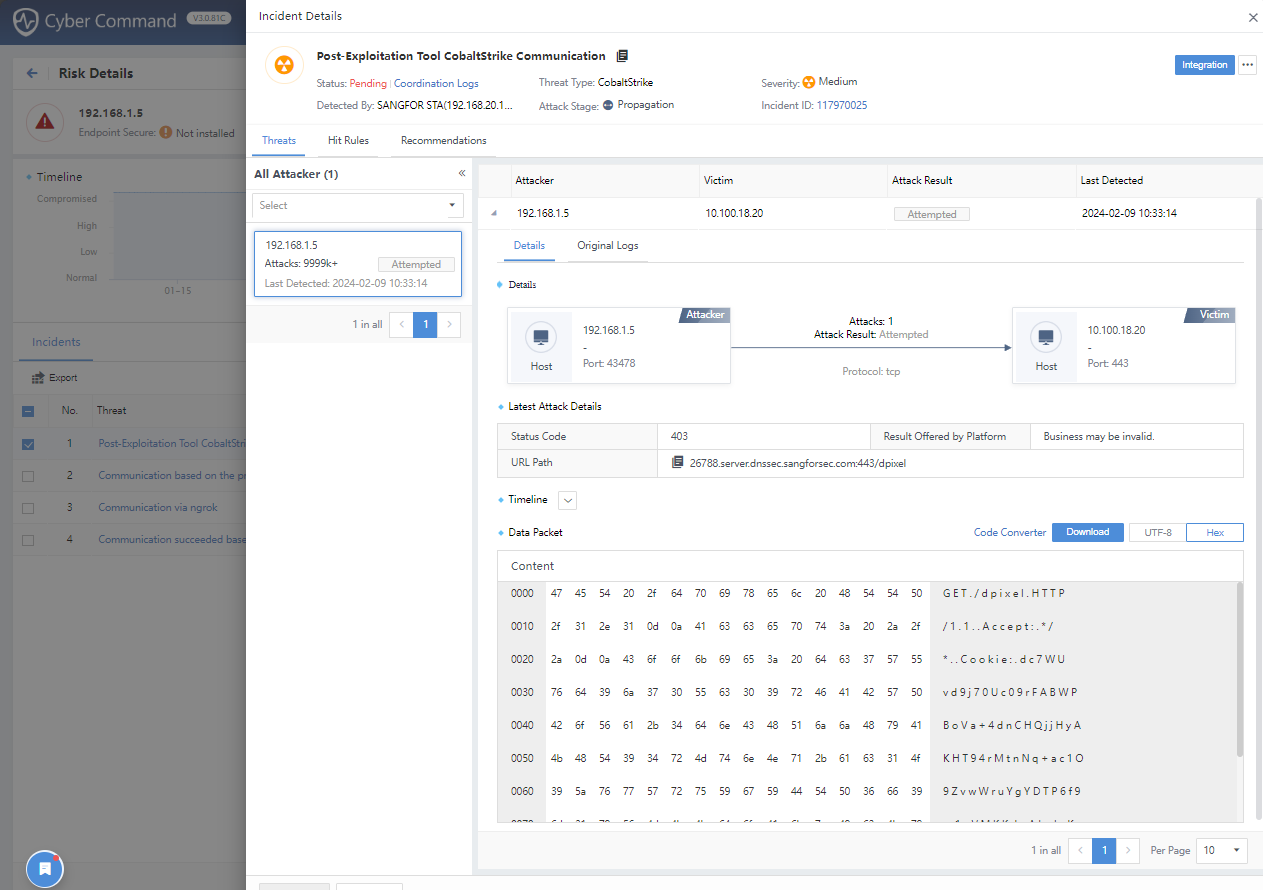
On the Risk Details page, click GoldenEye Traceback. You can view the Access, Asset Details, Security Incidents, Security Alerts, Traceback, etc., as shown below.
- Export the risky assets
You can export the list and risk report on the Risky Assets page. Click the icon to export all the current page data by default, and the file format is.xlsx. At the same time, click a specific risky asset IP to go to the Risk Details page. On the Risk Details page, you can export the list of Security Incidents.
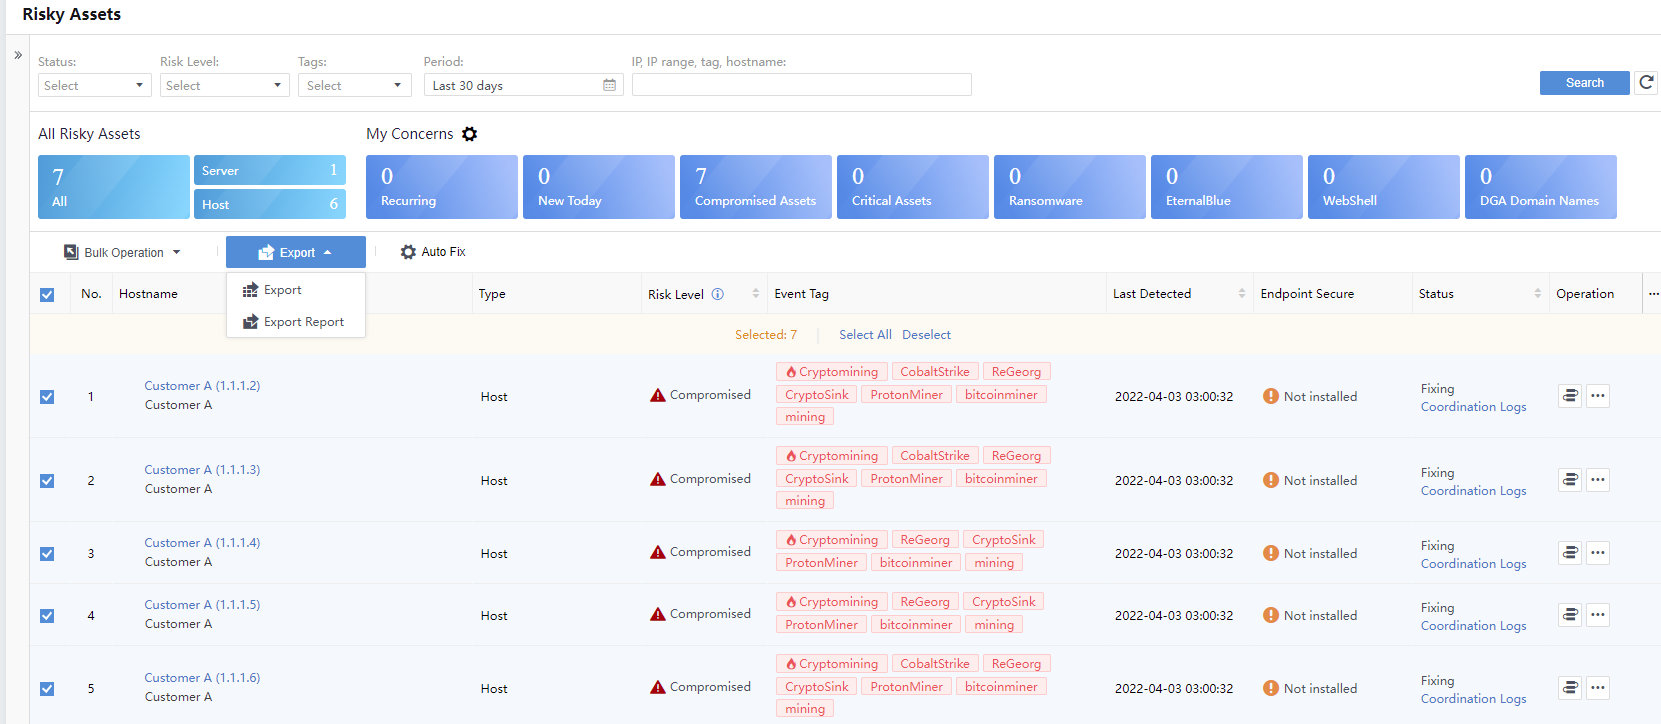
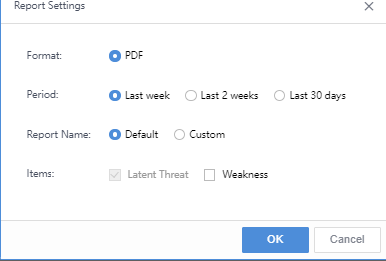
Click Export > Export Report to configure the report as required, such as Format, Period, Report Name, and Items, as shown below.
- Edit Endpoint Secure Forensics
After Endpoint Secure accesses the Cyber Command platform, the risky endpoint on the Endpoint Secure side synchronizes the botnet logs to the platform. Cyber Command can display the process and file information of accessing malicious domain names to help users conduct research and judgment. Hover the mouse over the operation column and click the icon to obtain the forensic information.
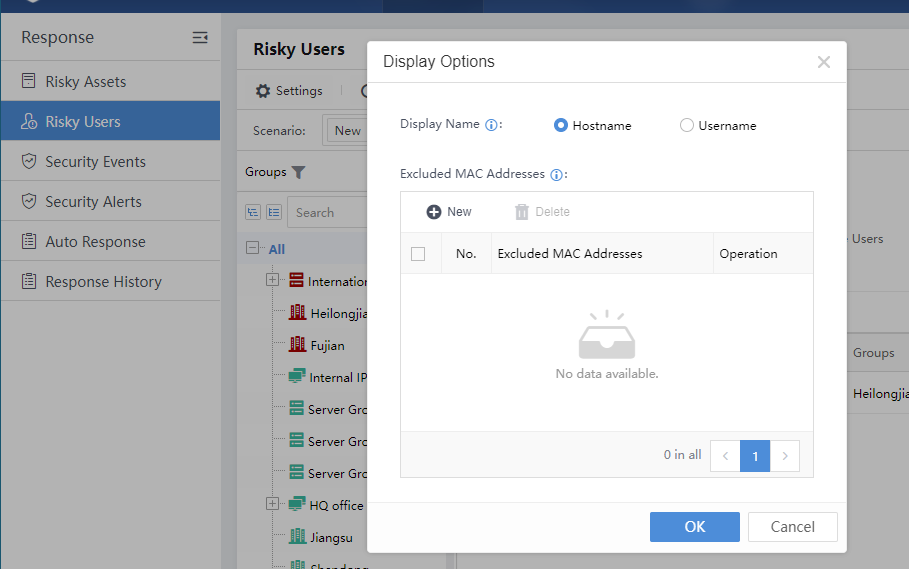
Risky Users
User’s Source
It is required to correlate with Internet Access Gateway(IAG), SSLVPN, and WAC to use their user authentication information. The discovered risky endpoints can be directly viewed in Risky Users.
Navigate to Response > Risky Users, then click Settings to select the display name: Hostname or Username.
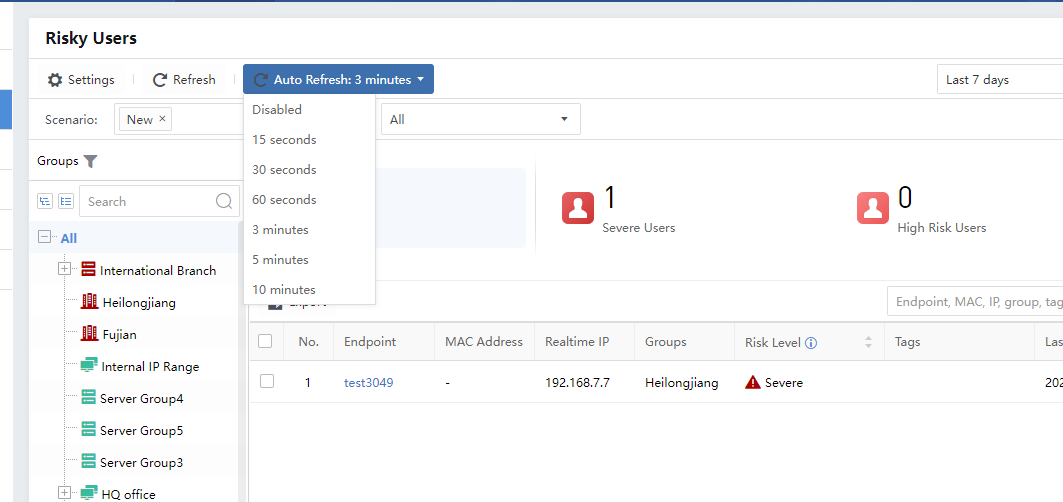
View Risky Users
The default Auto Refresh time of the Risky Users is 3 minutes for data synchronization. You can manually select other time frequencies, as shown in the figure below.
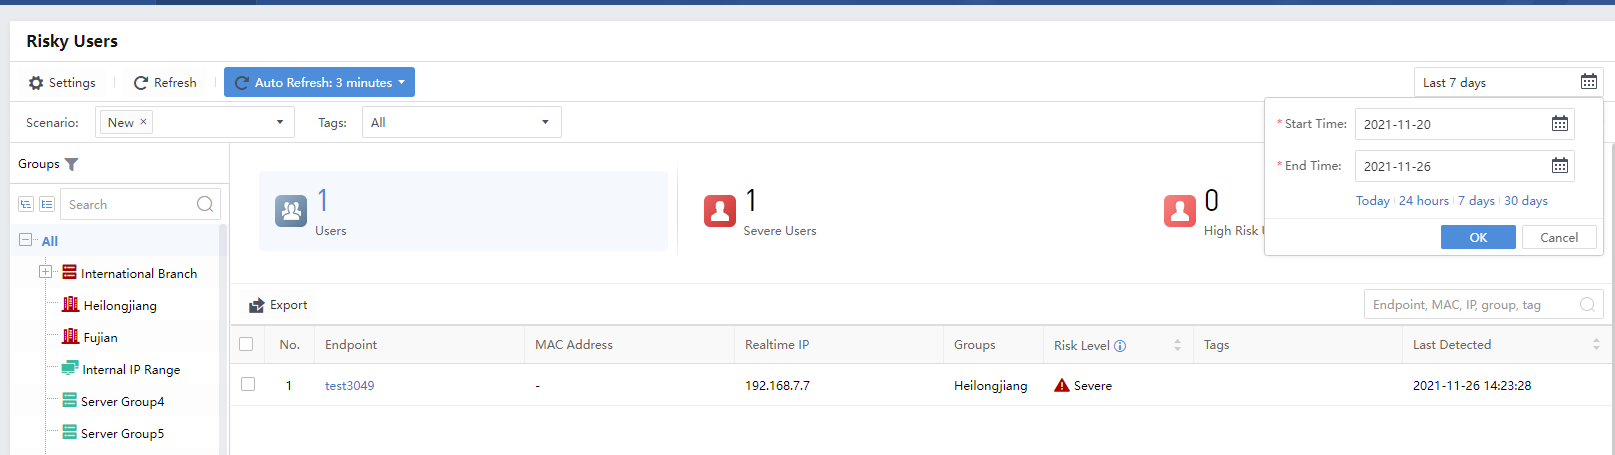
There are two scenarios for risky users: All in Groups and Today. For risky users who only pay attention to the day’s data, select Today as the Period. You can select a maximum of 30 days, as shown below.
Security Incidents
Security Incidents
The threat perspective mainly provides queries, statistics, traceability, and proof of Security Incidents and Security Alerts. Security Incidents are obtained by correlating multiple aspects, such as high reliability, high threat, and successful attack Security Incident based on Security Alerts and matching them through a special built-in algorithm.
Security Incidents Filtering
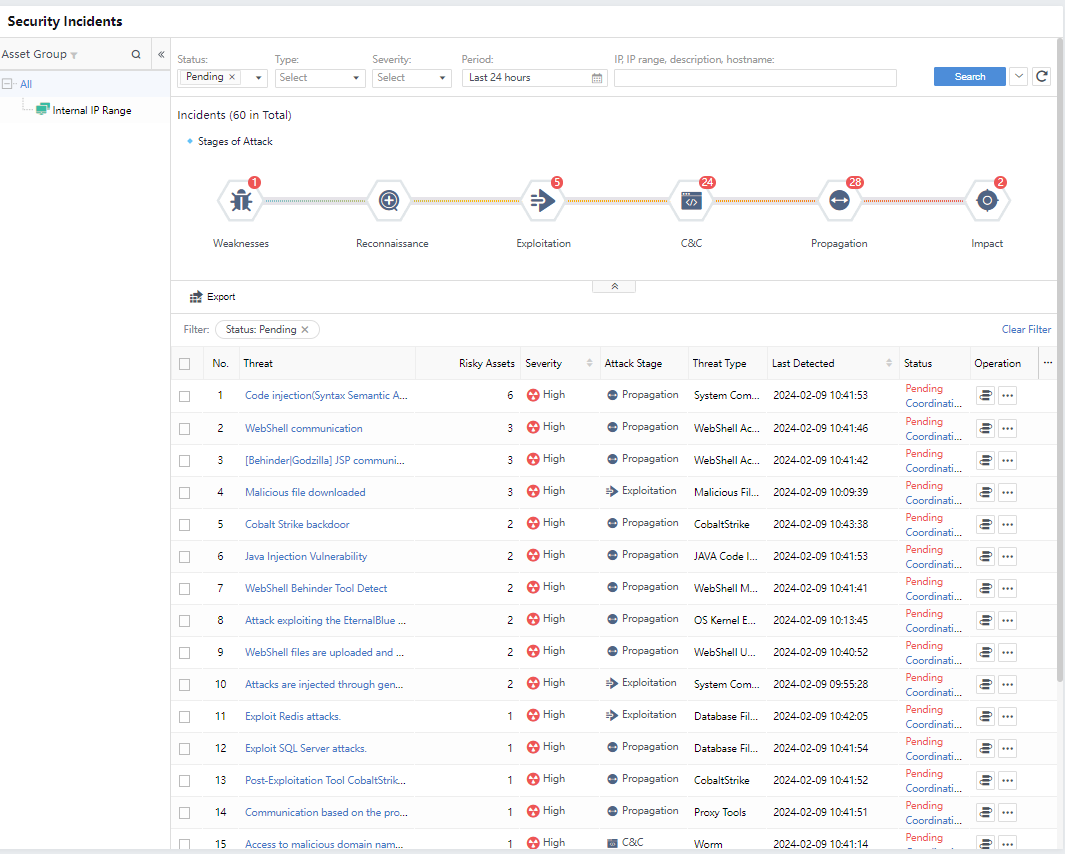
On the Response > Security Threats > Security Incidents page, you can see the distribution of Security Incidents, which can be filtered according to your needs, as shown in the following figure.
Status: All, Pending, Suspended, Fixing, Fixed.
Type: All, Server, Host, IoT
Severity: Categorized into All, High, Medium, and Low, based on the comprehensive assessment of the impact scope and depth of Security Incidents.
Attack Stage:Stage matching of Security Incidents based on industry-standard attack chain models, classified as All, Weaknesses, Reconnaissance, Exploitation, C&C, Propagation, and Impact.
Threat Type:It shows the typf
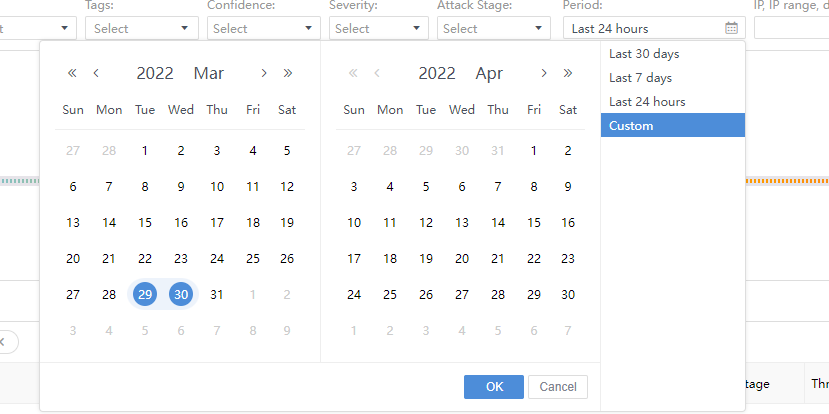
Period:Filter Security Incidents based on period. You can choose Last 30 days, Last 7 days, or Last 24 hours. Alternatively, choose Custom to filter the Security Incidents beyond 30 days, as shown in the following figure.
Search: You can search the Security Incidents based on IP, IP range, description, or hostname.
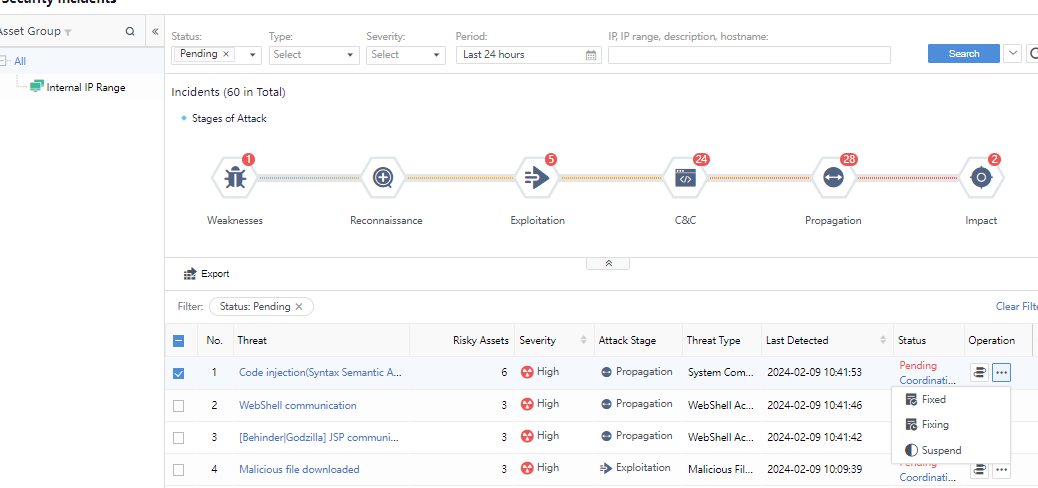
Incidents
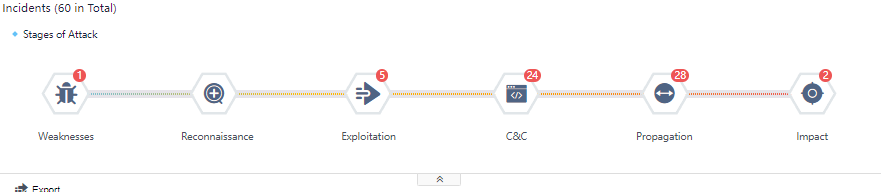
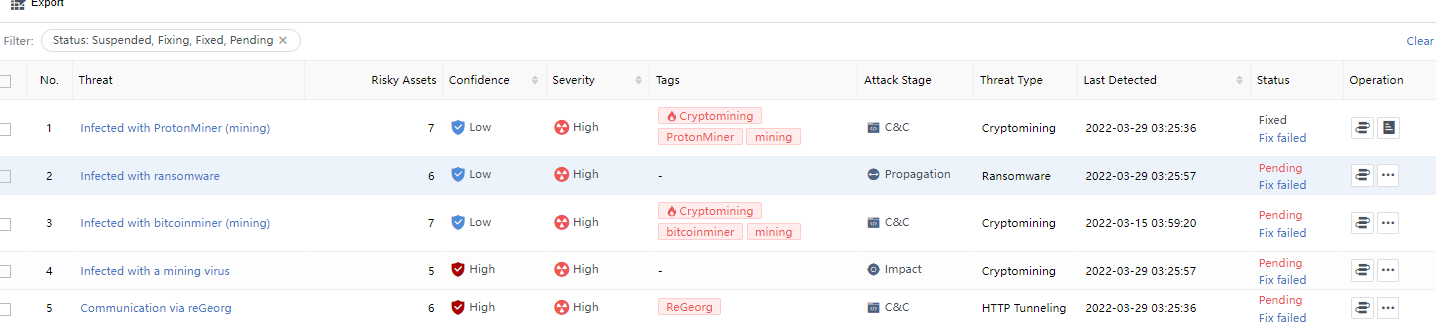
You can see the Incidents statistics in the middle section of the Security Incidents page, divided into several sections according to the incident attributes: Weaknesses, Reconnaissance, Exploitation, C&C, Propagation,and Impact. Each section has specific quantitative statistics. The total number of incidents is the sum of the numbers displayed in the incident attribute categories, as shown in the following figure.
View Incidents
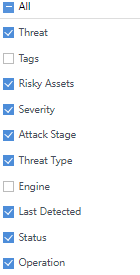
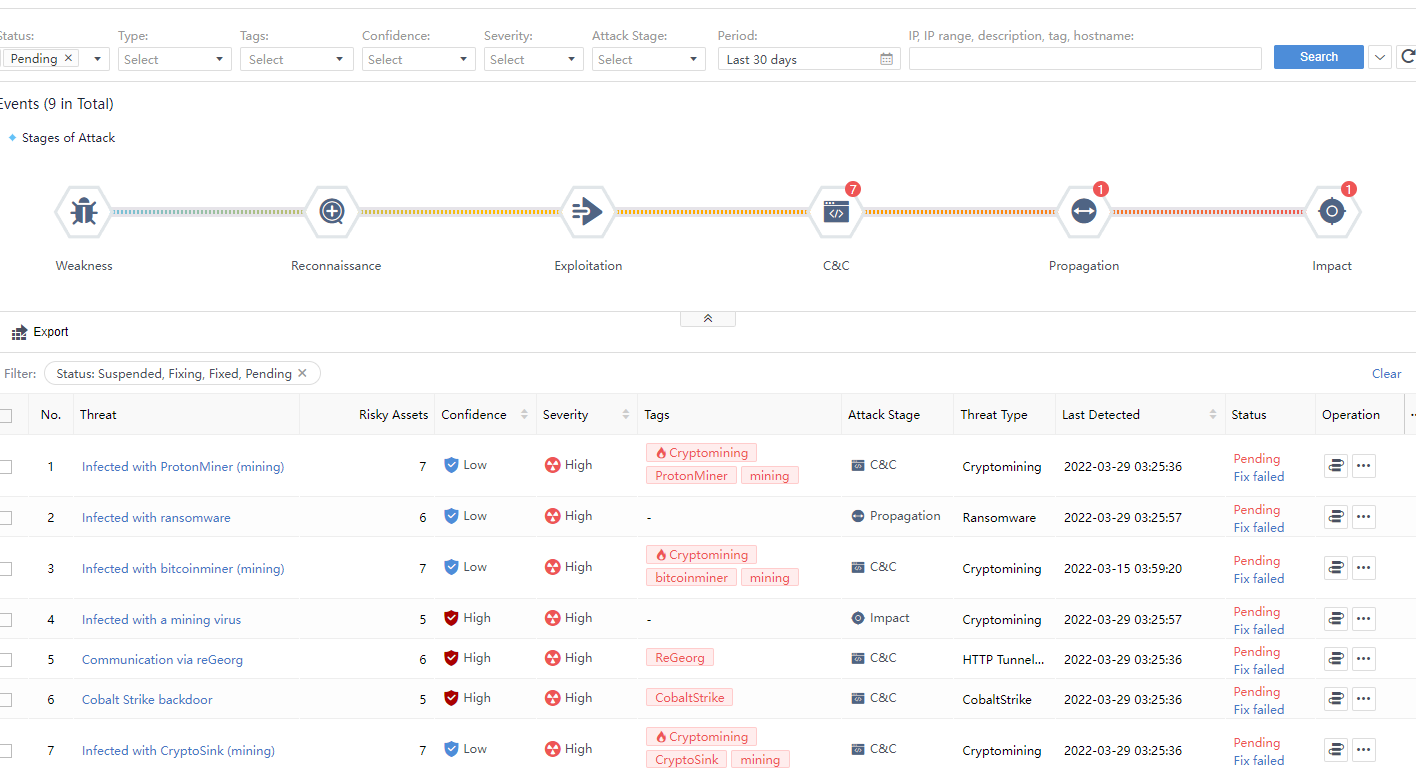
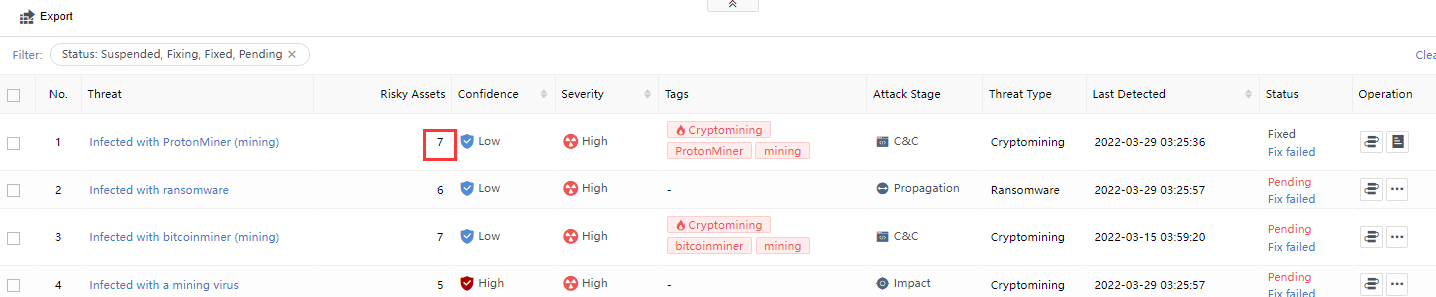
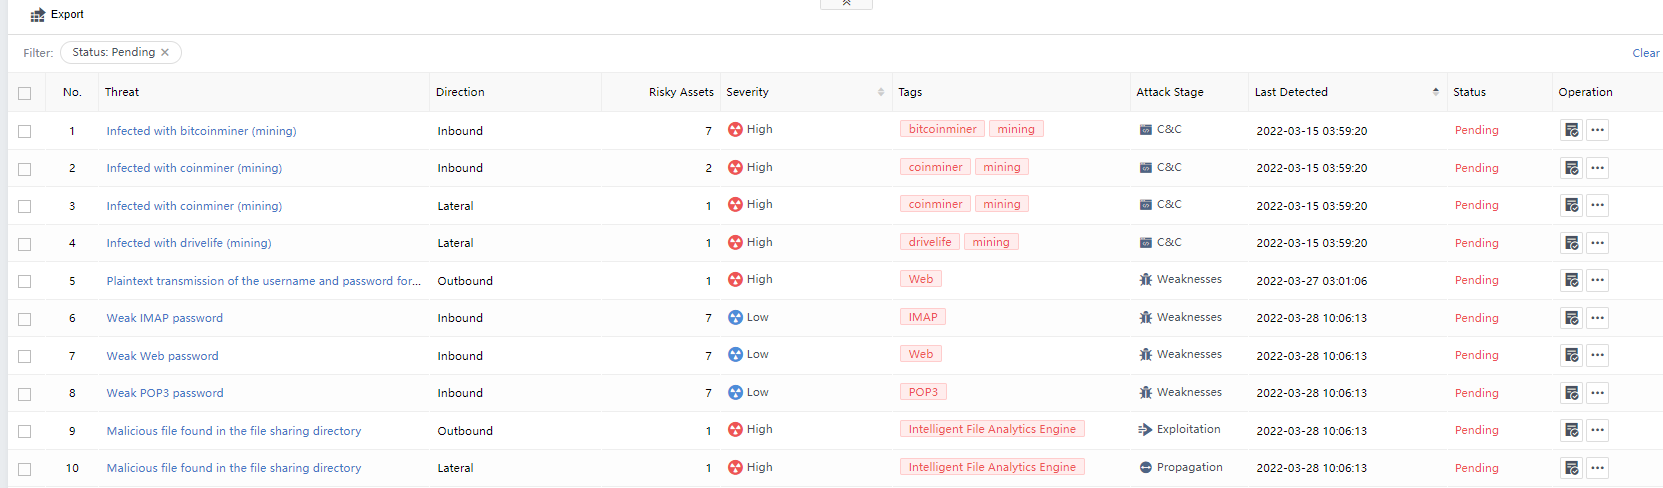
Search according to the above conditions to see a list of specific Security Incidents. The aspects of each Security Incident include Threat, Tags,Risky Assets,Severity,Attack Stage,Threat Type,Engine,Last Detected,Status, and Operation, as shown in the following figure.
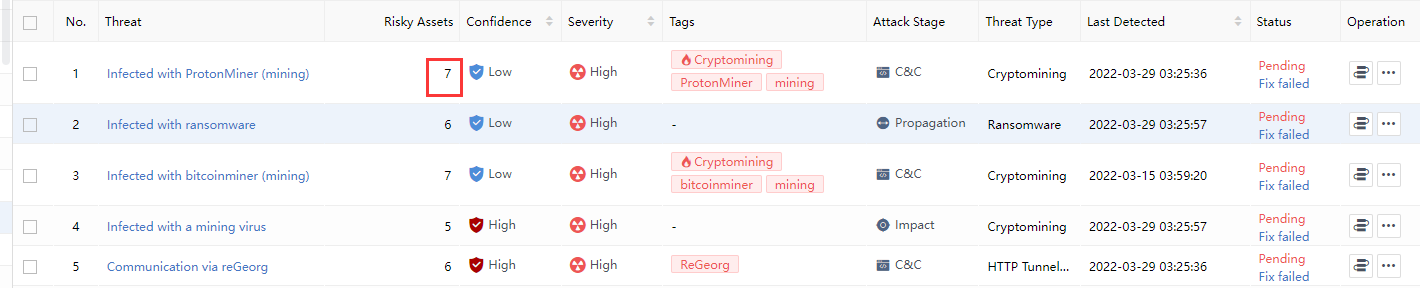
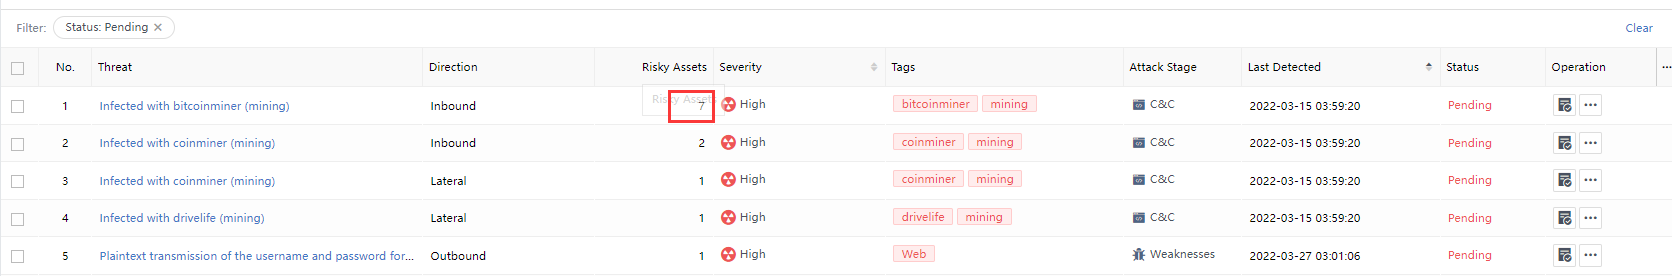
Risky Assets: The number represents the risky assets associated with the Security Incidents. You can click the threat name and select the Risky Assets tab on the Incident Details page to view it, as shown in the following figure.
Last Detected: It represents the time of the most recent entry in the alert log associated with all risky assets within the change event, as shown in the following figure.
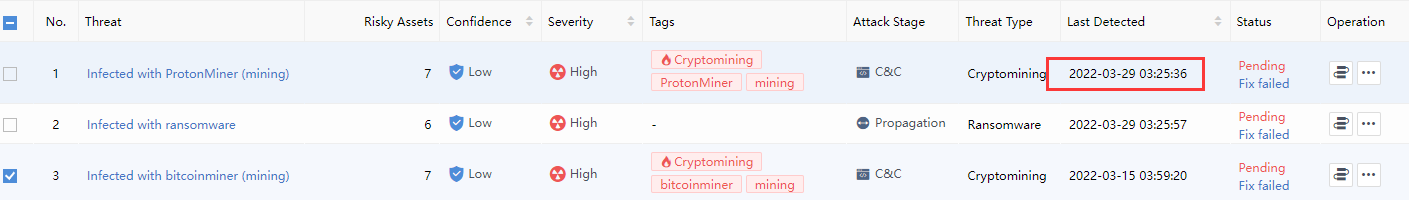
Status: Classified as Pending, Suspended, Fixing, and Fixed. It represents the safety status of a risky asset. If there are multiple risky assets and all of the risky assets are fixed, it will display Fixed. If there are unfixed risky assets, it will display Pending, as shown in the following figure.
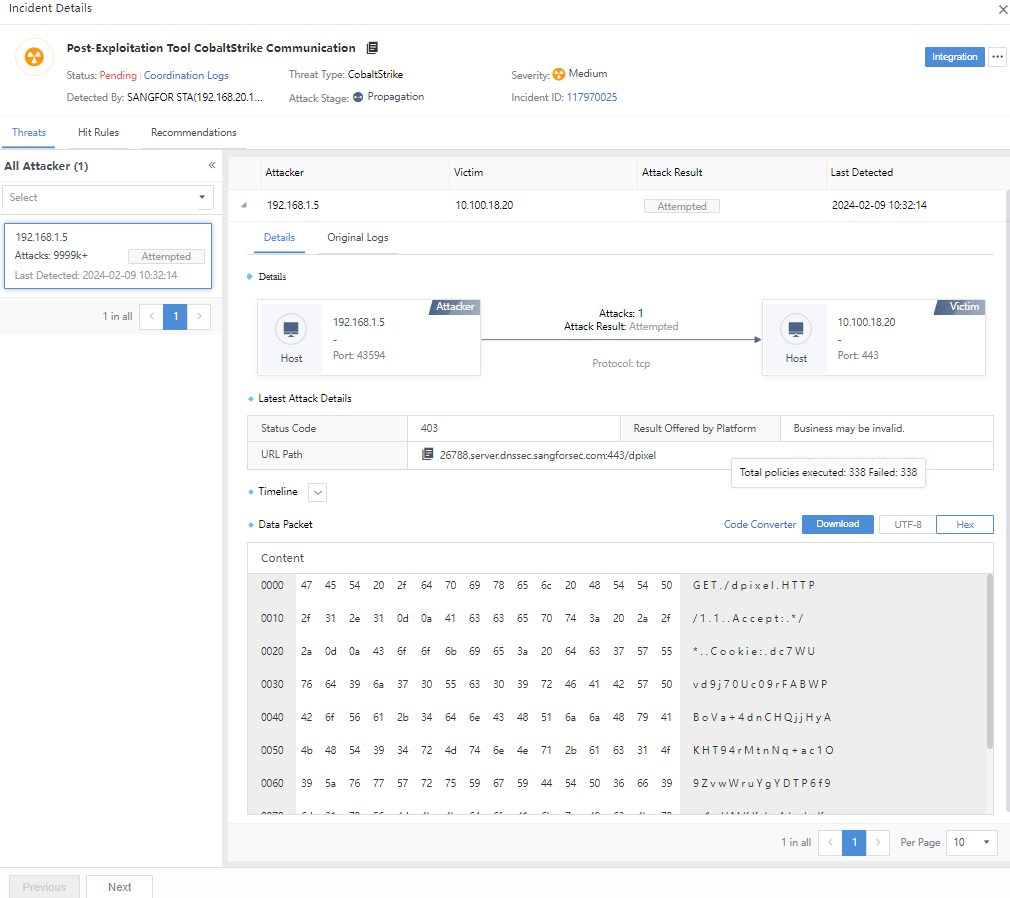
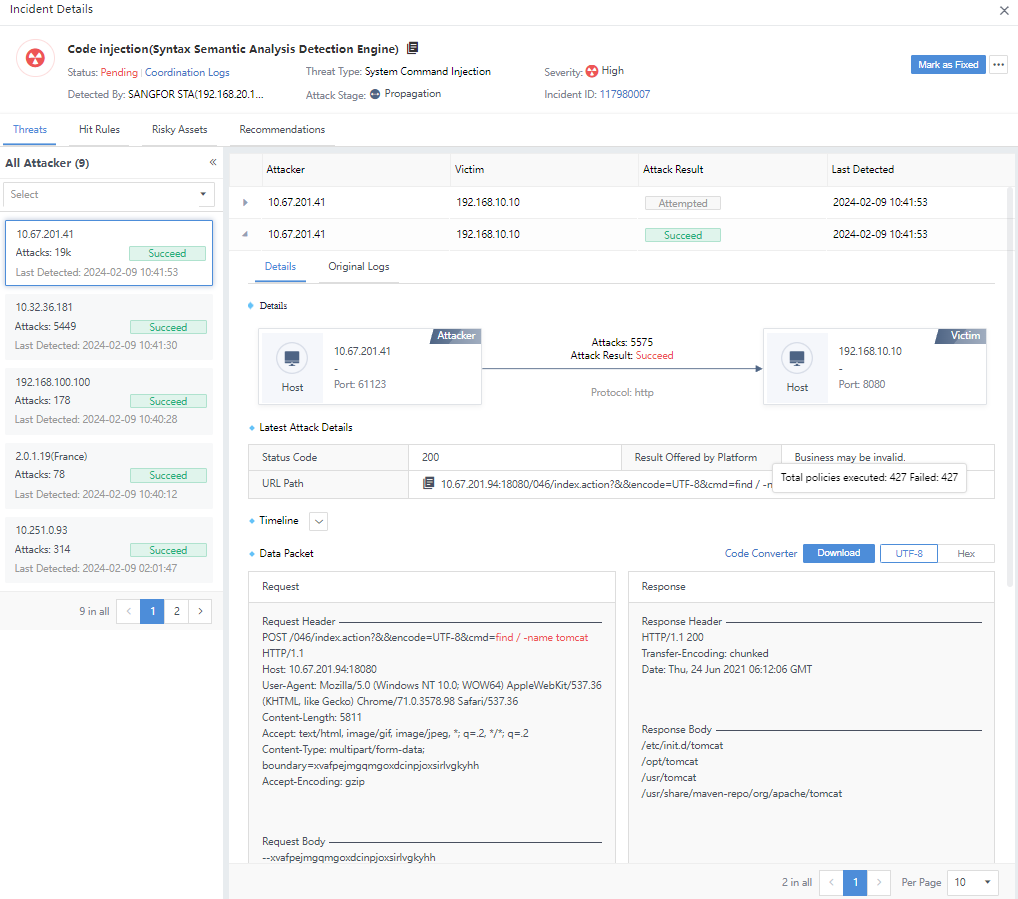
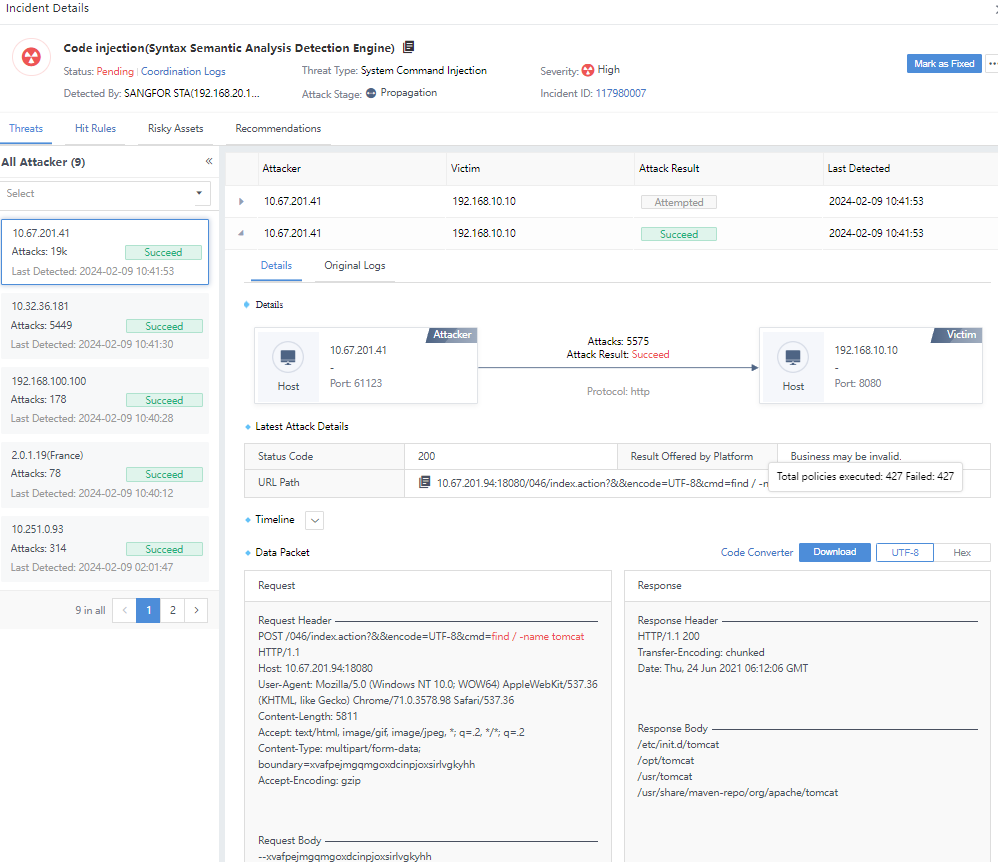
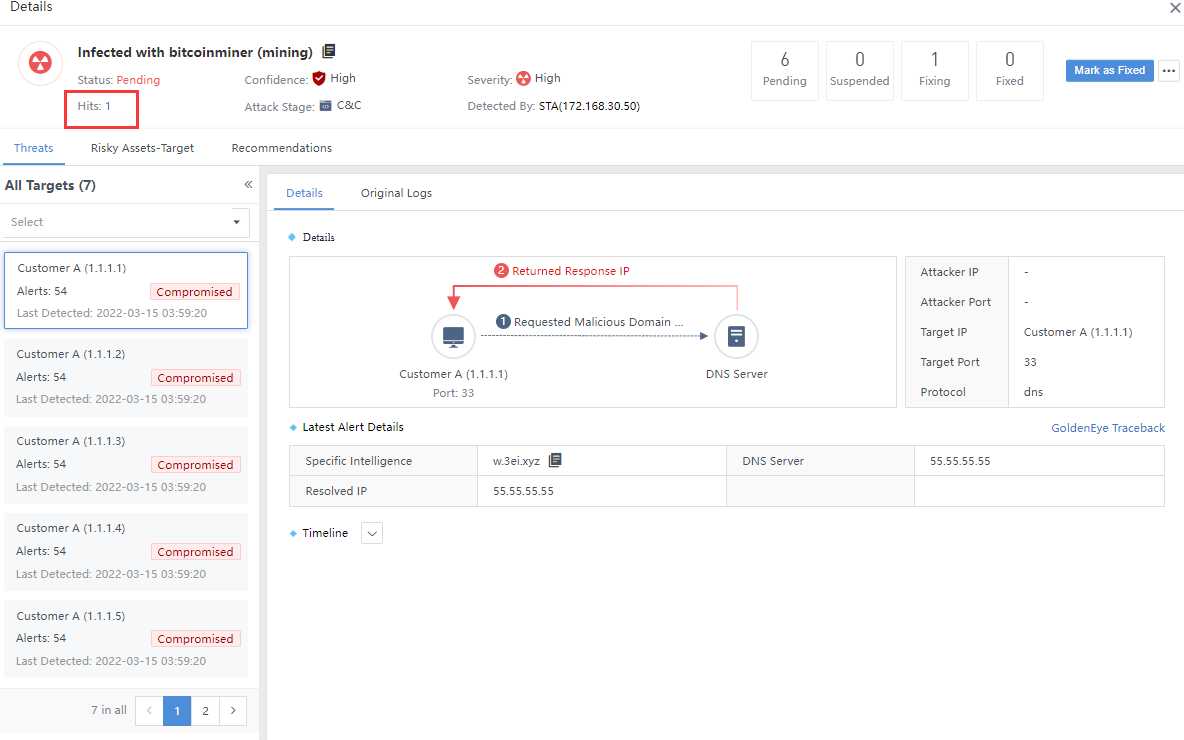
Incident Details
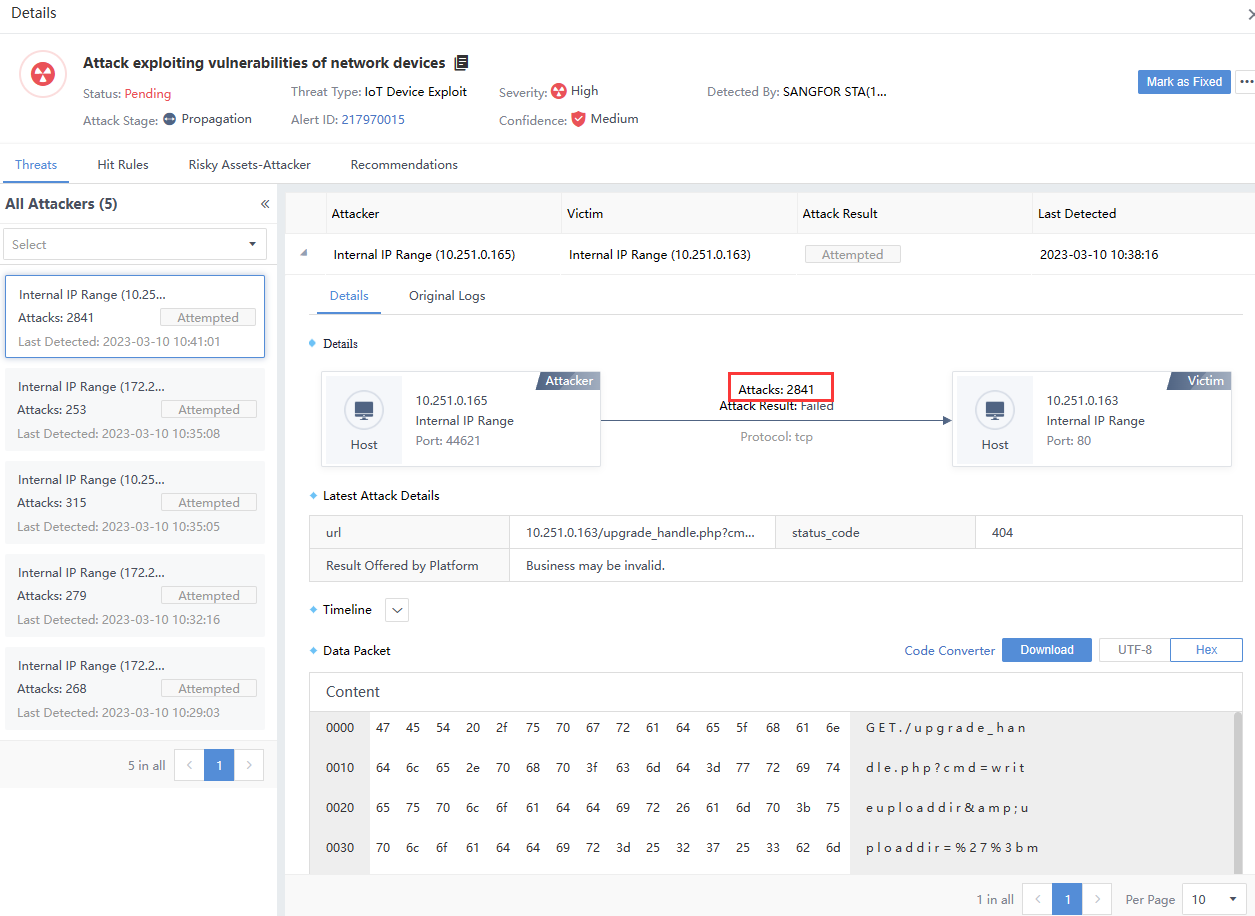
Click the security incident and enter the Incident Details page. The number on the All Targets represents the number of attackers associated with the Security Incidents, as shown in the following figure.
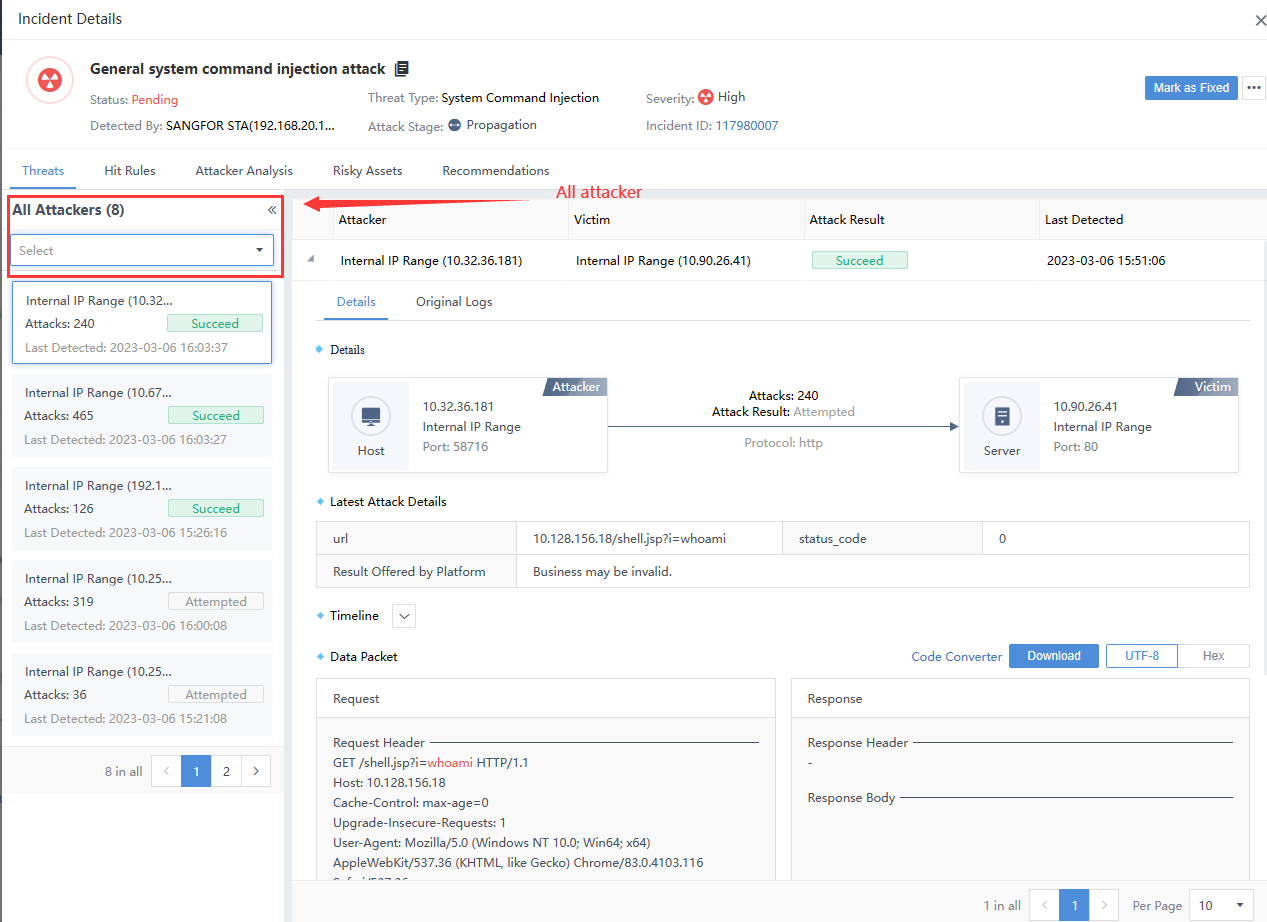
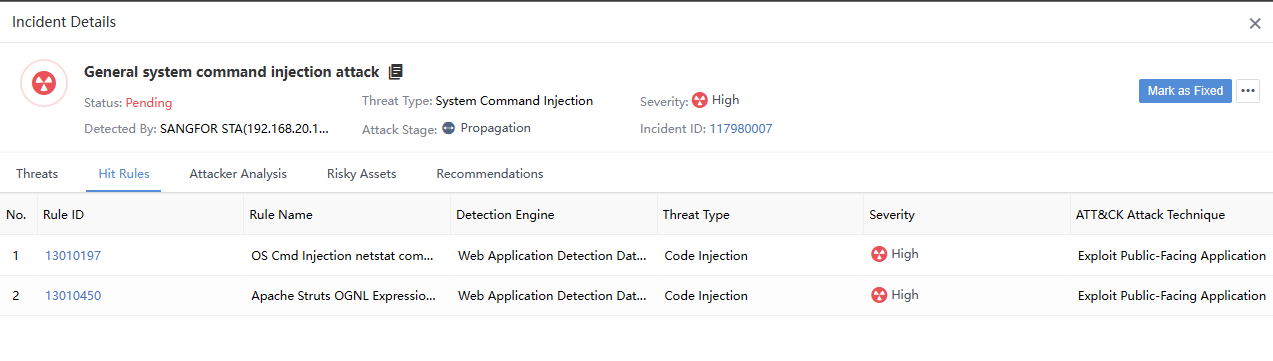
The total number of attackers and the number of risky assets in the Hit Rules are two different things, not necessarily equal, as shown in the following figure.
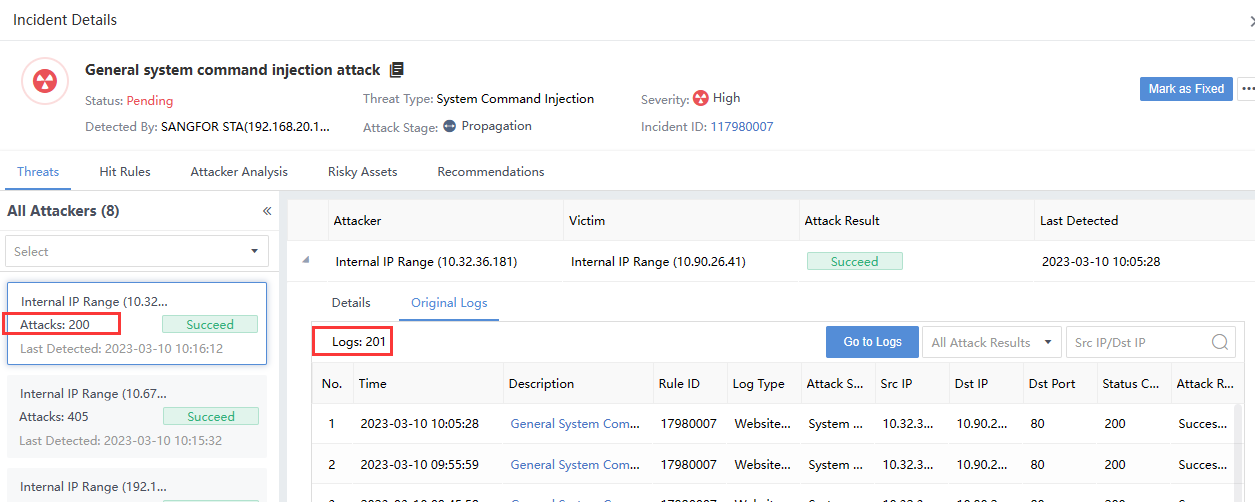
The number of Attacks on the Incident Details page represents the total number of Original Logs hit by the corresponding IP as an attack launched by an attacker. It is consistent with the number of alerts in the Details tab.
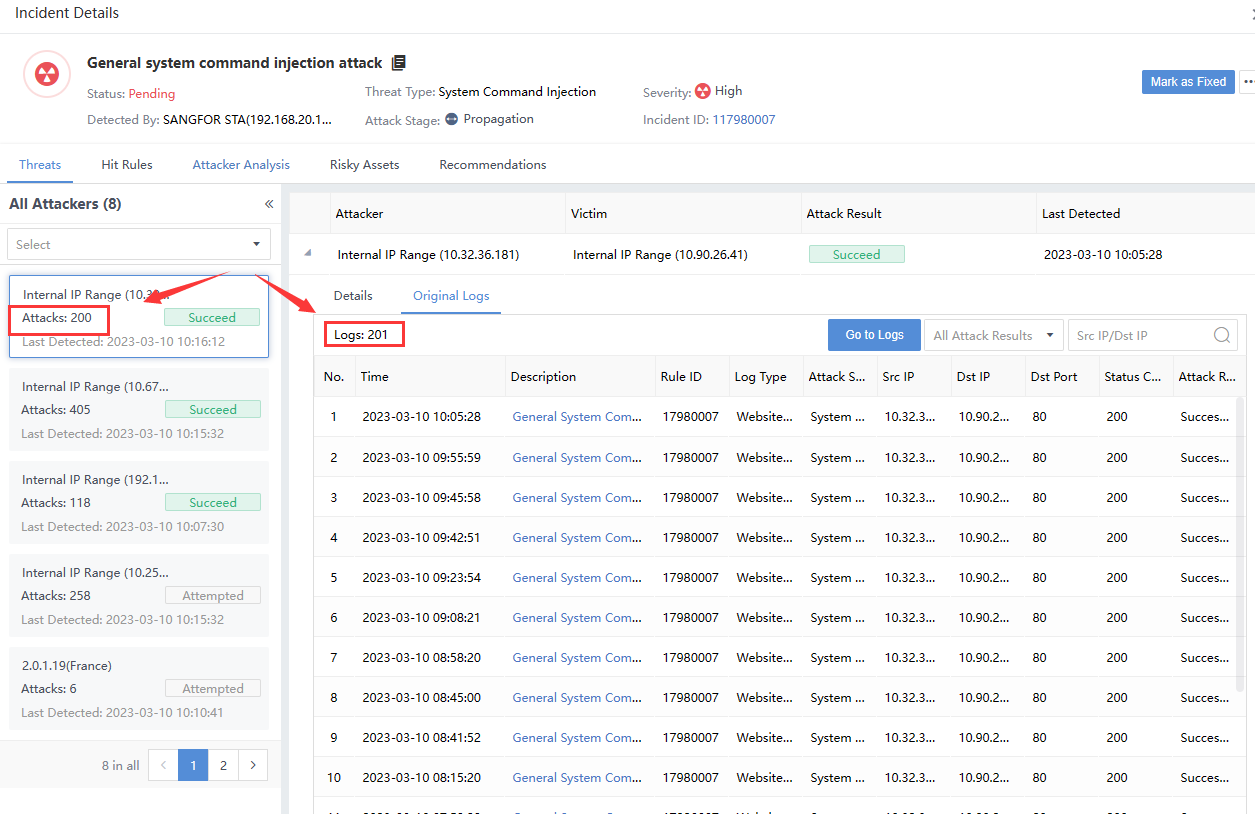
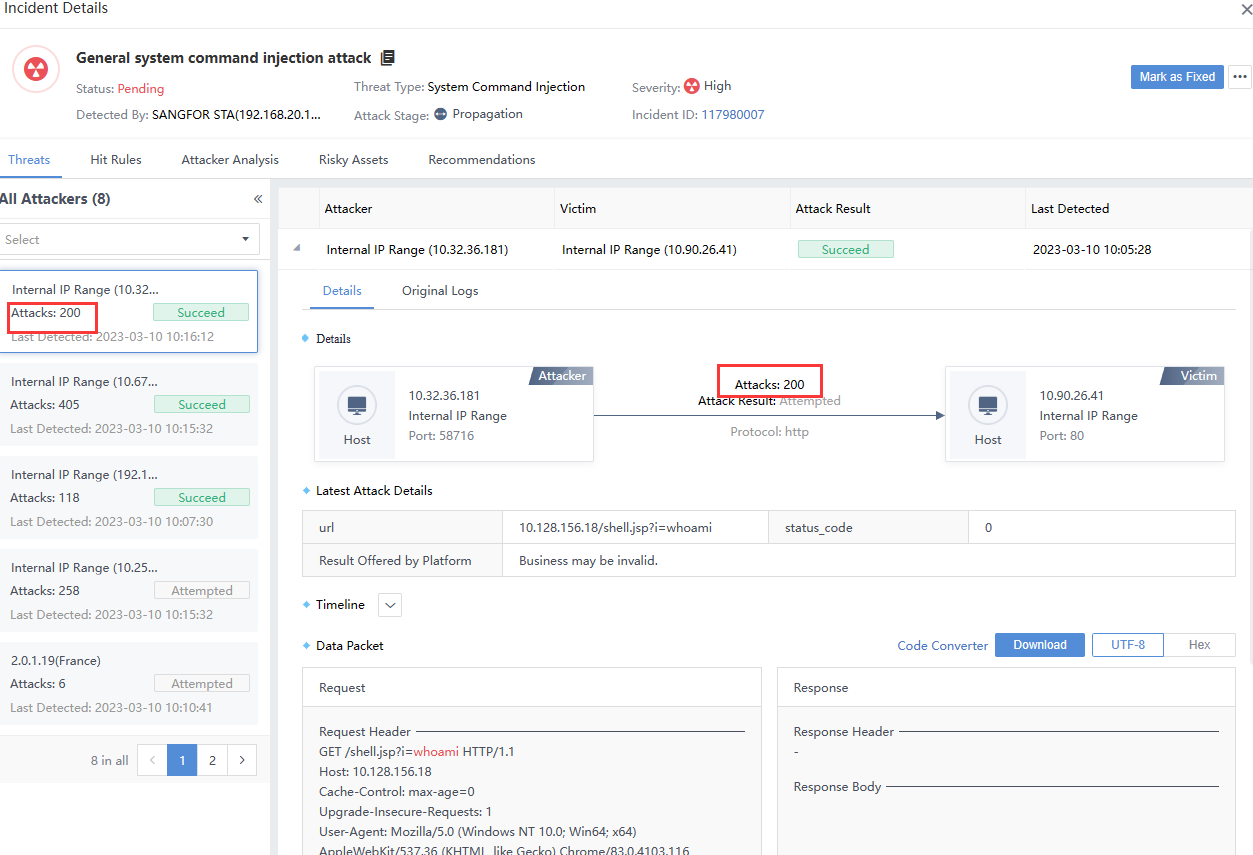
Note: There are multiple victims when the number of attacks on the left pane is inconsistent with the original logs list on the right. The sum of the number of logs hit by multiple victims on the right is equal to the number of attacks on the left, as shown in the following figure.
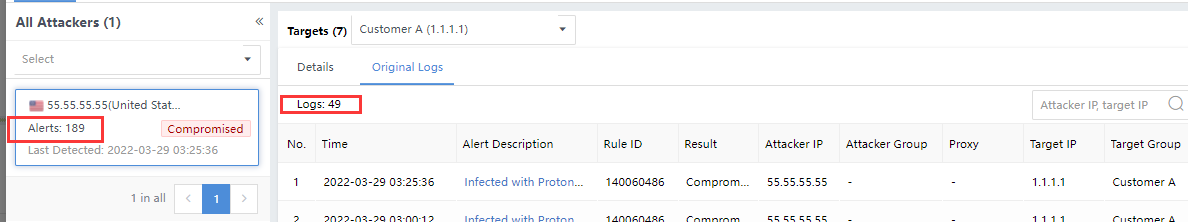
Risky Assets represents the number of risky assets associated with the Security Incidents. You can click the Security Incidents and select the Threats tab on the Incident Details page to view it, as shown in the following figure.
The number of attacks consistent with the number of victims on the Threat page equals the corresponding number of original logs in the risk assets list, as shown in the following figure.
Incident Operation
Security Incidents can be handled manually and by integration. The status after manual response includes Fixed, Fixing, Suspended, and Pending. The correlated response is based on scripts or actions.
Manual Response
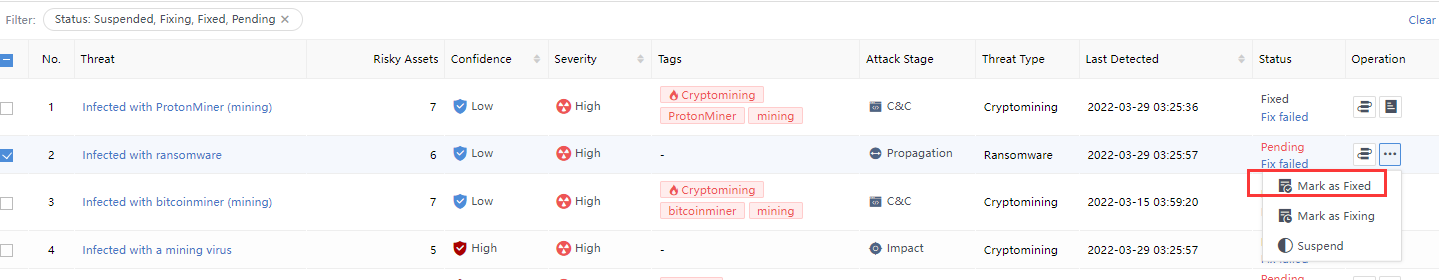
On the Response > Security Threats > Security Incidents page, select a specific security incident and click the icon under the Operation column, as shown in the following figure.
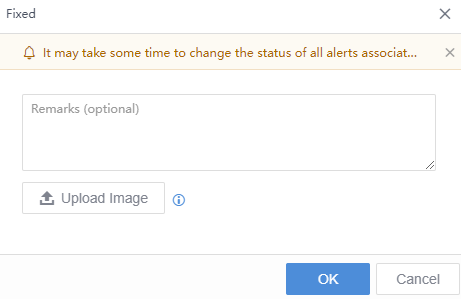
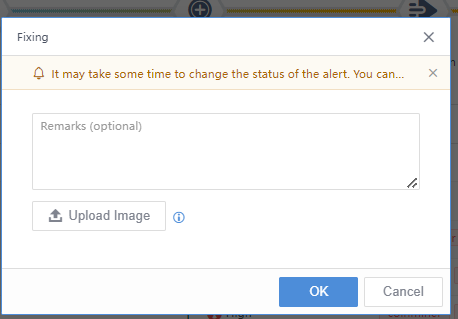
Click Fixed, fill in remarks in the pop-up box, and upload pictures as proof if necessary. The status will change to Fixed, as shown in the following figure.
You can enter the risky assets of Security Incidents and respond manually, as shown in the following figure.
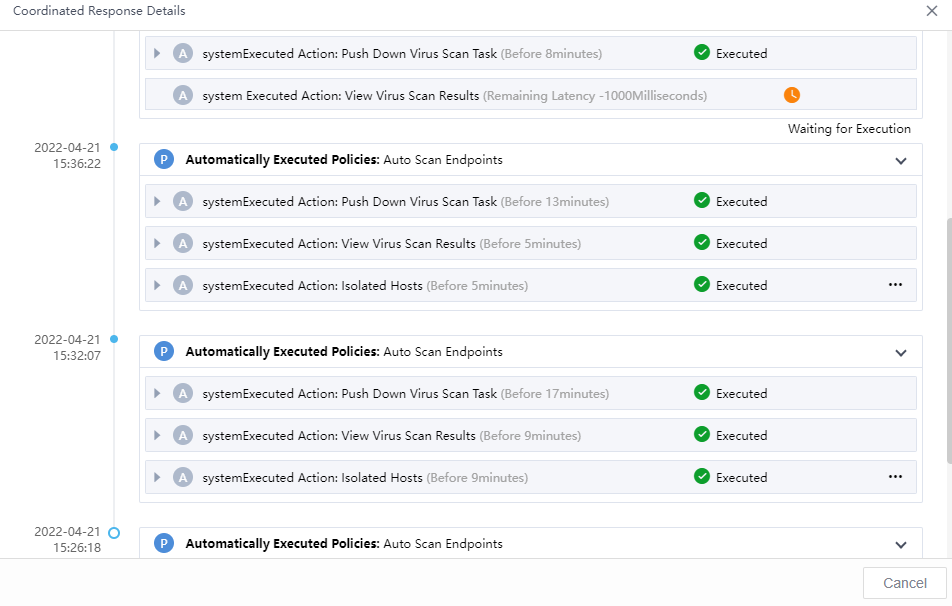
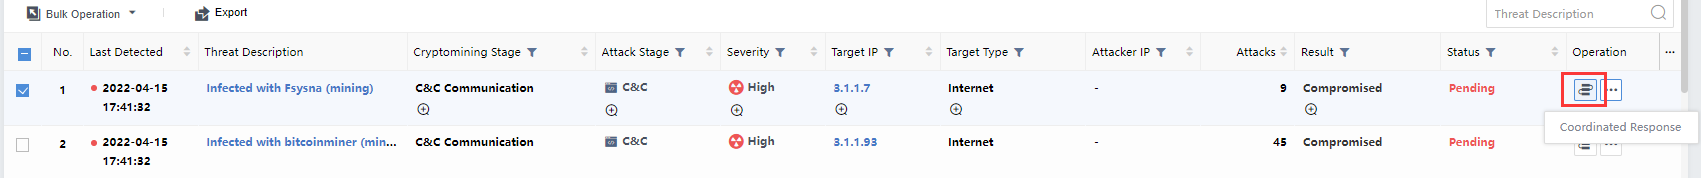
Coordinated Response
On the Response > Security Threats > Security Incidents page, click the icon to bring up the integration action dialog. You can respond based on the policies’ execution or the execution action. The matching and the enabled policies will be displayed in a pop-up box when you follow the policies, as shown in the following figure.

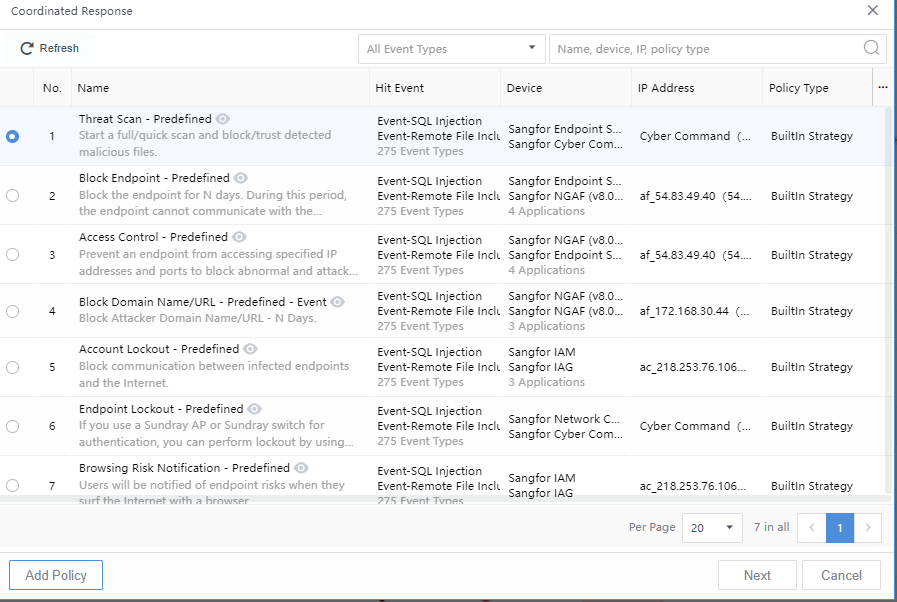
Select the policy and execute it. The pop-up box displays the execution status, as shown in the following figure.

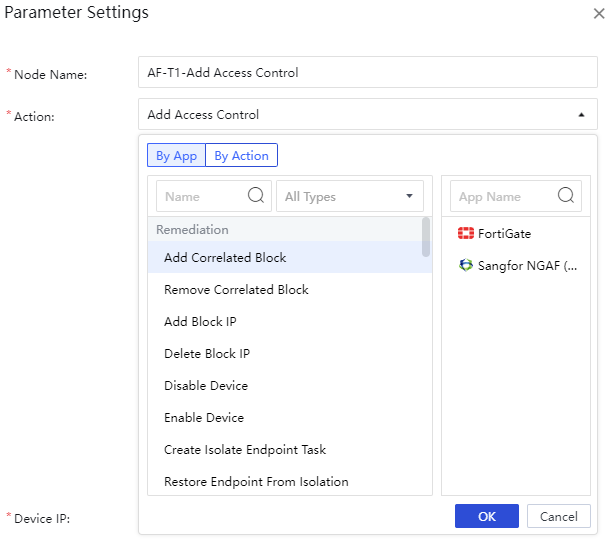
You can also perform actions. Select from the Select Action option drop-down list, where you can select by filter By App or By Action, and click OK.
Select the corresponding instance resource and execute it. You can see the task delivery status, as shown in the following figure.

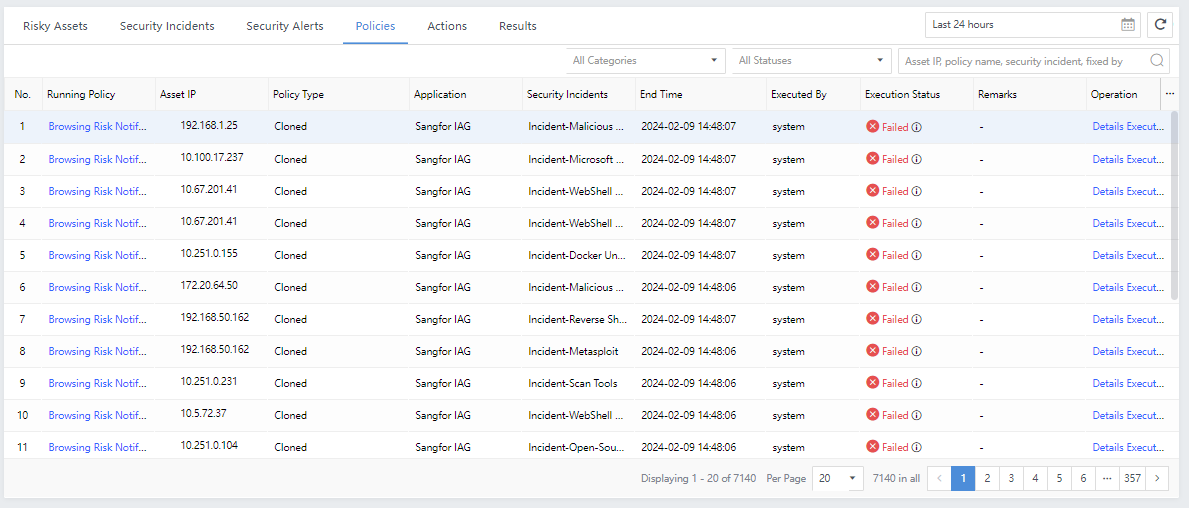
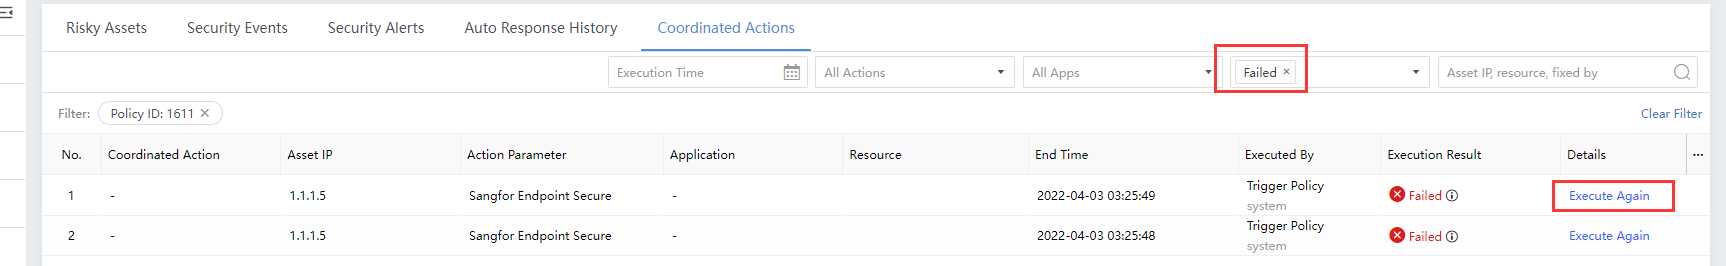
On the Response > Response History>Policy page, you can check the Execution Status, Start Time, End Time, Application, Operation, etc. You can also click Execute Again for the failed response, as shown in the figure below.
Security Alerts
Security Alerts Filtering
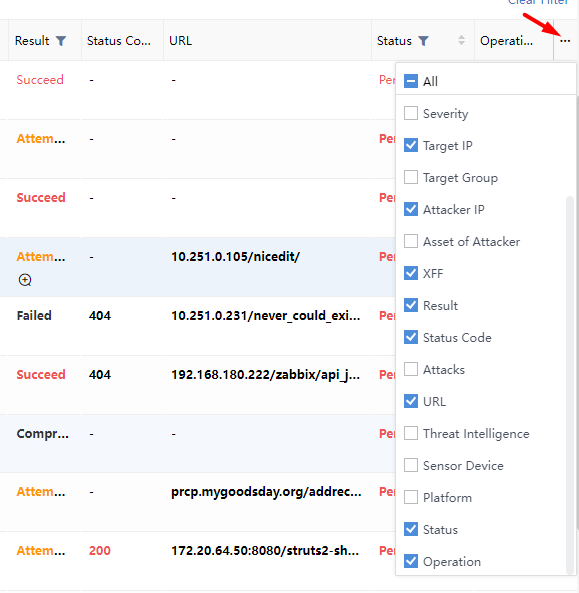
On the Response > Security Threats > Security Alerts page, you can see the distribution of security alerts. You can filter the security alerts by Status, Type,Groups,Direction,Confidence,Severity, Attack Stage,Result, Threat Type, etc., as shown in the following figure.
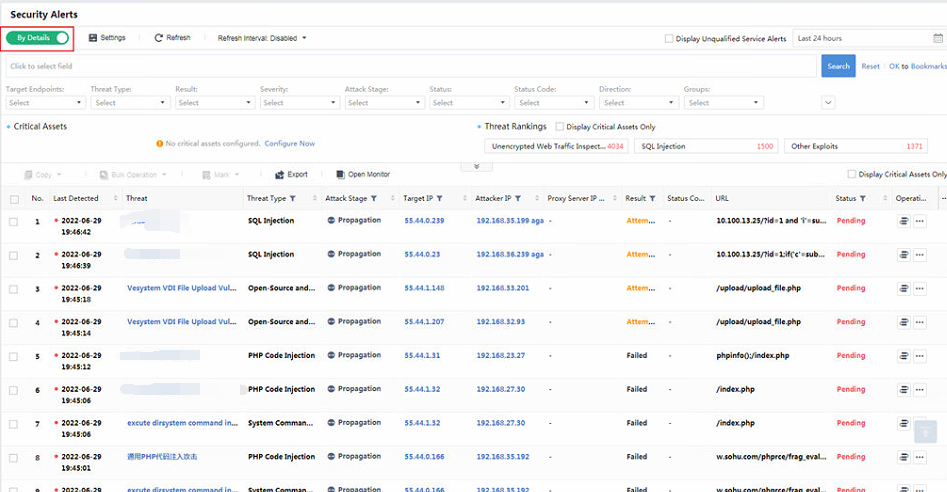
Status: All, Pending, Suspended, Fixing, Fixed.
Target Endpoints: All, Server, Host.
Groups: A dropdown list for you to select different asset groups.
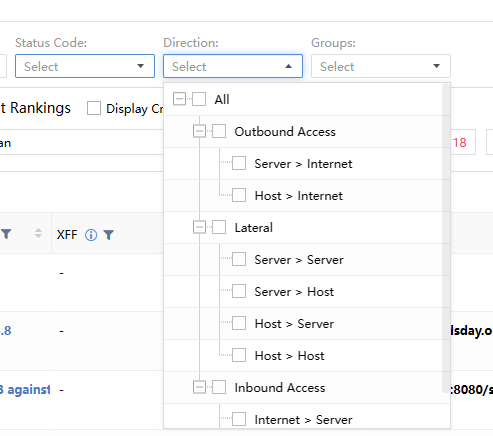
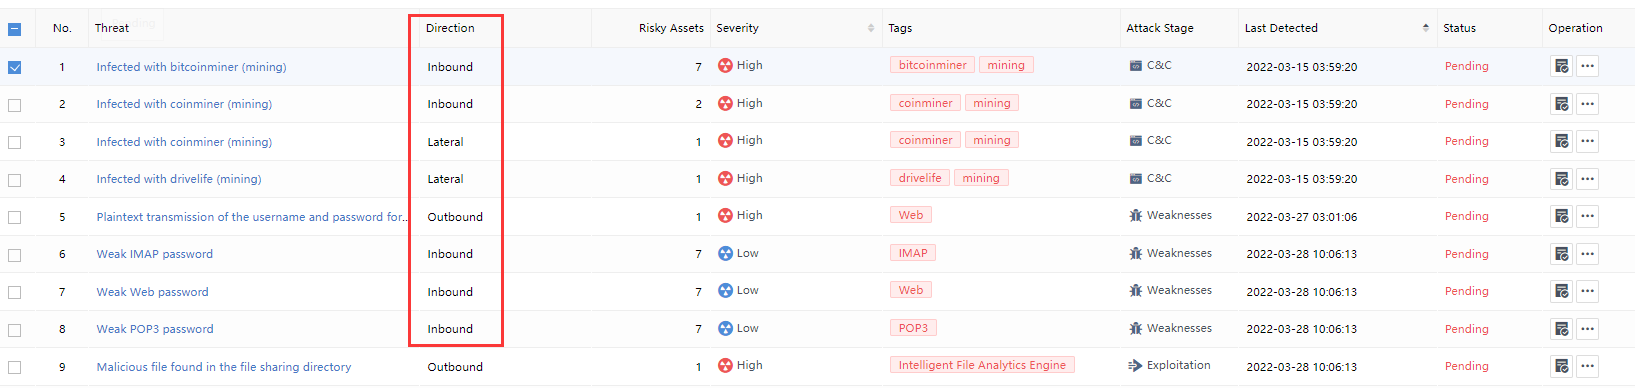
Direction: Represent the direction of the Security Alerts traffic, including All, Outbound Access, Lateral, and Inbound Access, etc., as shown in the following figure.
Severity:According to the comprehensive assessment of the impact scope and depth of Security Incidents, categorized into All, High, Medium, and Low.
Attack Stage:Stage matching of Security Incidents based on industry-standard attack chain models, categorized into All, Weaknesses, Reconnaissance, Exploitation, C&C, Propagation, and Impact.
Threat Type:The type of the threat.
Period: Filter Security Incidents based on period. You can choose Last 30 days, Last 14 days, Last 7 days, or Last 24 hours. Alternatively, choose Custom to filter the Security Incidents beyond 30 days, as shown in the following figure.
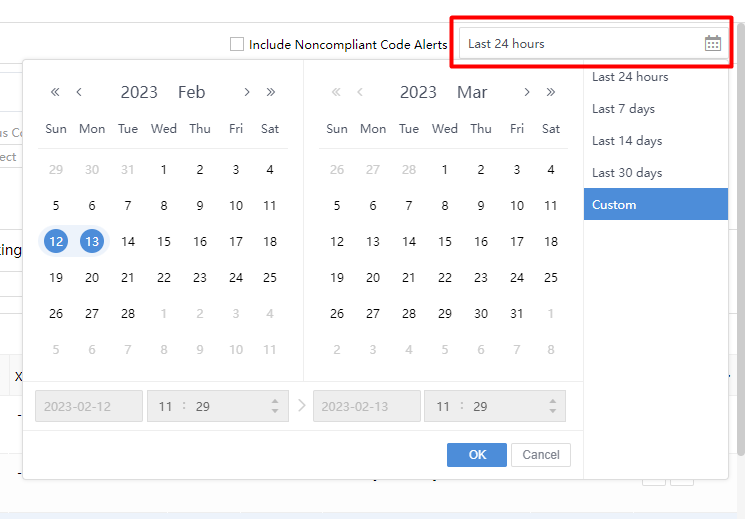
- Search:You can search the Security Incidents based on IP, IP segment, description, tag, or hostname.
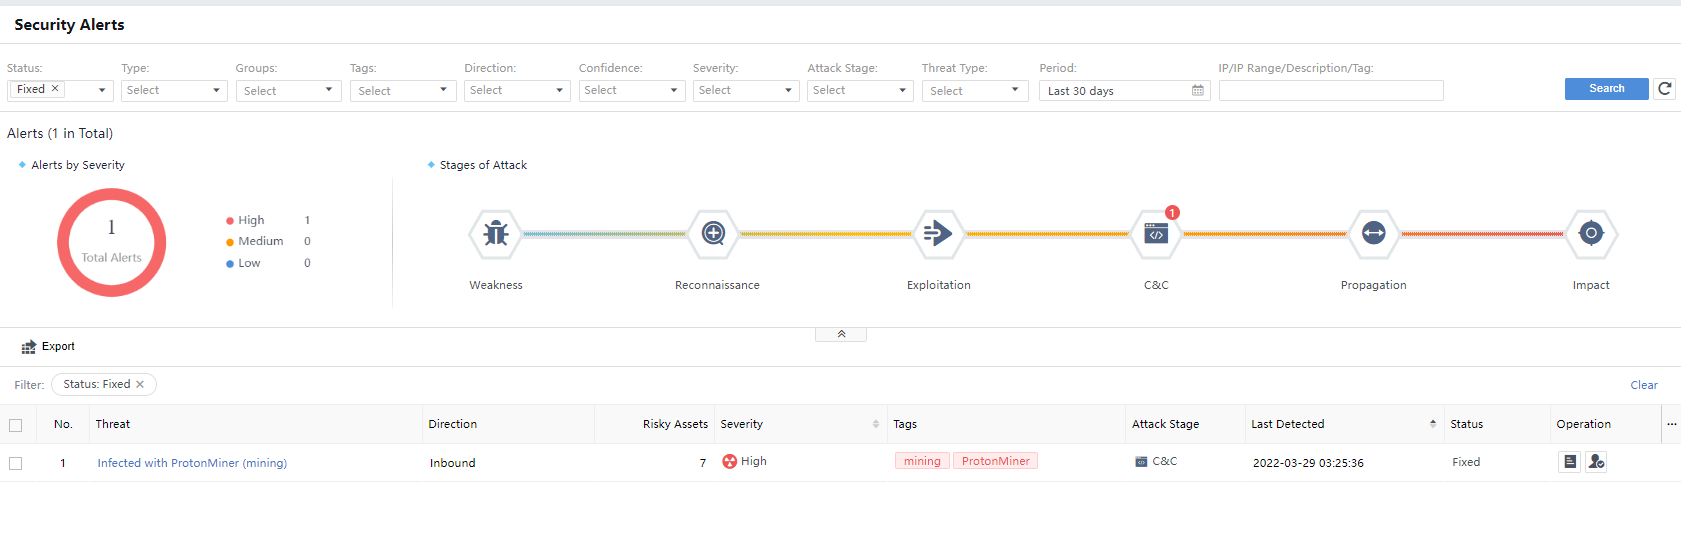
Severity:You can see the Alerts statistics in the middle section of the Security Alerts page. There are three alert levels: High, Medium, and Low. Each section has specific quantitative statistics, as shown in the following figure.
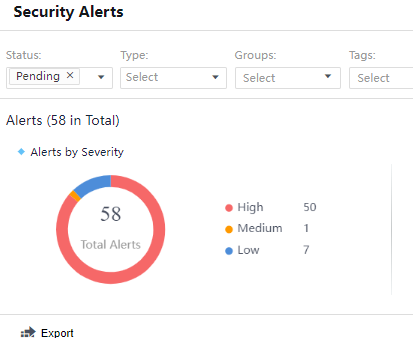
Security Incidents are quantified and matched according to the attack stage. As shown in the following figure, the total number of alerts is consistent with the number of incident attribute classifications.
View Alerts
You can see the specific Security Alert list according to the above conditions. The aspects of each Security incident, including Threat, Severity, Attack Stage, Threat Type, Status, Operation, etc.,are shown in the following figure.
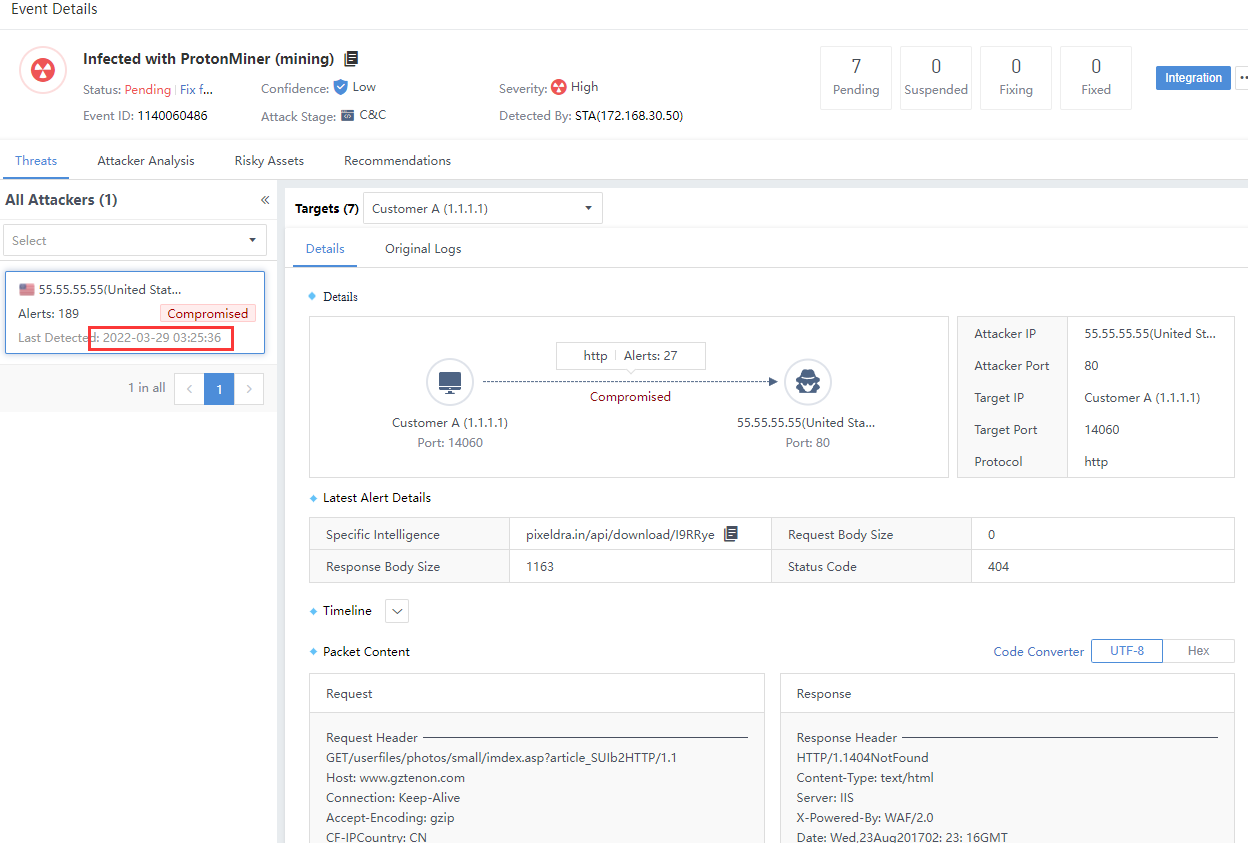
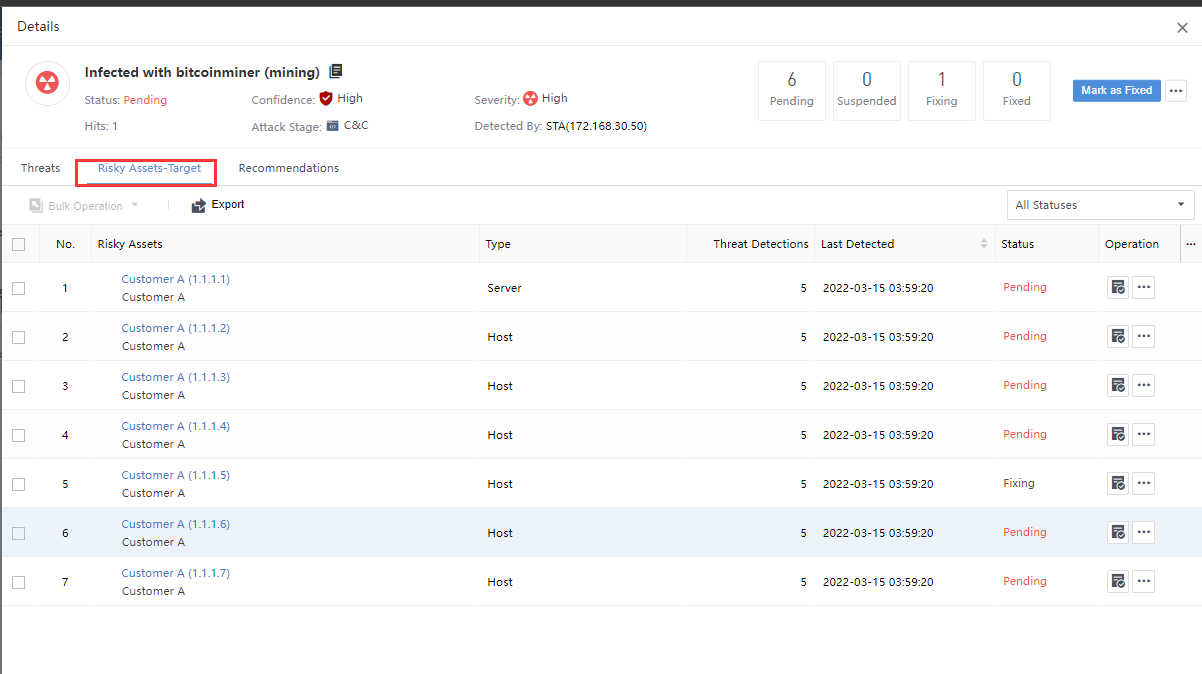
The number of risky assets: Represent the number of risky assets associated with the Security Alerts. You can click the Security Incidents and select the Risky Assets > Target tab on the alert details page to view it, as shown in the following figure.
Direction: Represent the direction of the Security Alerts traffic, including undirected (multiple locally generated alerts), inbound (such as externally initiated attacks), lateral (such as horizontal), and outbound (such as malicious, accidental connection), etc., as shown in the following figure.
Status:Pending, Suspended, Fixing, and Fixed.
Last detected:Represent the time of the latest alert log associated with all risky assets within the alert, as shown in the following figure.
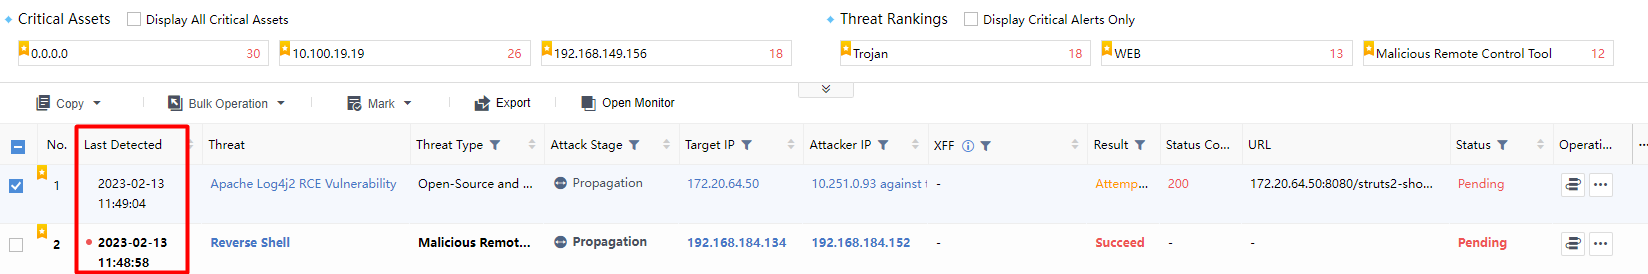
Status: Represent the response status of a risky asset. If there are multiple risky assets and all of them are fixed, it will display Fixed. If there are no fixed risky assets, it will display Pending, as shown in the figure below.
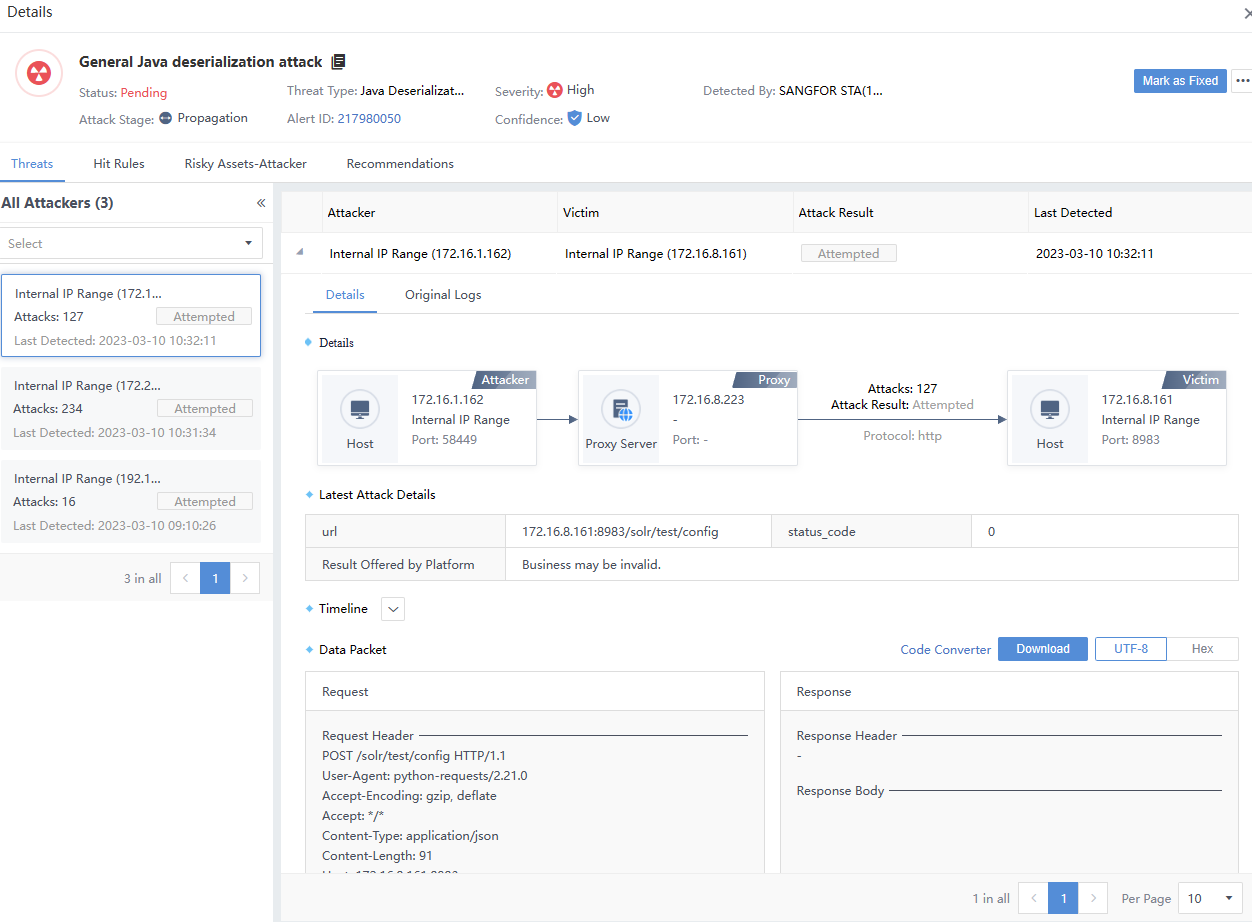
Details
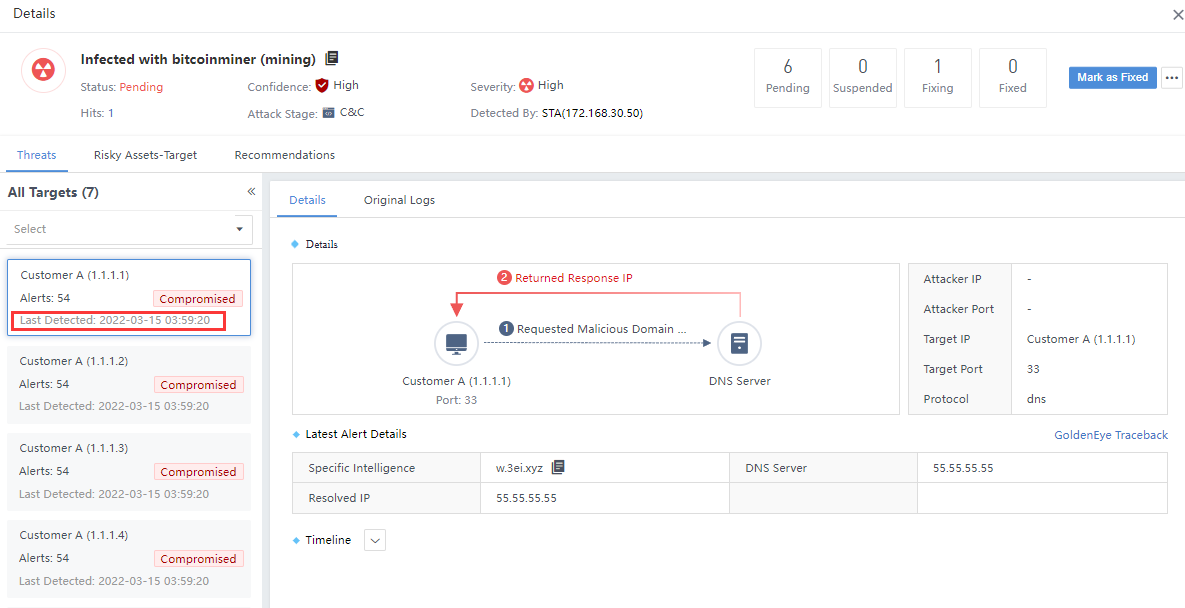
Click a specific threat to enter the Details page. You can view the number of attacks as shown in the following figure.
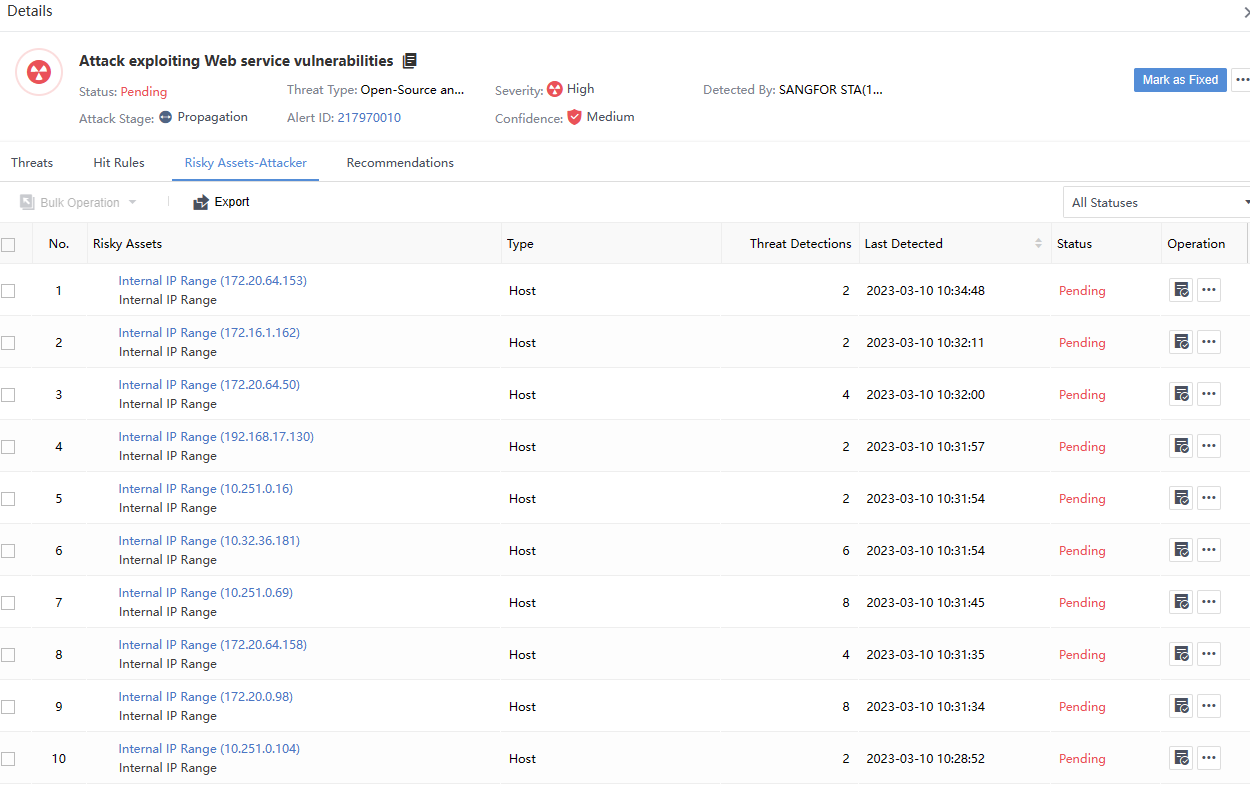
Risky Assets-Attacker represents the number of risky assets associated with Security Incidents. You can view it by selecting the Risky Assets–Attacker tab on the alert details page, as shown in the following figure.
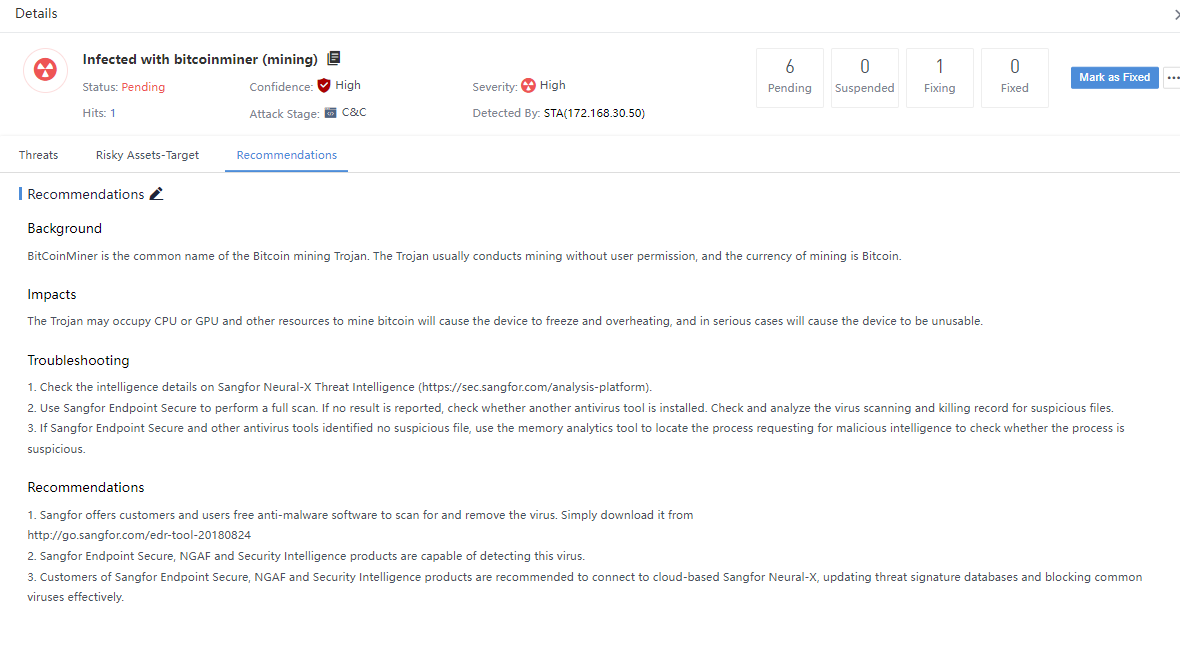
The Recommendations page shows a macro-guidance statement for responding to this type of Security Incident according to the industry’s best practices, as shown in the figure below.
Manual Response
Method One: Direct Response
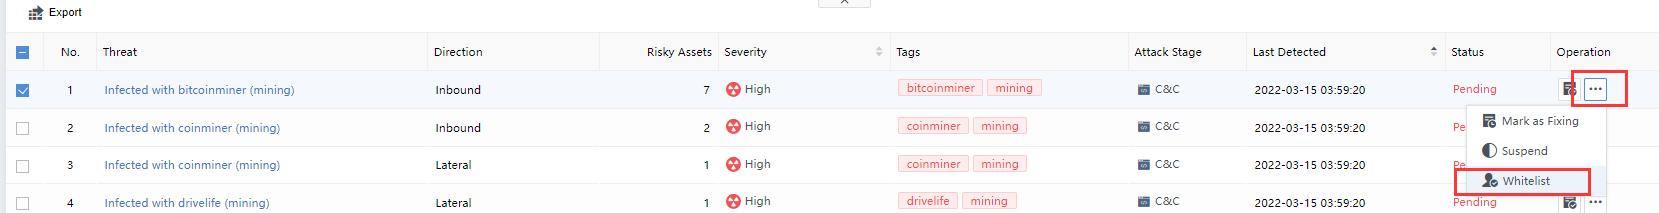
Select a specific threat on the Security Alerts page, click the icon under the Operation column,and choose Fixed, Fixing, Suspend, or Whitelist as required, as shown in the following figure.
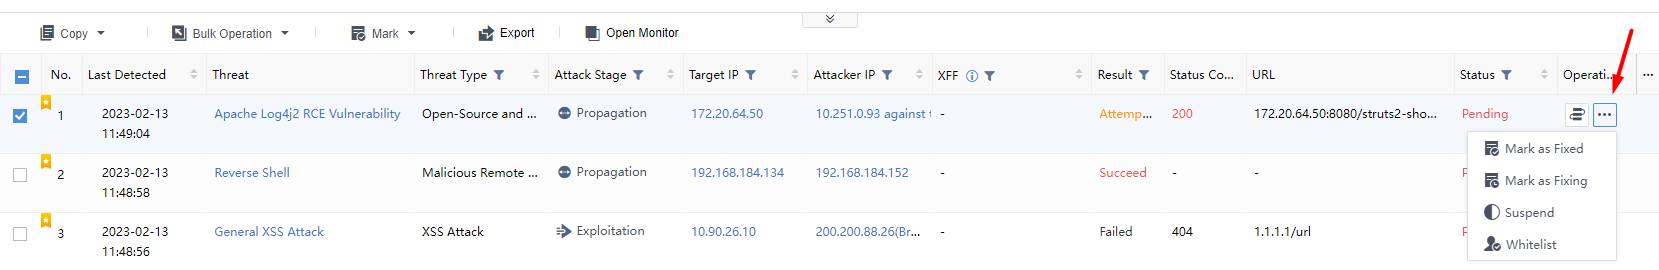
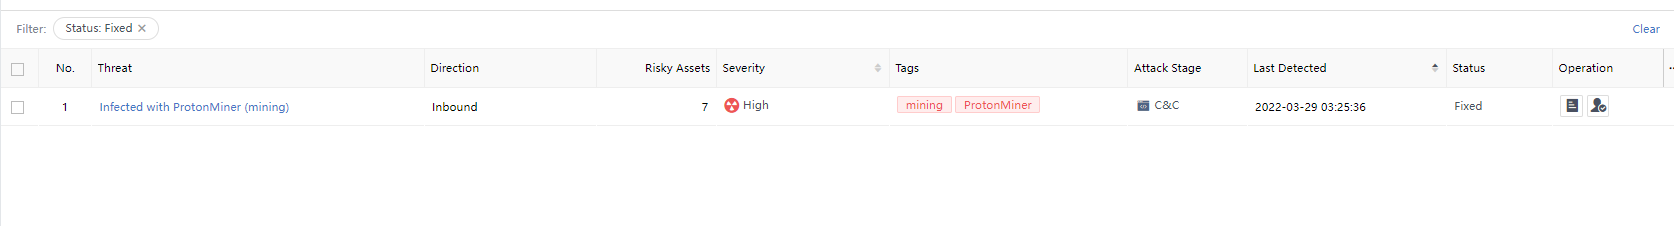
The page is updated after the status changes, as shown in the image below.
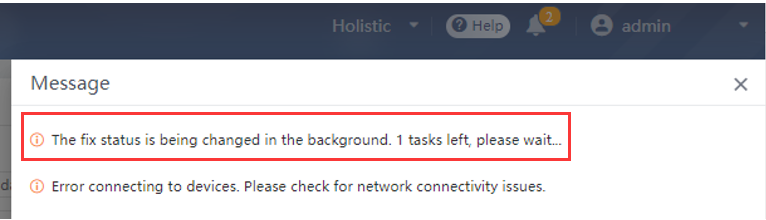
Note: When issuing the response action, the small bell in the upper right corner of the page will prompt the task progress to ensure the normal execution of the task, as shown in the following figure.
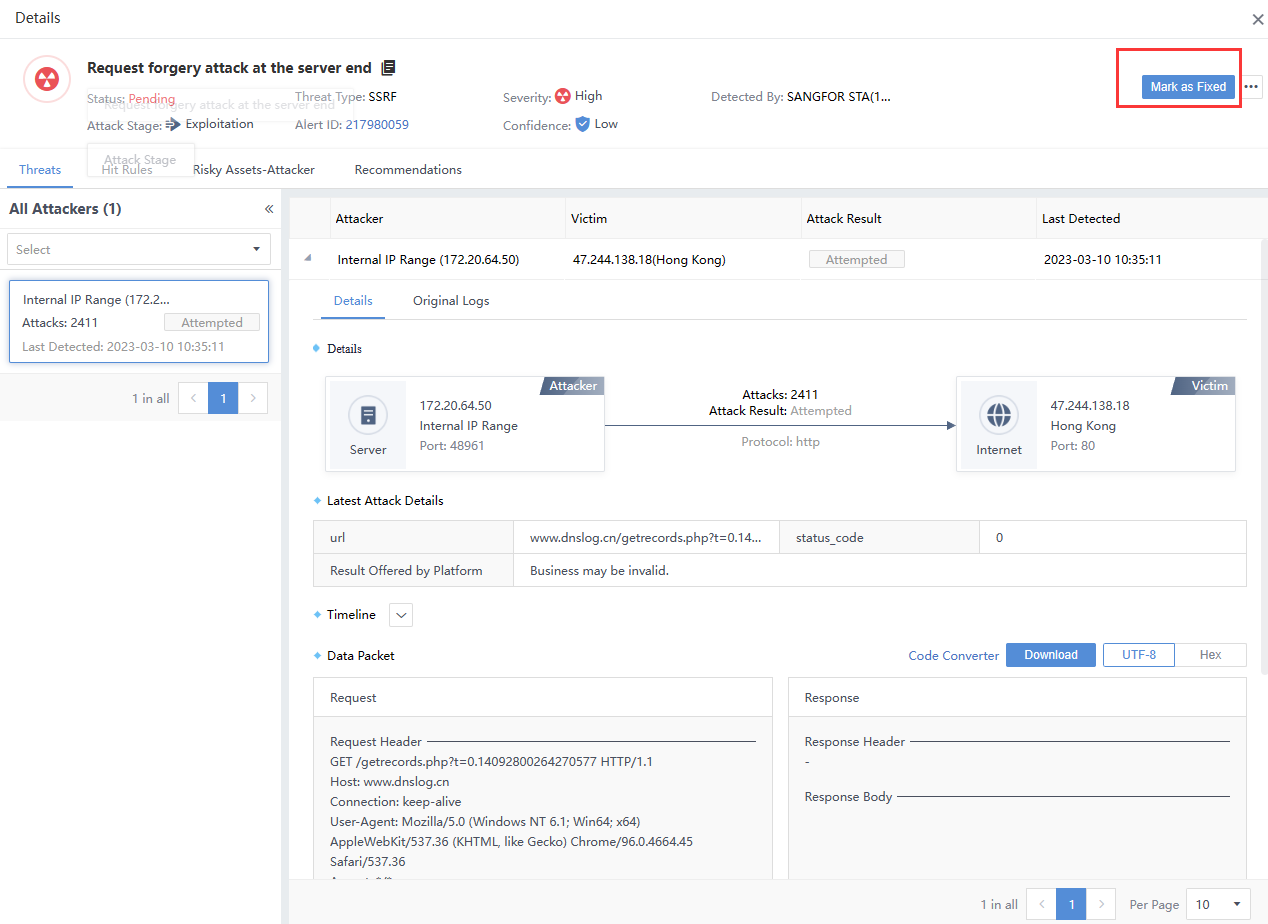
Method Two: Response on the Alert Details Page
Select a specific threat on the Security Alerts page to enter its details page. Then, click the icon at the upper right corner of the page, as shown in the following figure.
Note: The above two methods have the same effect, and both operate on all risky assets of a single Security Alert.
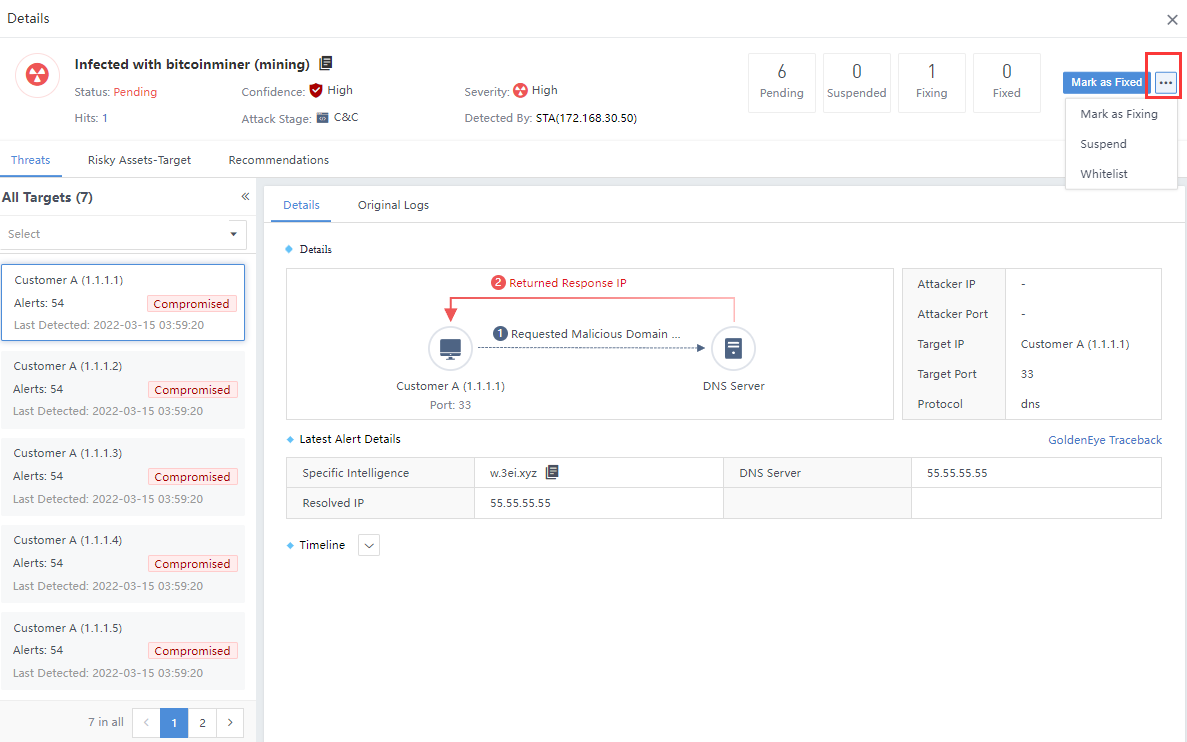
Response of individual risky assets in alert
Select a specific threat on the Security Alerts page to enter its details page. Then, select the Risky Assets–Target tab to see the associated risky assets. Select the risky assets you want to respond to and click Mark as fixed. After responding, you can see the response’s status in the upper right corner of the details page, as shown in the following figure.
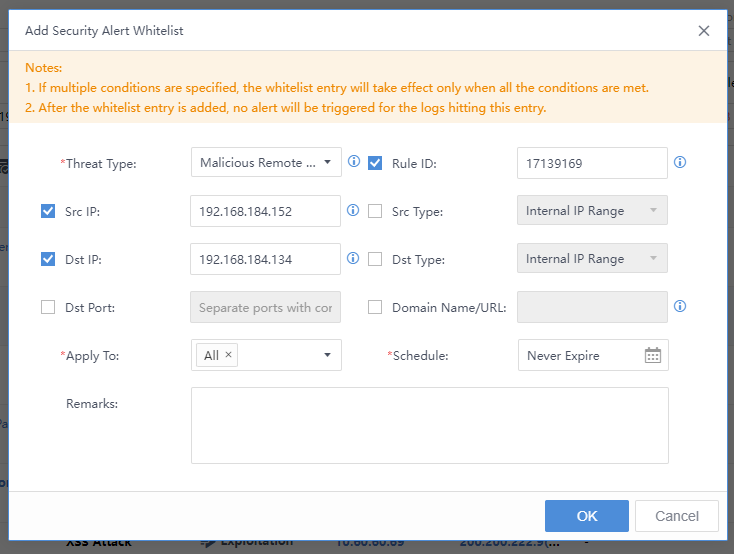
Whitelist
In addition to manual handling of Security Alerts, you can also manually whitelist the security alert. Select the threat, click the icon, and click Whitelist. The Add Security Alert Whitelist pop-up box will appear automatically. The Src IP, Dst IP, etc., are filled in by default. You need to specify the Applicable Device and Schedule, etc.
HCI Integration
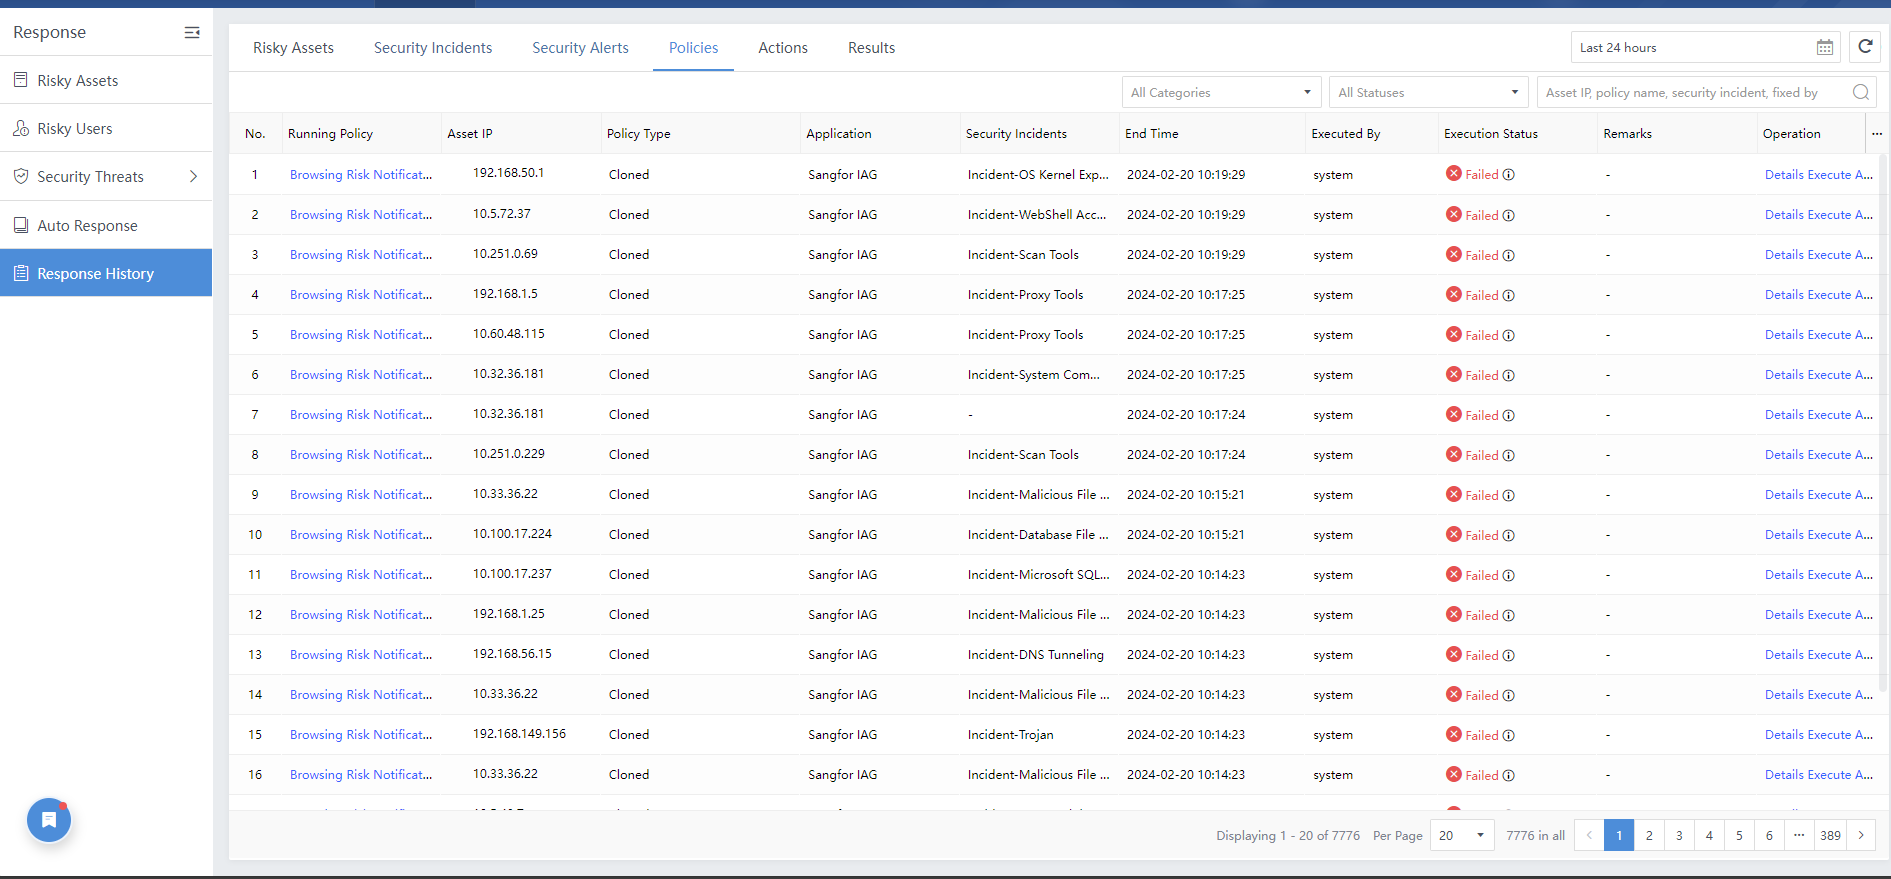
You can navigate to Response > Response History > Auto Response History,to check the execution status, end time, etc. You can also click Execute Again to execute the failed running policy, as shown in the figure below.
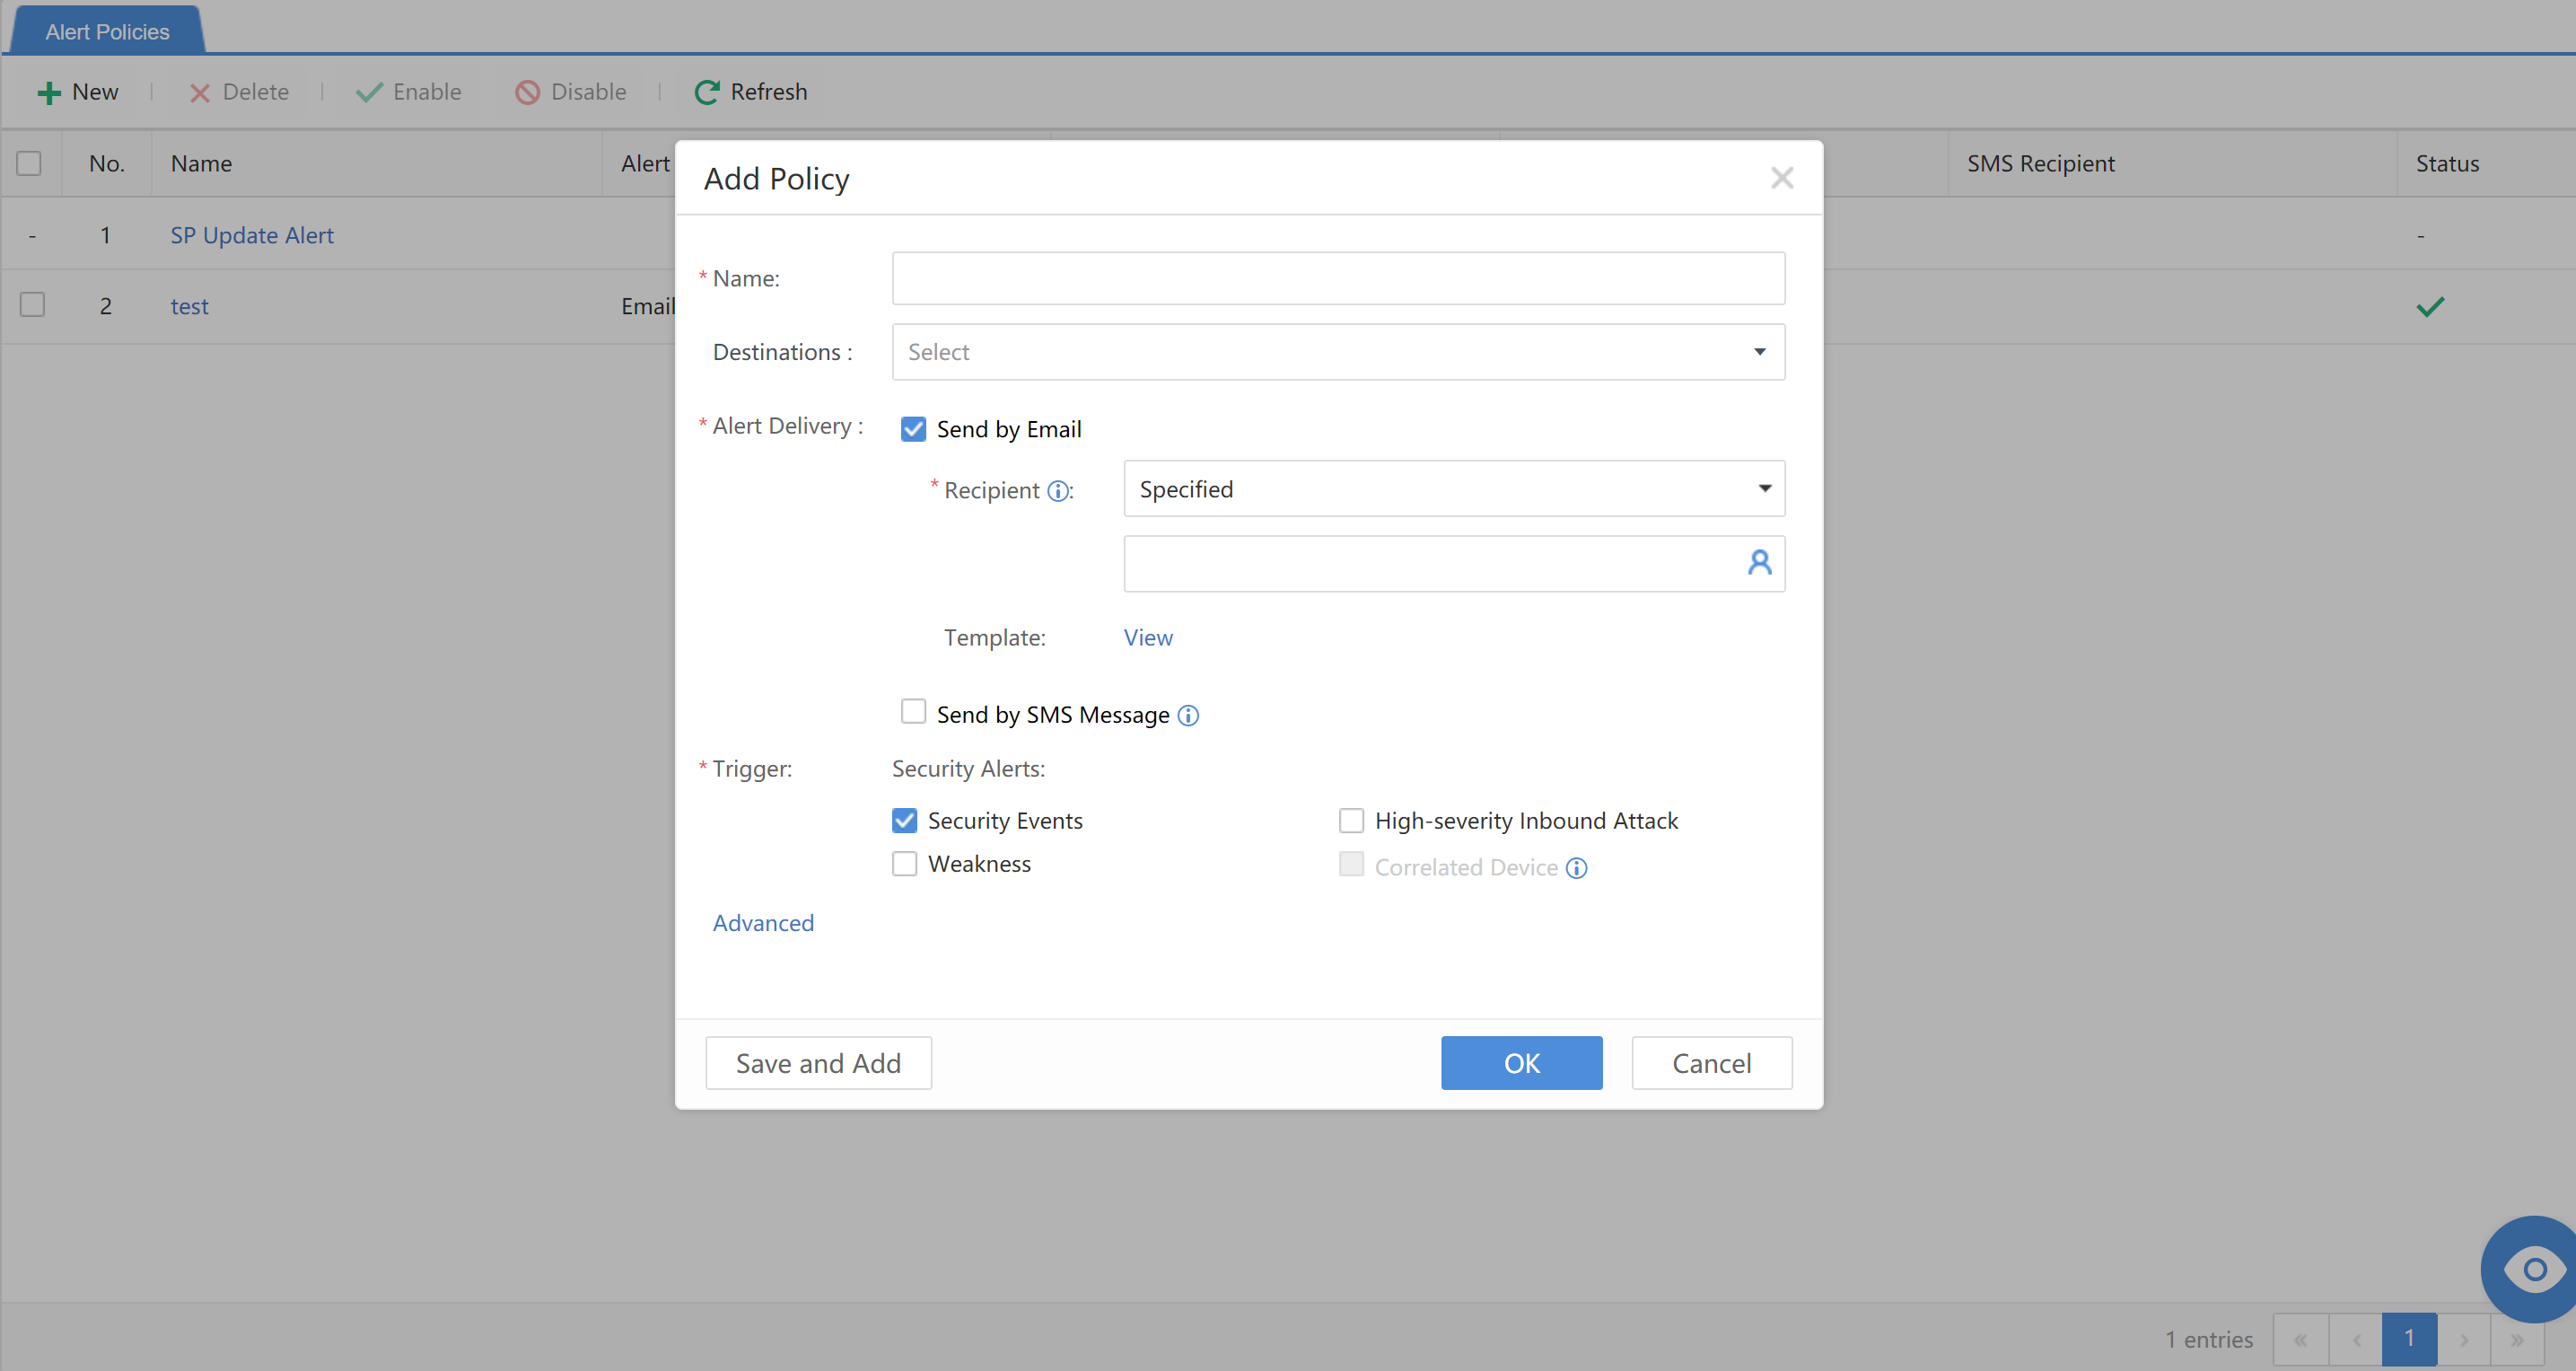
5.6 Response Policies
Policy management is to connect various devices or platforms through SOAR tools.
It helps customers build a standard handling process for security alerts/incidents, accelerate security threat response, respond to various security attacks in a timely and effective manner, build a security defense system, and reduce security operating costs. Policy management includes policy classification, policy addition, policy editing, etc.
Policies Classification
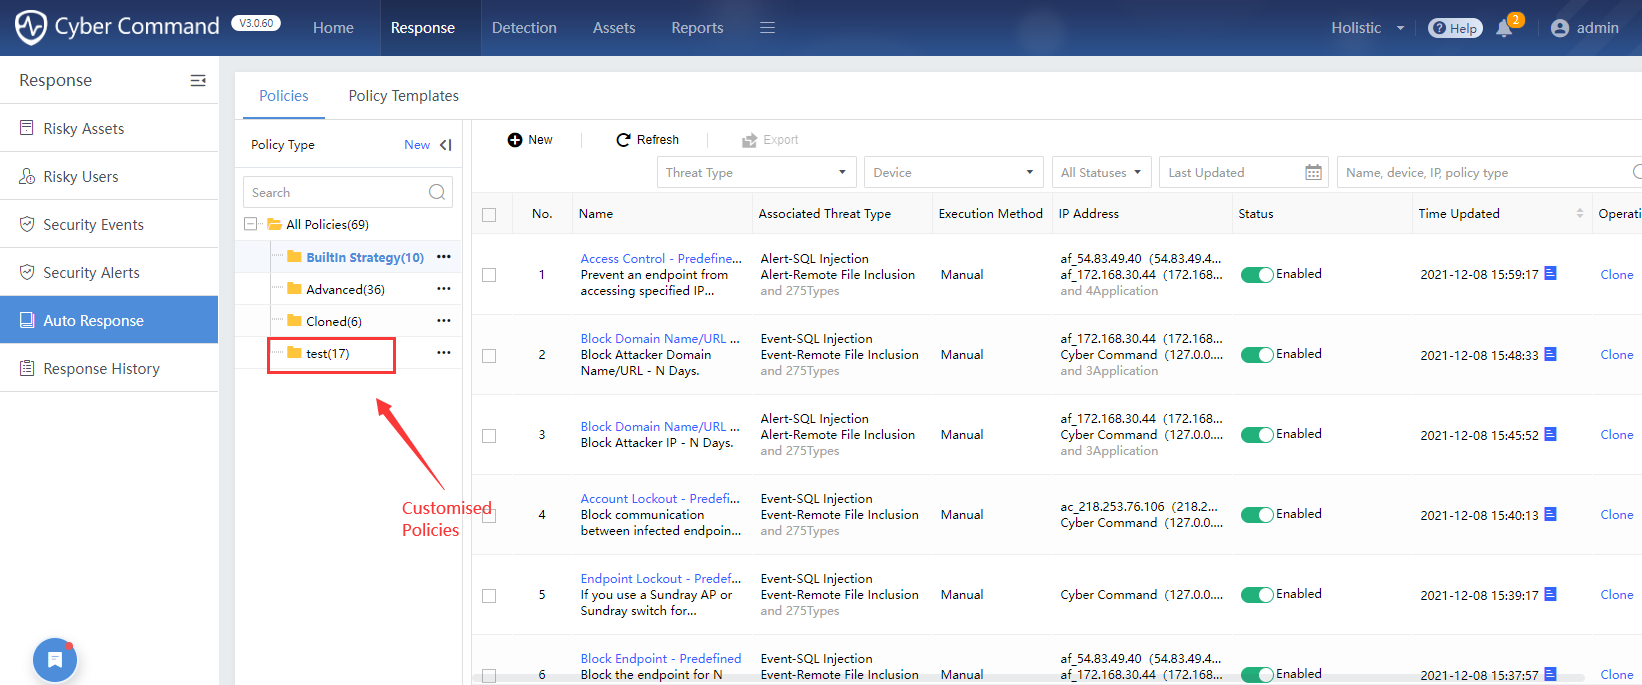
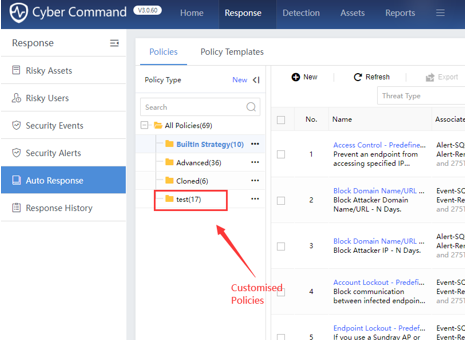
The system default policy types include Built In Strategy, Advanced, and Cloned. You can create a custom policy type, as shown in the figure below.
BuiltInStrategy:The policies were developed from the SOAR tool production line and synchronized to Cyber Command.
Advanced:Refer to the default automatic response policies of the previous version (not including customization). After the upgraded version, it will be smoothly upgraded and translated into Response Strategy Conversion Script, as shown in the figure below.
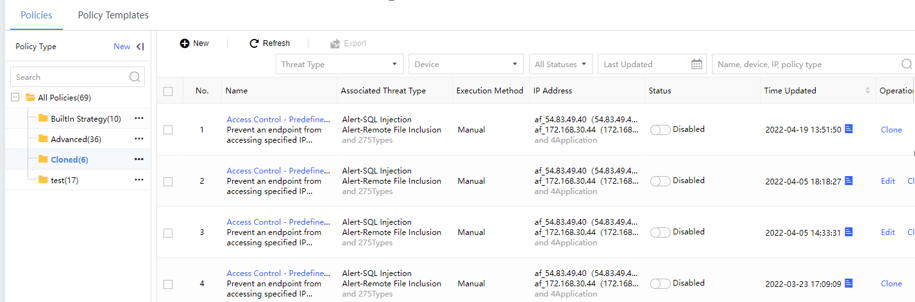
Cloned:After cloning Built In Strategy or Advanced policies, it will be automatically added to the Cloned policies. Edit and save the policies here. After copying, the policy name will default to the original policy name-copy Unix timestamp in time-copy format, as shown in the figure below.
You can click the copied policies to edit it.
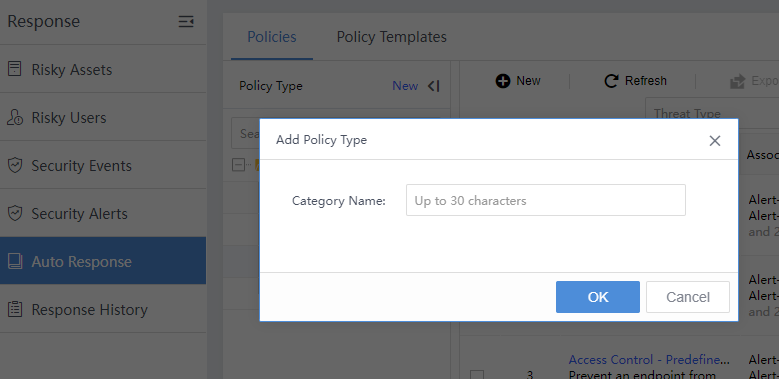
Custom:Customize the catalog and add new policies here. On the Response> Auto Response>Policies page, click New beside Policy Type to create a custom category, as shown in the figure below.
Add New Policies
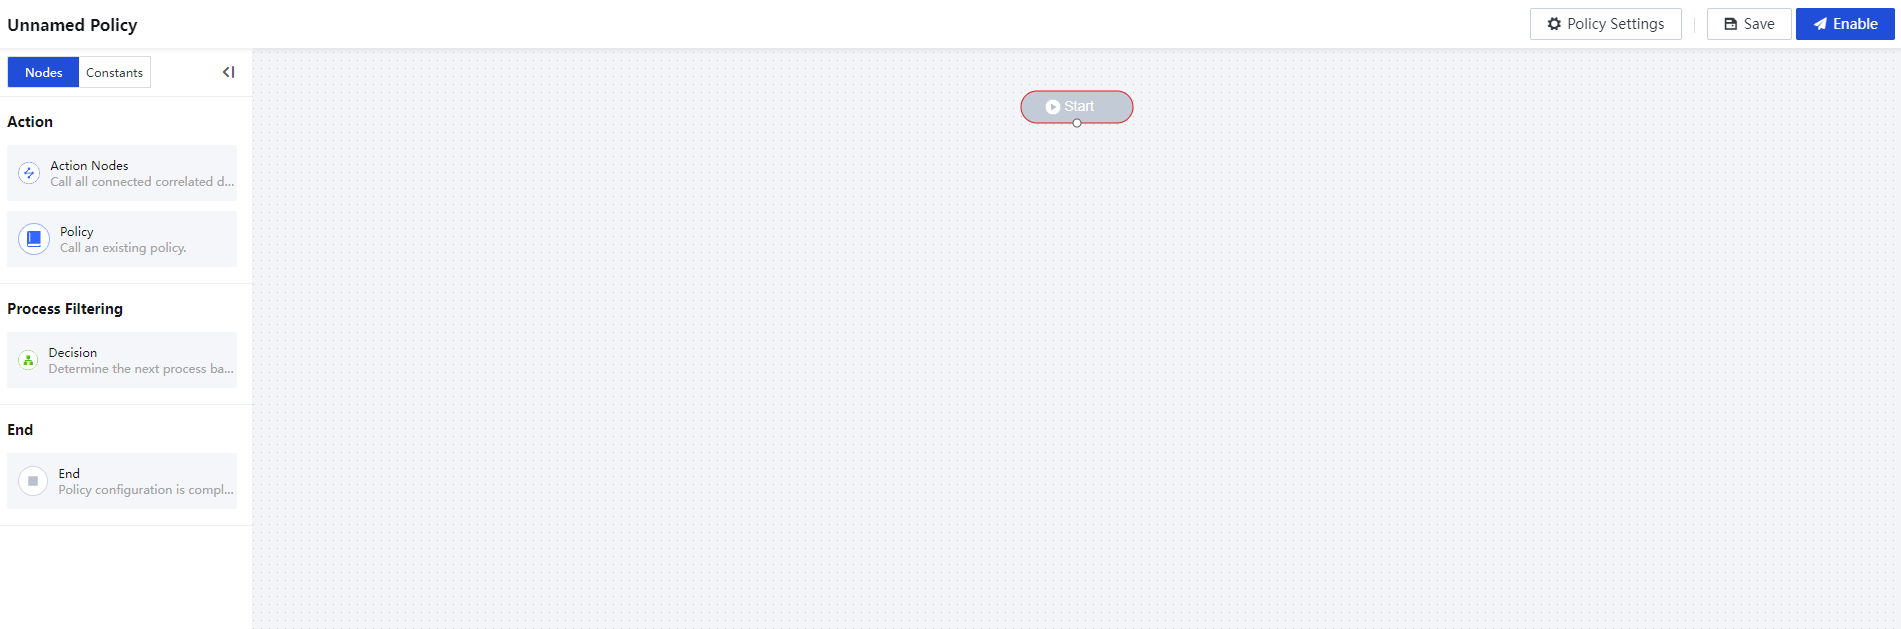
On the Response>Auto Response > Policies page, click New to enter the policy layout canvas, as shown in the figure below.
The left navigation pane includes the Nodes and Constants library. Below is the function description:
| Category | Name | Function Description |
|---|---|---|
| Nodes | Action Nodes | Response actions corresponding to applications are different for different applications. |
| Nodes | Policy | Refers to the entire response process, including execution nodes, process filtering nodes, end nodes, etc. |
| Nodes | Decision | When logical judgments are needed between nodes, decision-makers will be introduced, and common judgment conditions such as if-else judgments, etc. |
| Nodes | End | Identifies the node where the entire policy flow ends. |
| Constants | Mark the parameters as constants. For example, mark a specific IP address/network segment as a business group/organization name as a constant, which can be quickly and intuitively identified and called in the policies layout. Besides network IP resources, other resource types can be defined. |
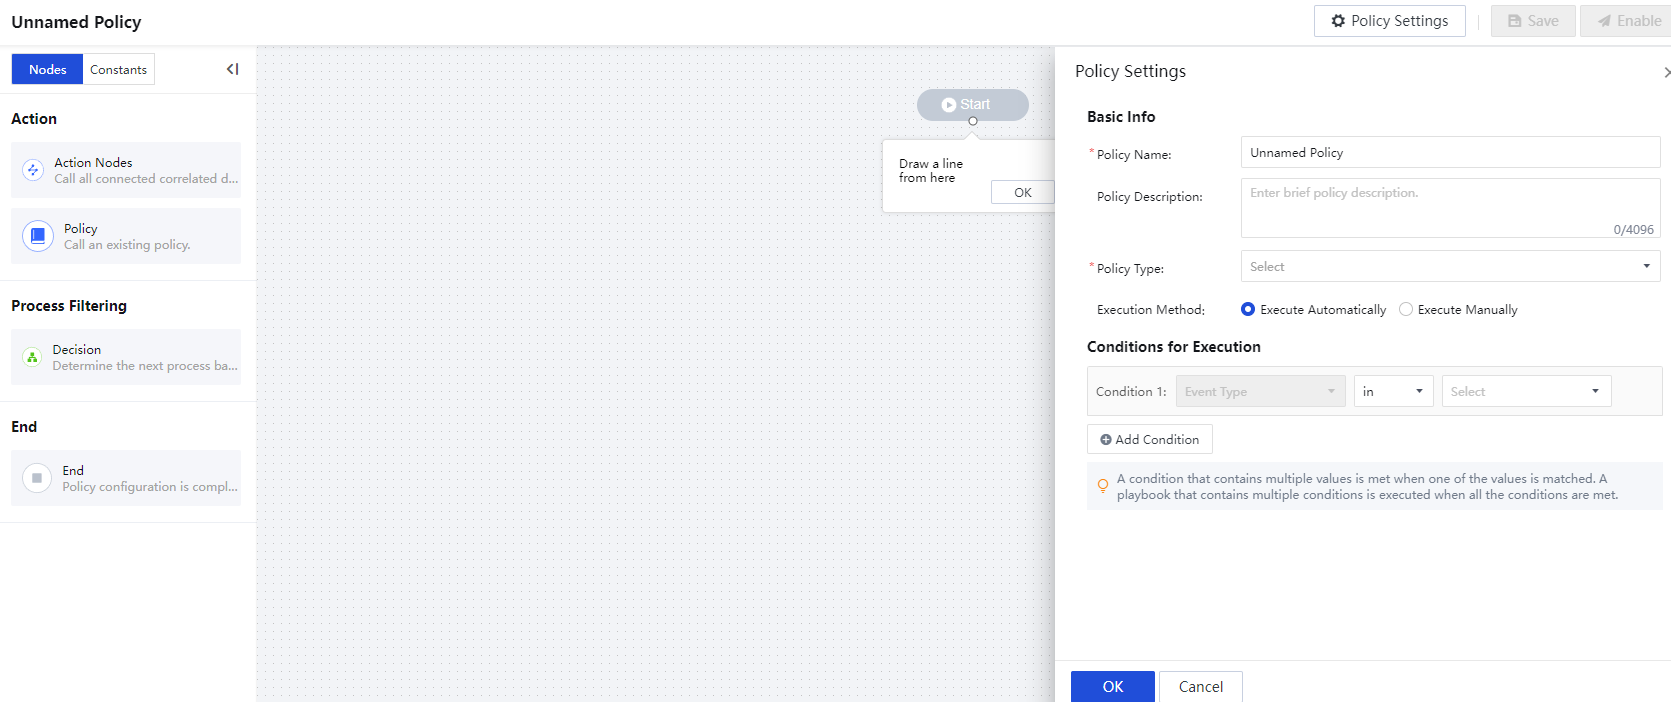
Policy Settings
Fill in the Policy Name,Policy Description,Policy Type, Trigger Type, and set Conditions for Execution in the Policy Settings pop-up box, as shown in the figure below.
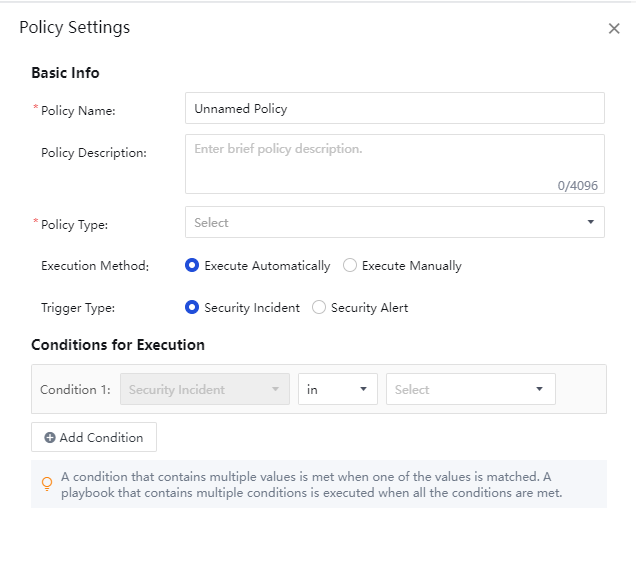
Policy Name:Required field, custom name.
Policy Description: Optional field, fill in according to the actual situation.
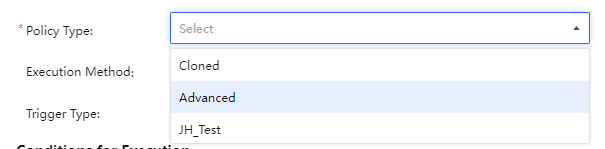
Policy Type: Classified into Cloned, Advanced, and custom policies, as shown in the figure below.
Execution Method: There are two methods: Execute Automatically and Execute Manually. Scripts under Execute Automatically mode will automatically match the conditions after the corresponding event and then automatically execute the corresponding integration processing. If set to manual execution mode, the policies will not be executed automatically, and you need to manually select manual execution in the corresponding response policy.
Conditions for Execution: Mainly to delineate the scope of application of the policies through multiple aspects. The aspects include Asset Type,Group,Time Detected,IP,Rule ID, and Security Incident. Only one condition can be configured each time. The relationship between them is "and" when there are multiple conditions. When there are various values in a single condition, the relationship between the values is "or". At least one condition must be chosen by default, as shown below.
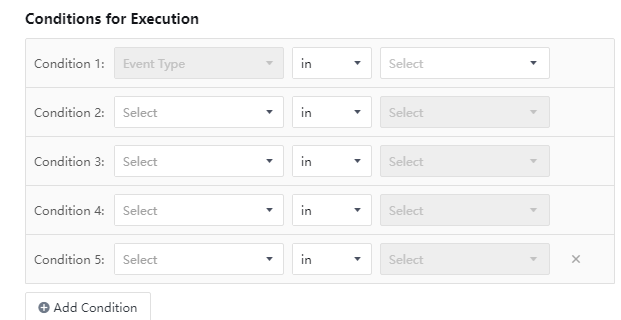
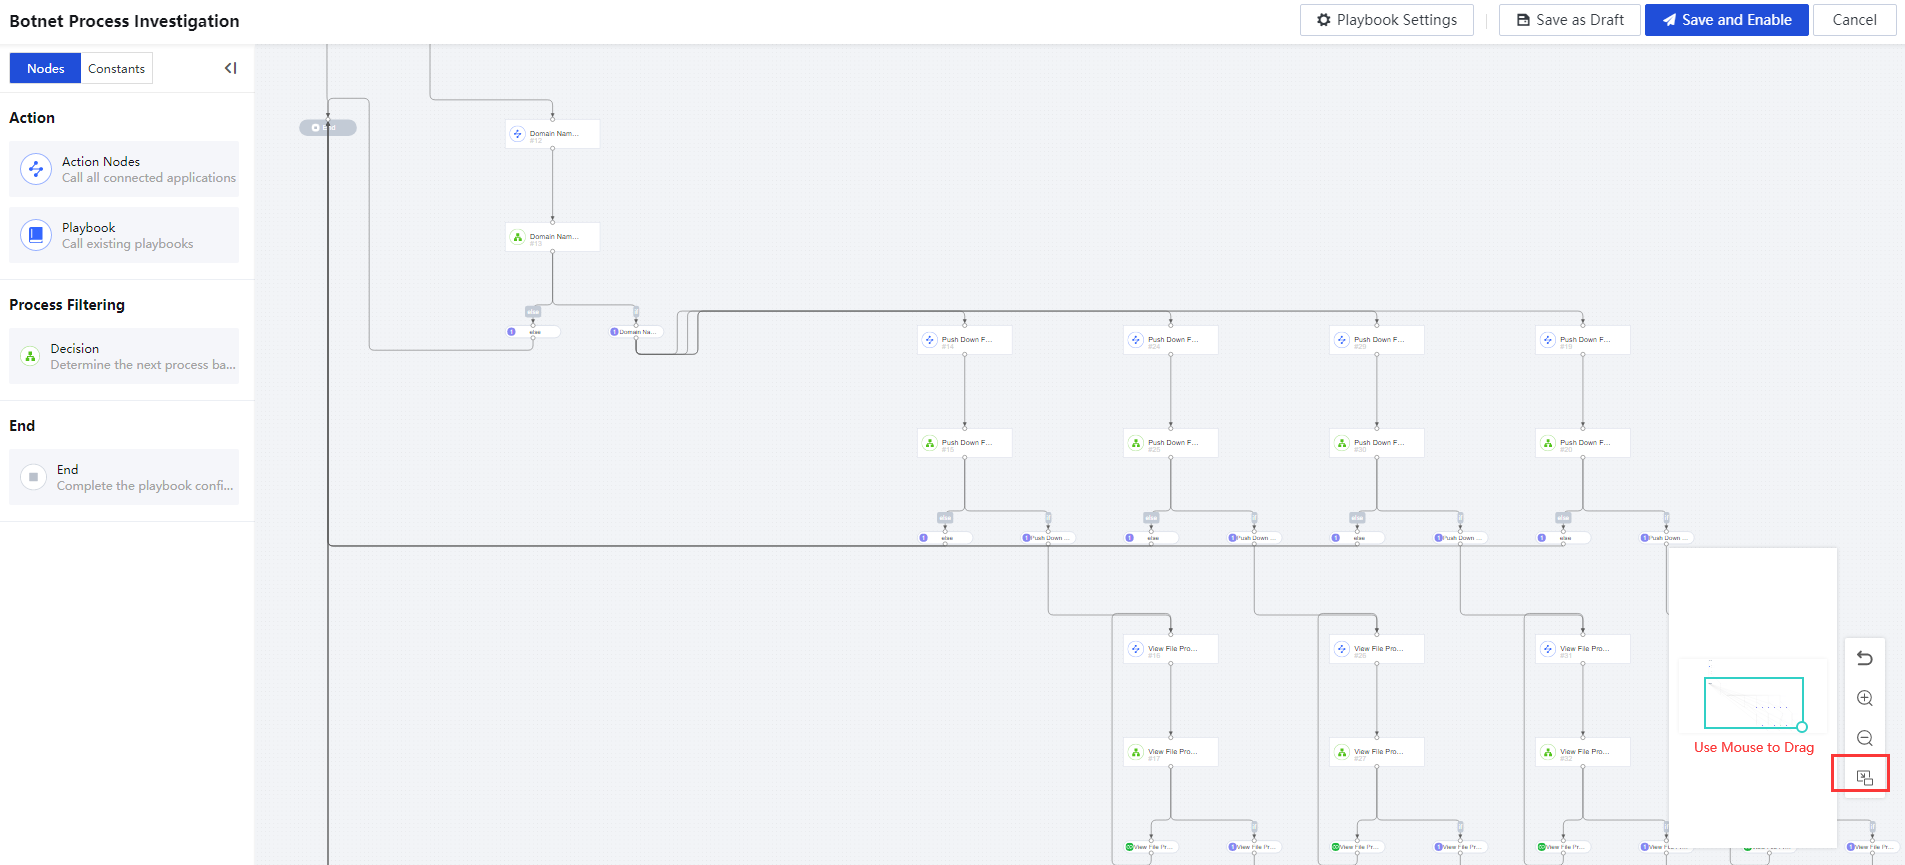
As shown in the figure above, the condition of the incident type must exist by default and cannot be changed. Each aspect can only be referenced by one condition. When the condition is full of all attributes, the Add Condition button will be set. Gray shows a non-editable status. After the policies are set, click OK to enter the canvas, and you can perform operations on the policies, such as Save Draft and Update Online, as shown in the figure below.
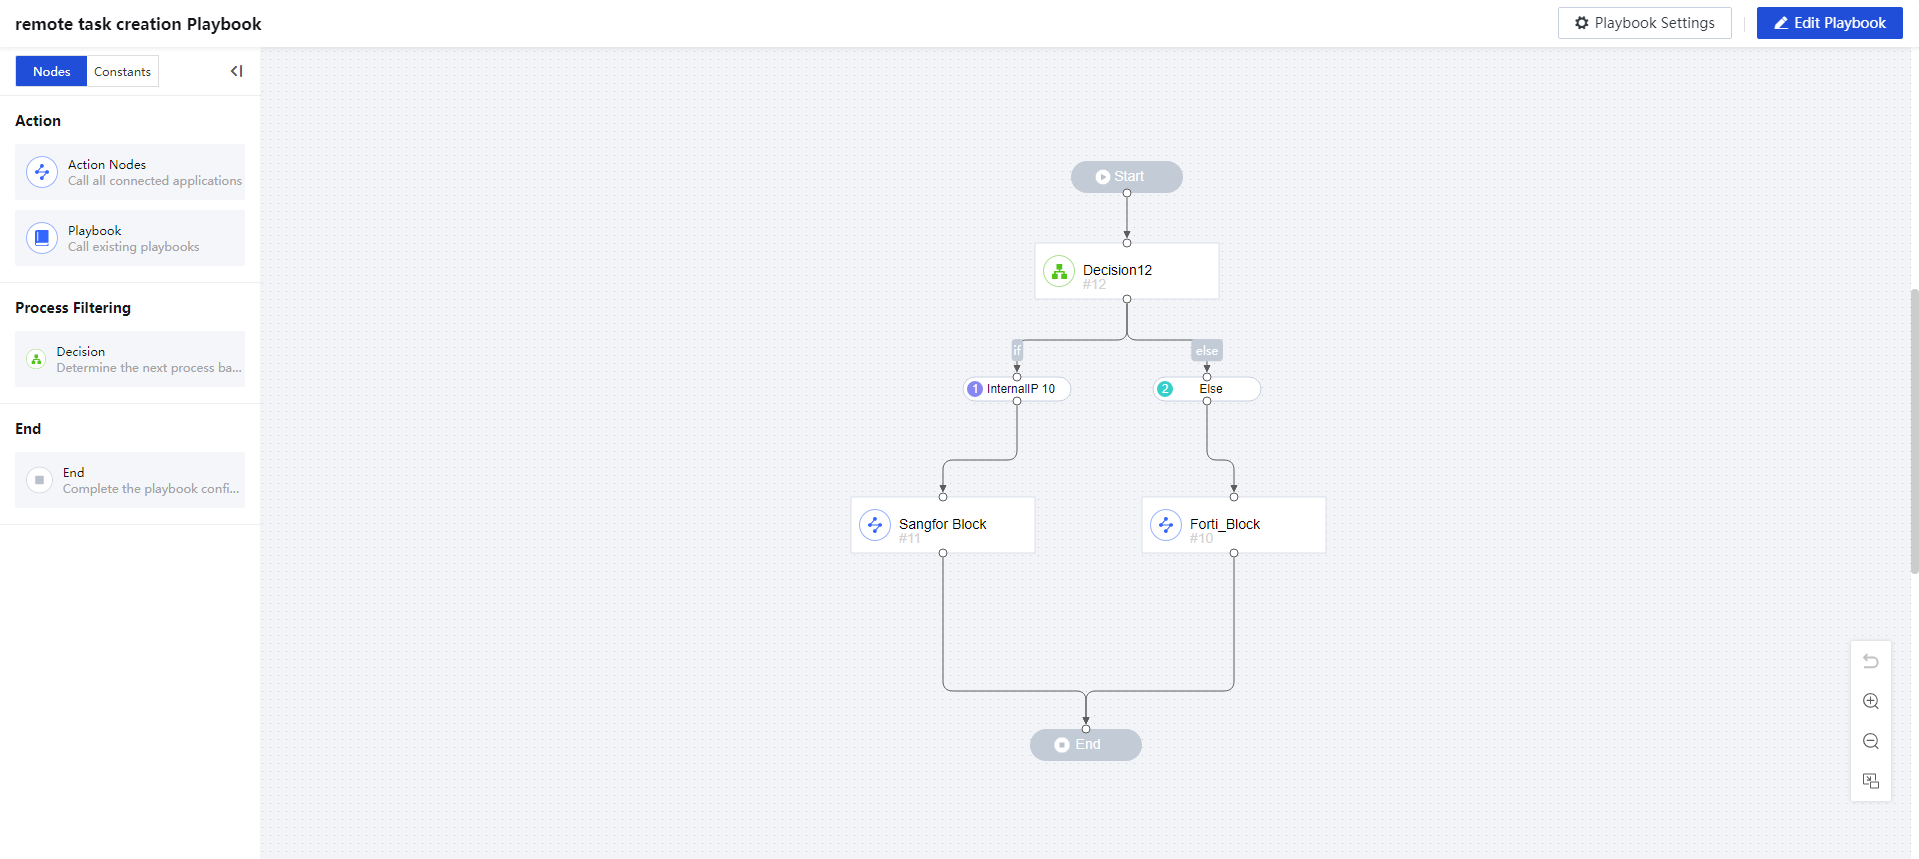
In the above figure, click on the canvas to undo the policies layout to the previous action, you can zoom in, zoom out, display thumbnails. Use the mouse to drag and adjust, as shown in the figure below.
Add the Node
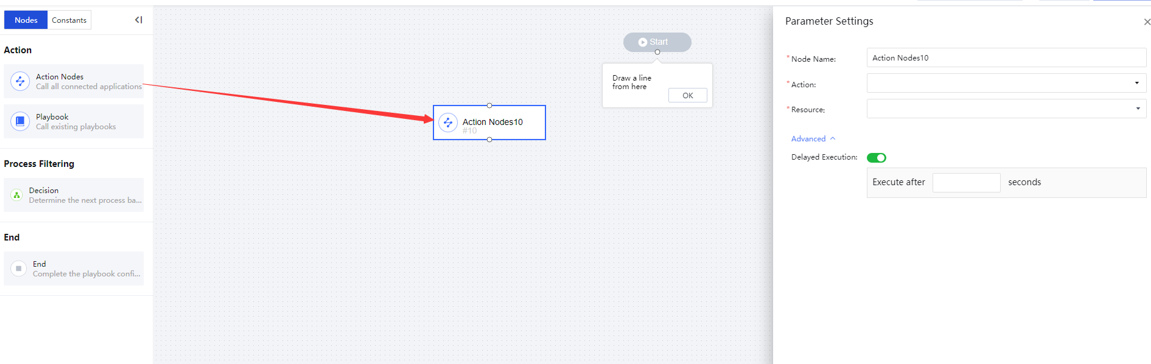
On the Auto Response page, under the Policies category, click New to enter the canvas interface and drag the Action Nodes icon in the left navigation bar to the middle canvas area.
Action Nodes
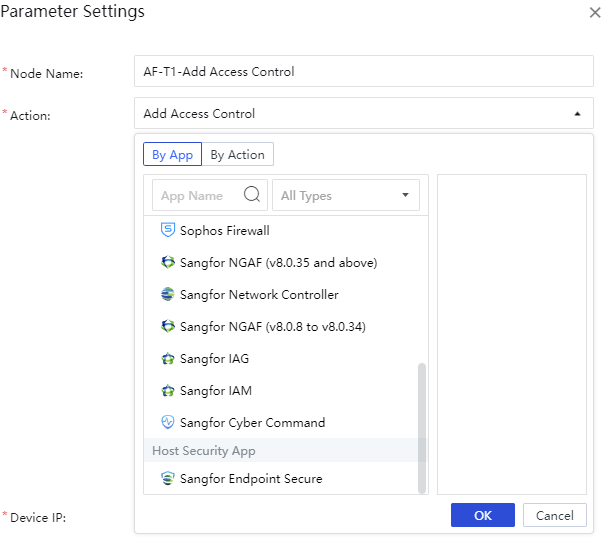
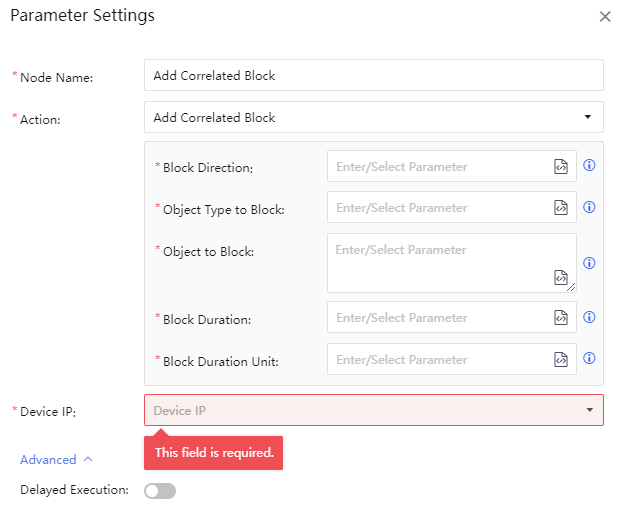
Drag the action node to the canvas and double-click to enter the Parameter Settings box, enter the Node Name,Action,Device IP, and click Advanced to turn on or off the Delayed Execution manually.
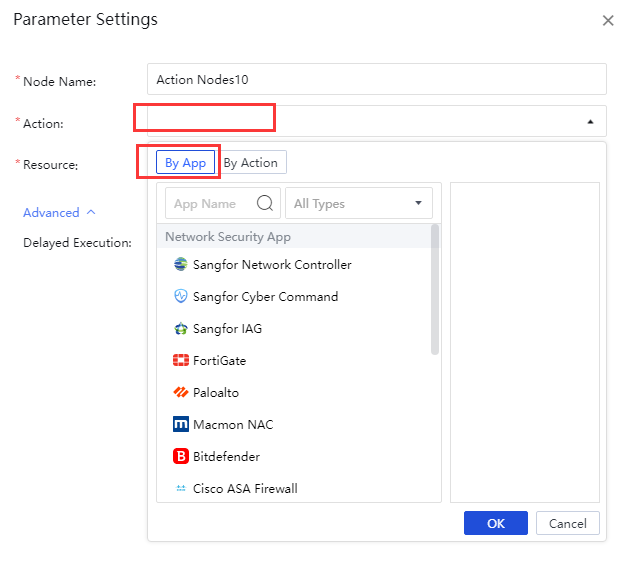
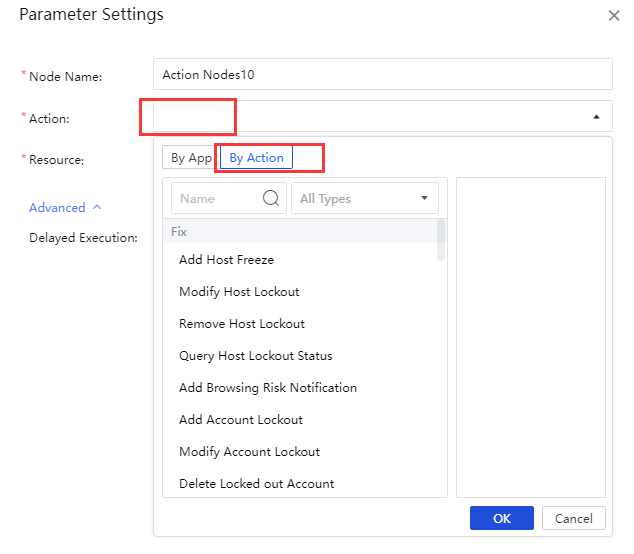
Action: Choose according to the application/action. There are differences in actions between different applications. You can choose visually By App or By Action according to the navigation of the pop-up box classification. You can also perform a fuzzy search for applications/motions based on keywords, as shown in the figure below.

Action Node-policies
You can call an existing policy for nested action when adding a new policy. Drag Action Nodes directly to the canvas and double-click to configure. Fill in the Node Name, and select By Action for Action. By default, the Delayed Execution is not enabled. Then click OK,as shown in the figure below.
Response History
Navigate to Response > Response History >Actions.
Action execution history mainly records action-level records, as shown in the following figure.
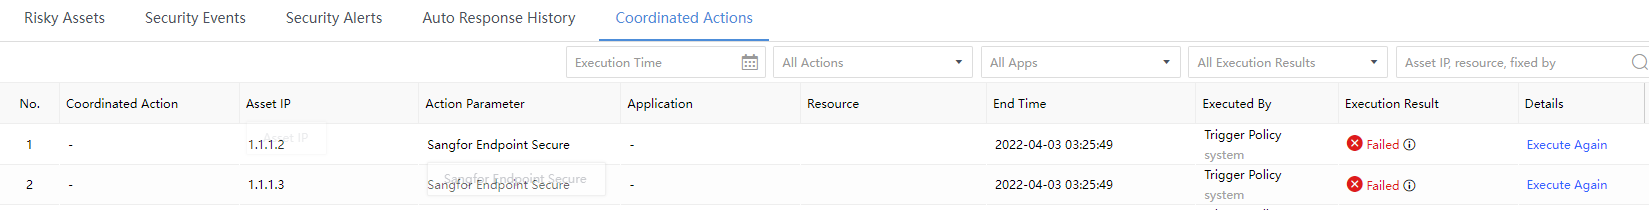
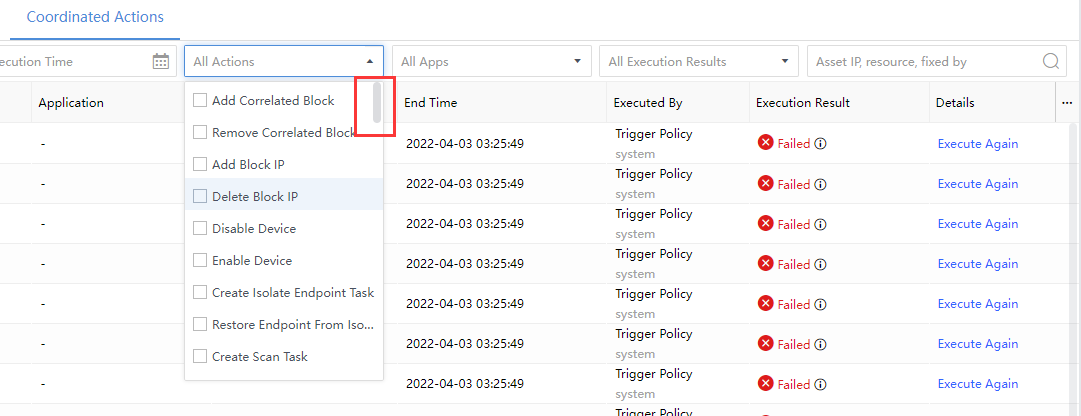
All Actions:All response actions supported by the Cyber Command platform, as shown in the following figure.
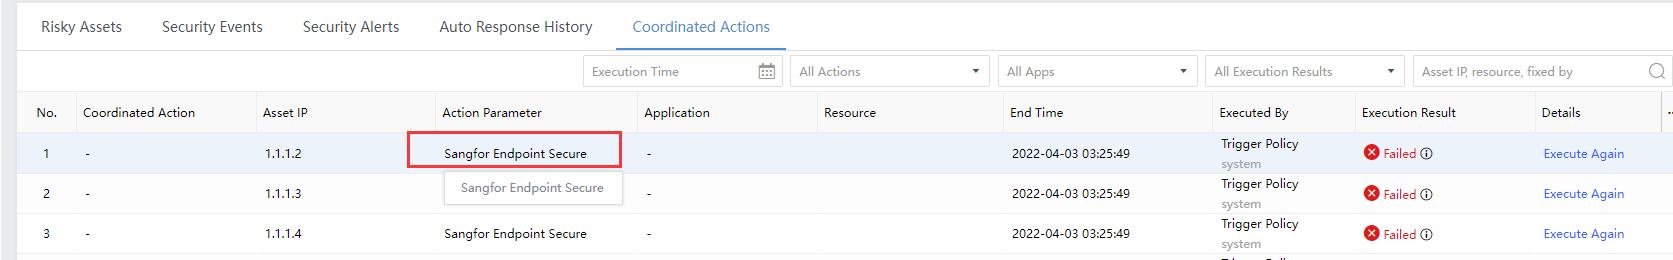
Action Parameter:A collection of action-related properties, including calling application, calling resource, endpoint ID, file ID, file MD5, response method, event type, and risk level to be fixed. You can see it at the end of each successful action line, as shown in the following figure.
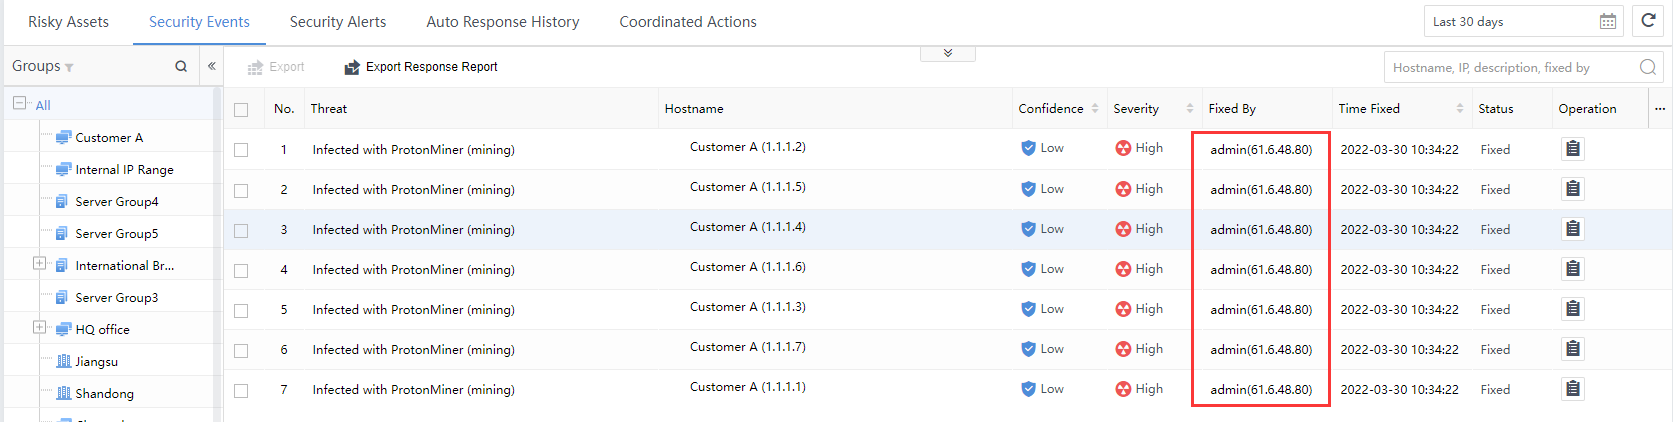
Fixed By: The role that invokes the policies, including manual execution by Cyber Command platform users (for example, admin) and script triggering method (system creation automatic execution), as shown in the following figure.
Results:If the execution fails, the info icon will show the cause of the failure, as shown in the following figure.
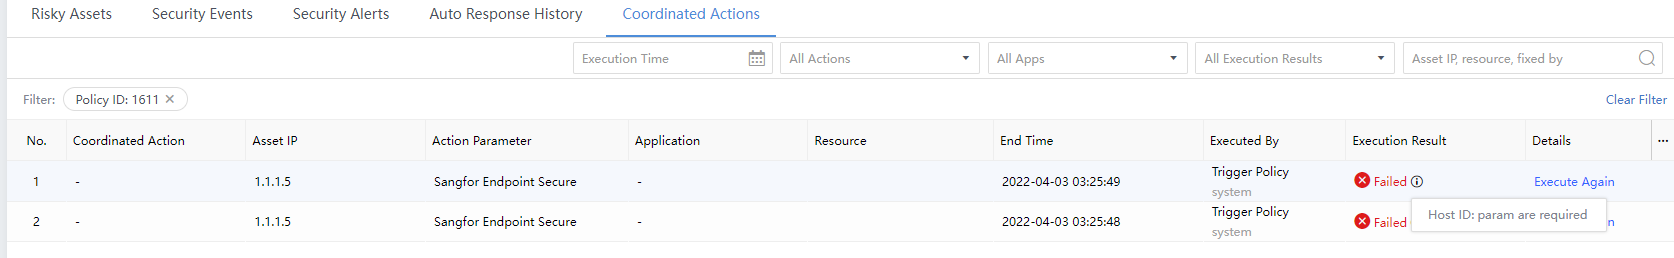
All Execution Results:If the execution is successful, you can click to view the details. If the execution fails, you can correct it according to the failure cause and click Execute Again, as shown in the following figure.
Detection
Certain experience is needed for further analysis of Security Incidents or risky hosts. Normally, security professional personnel use this to analyze the Security Incidents and Security Events.
Logs
Retrieve security logs and audit logs. There are certain security analysis requirements, which are used when security issues need further analysis.
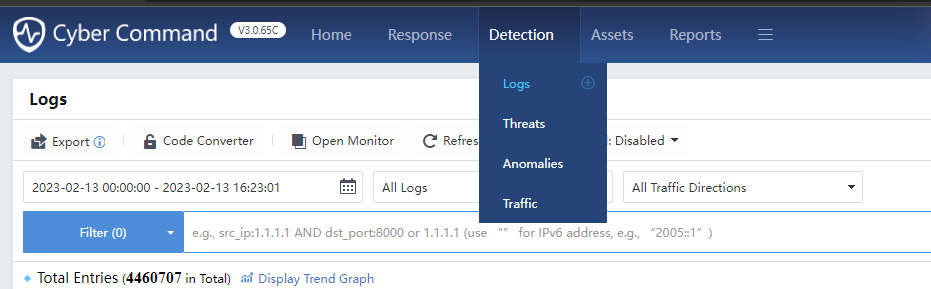
All Logs:Divided into Security Logs and Audit Logs. You can view more detailed log types in each category.
Click All Traffic Directions to select the access direction of the log to be queried, as shown below:
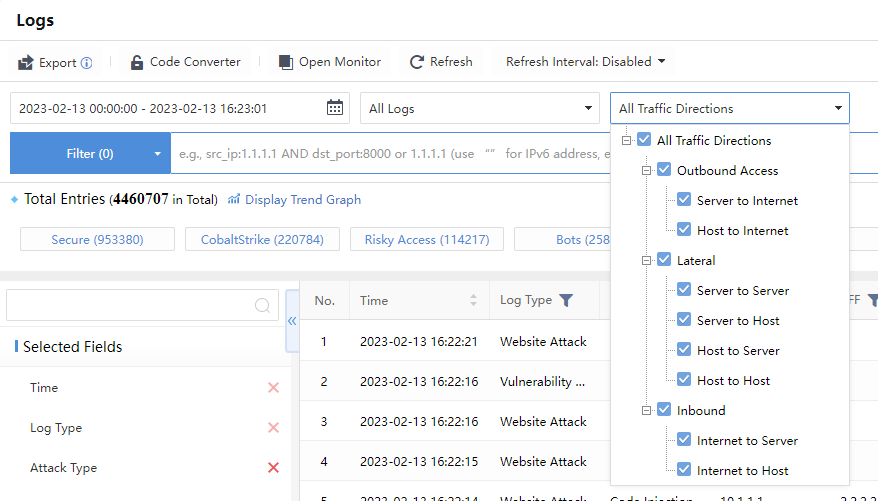
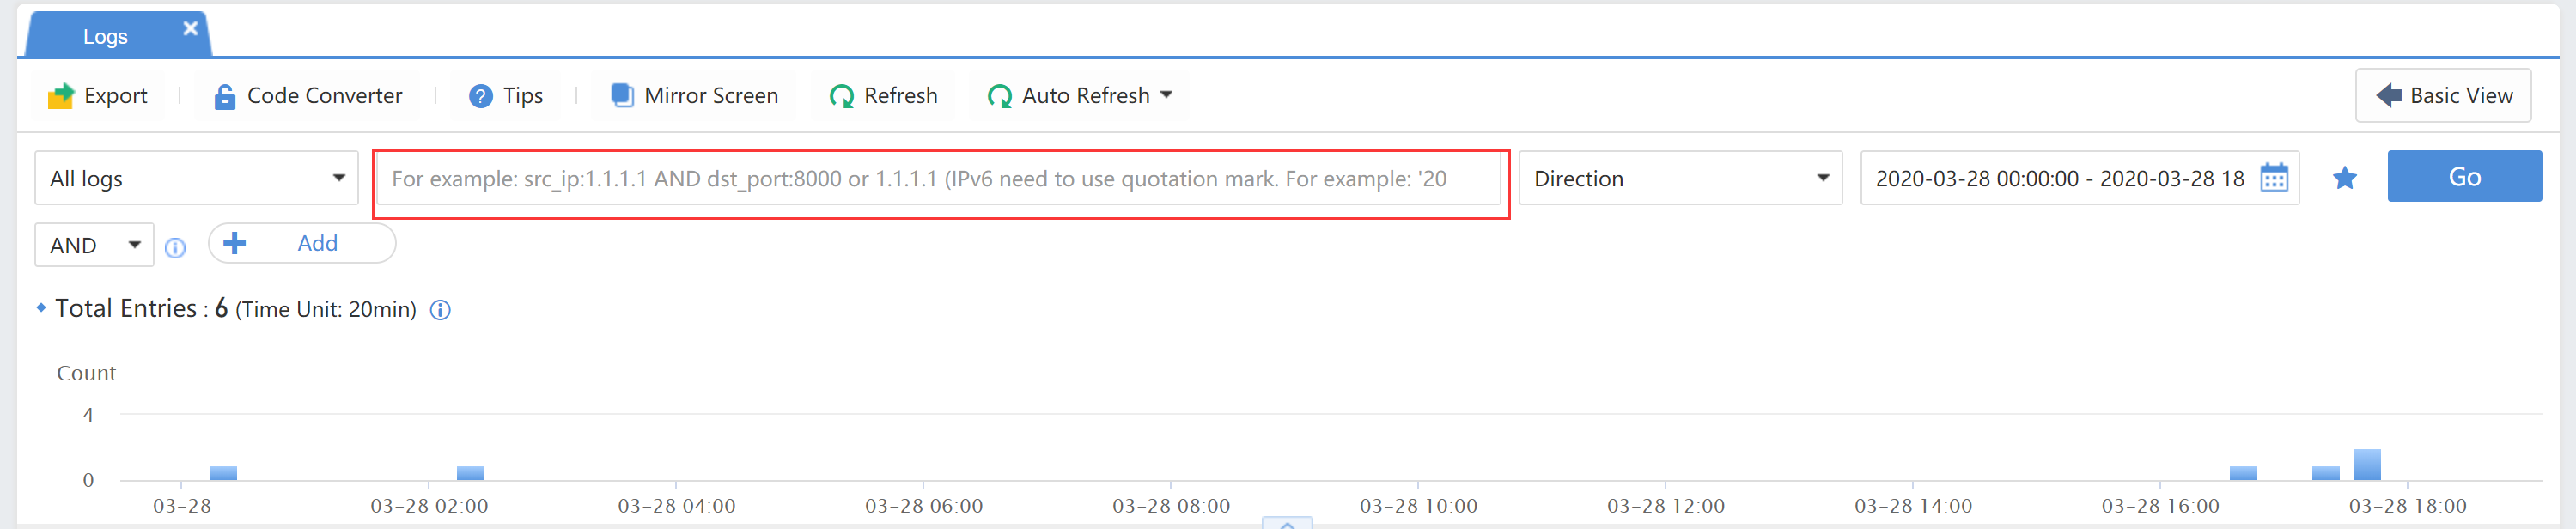
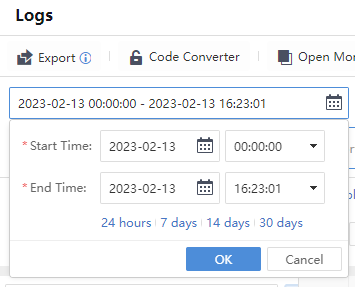
Click the time range to select the range of query time.
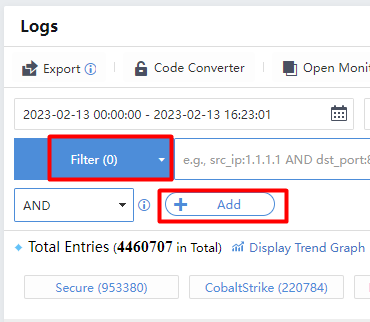
Click Filter>Add to query multiple conditions simultaneously.
Click to query historical search records, and add the common search records to the favorites for later use.
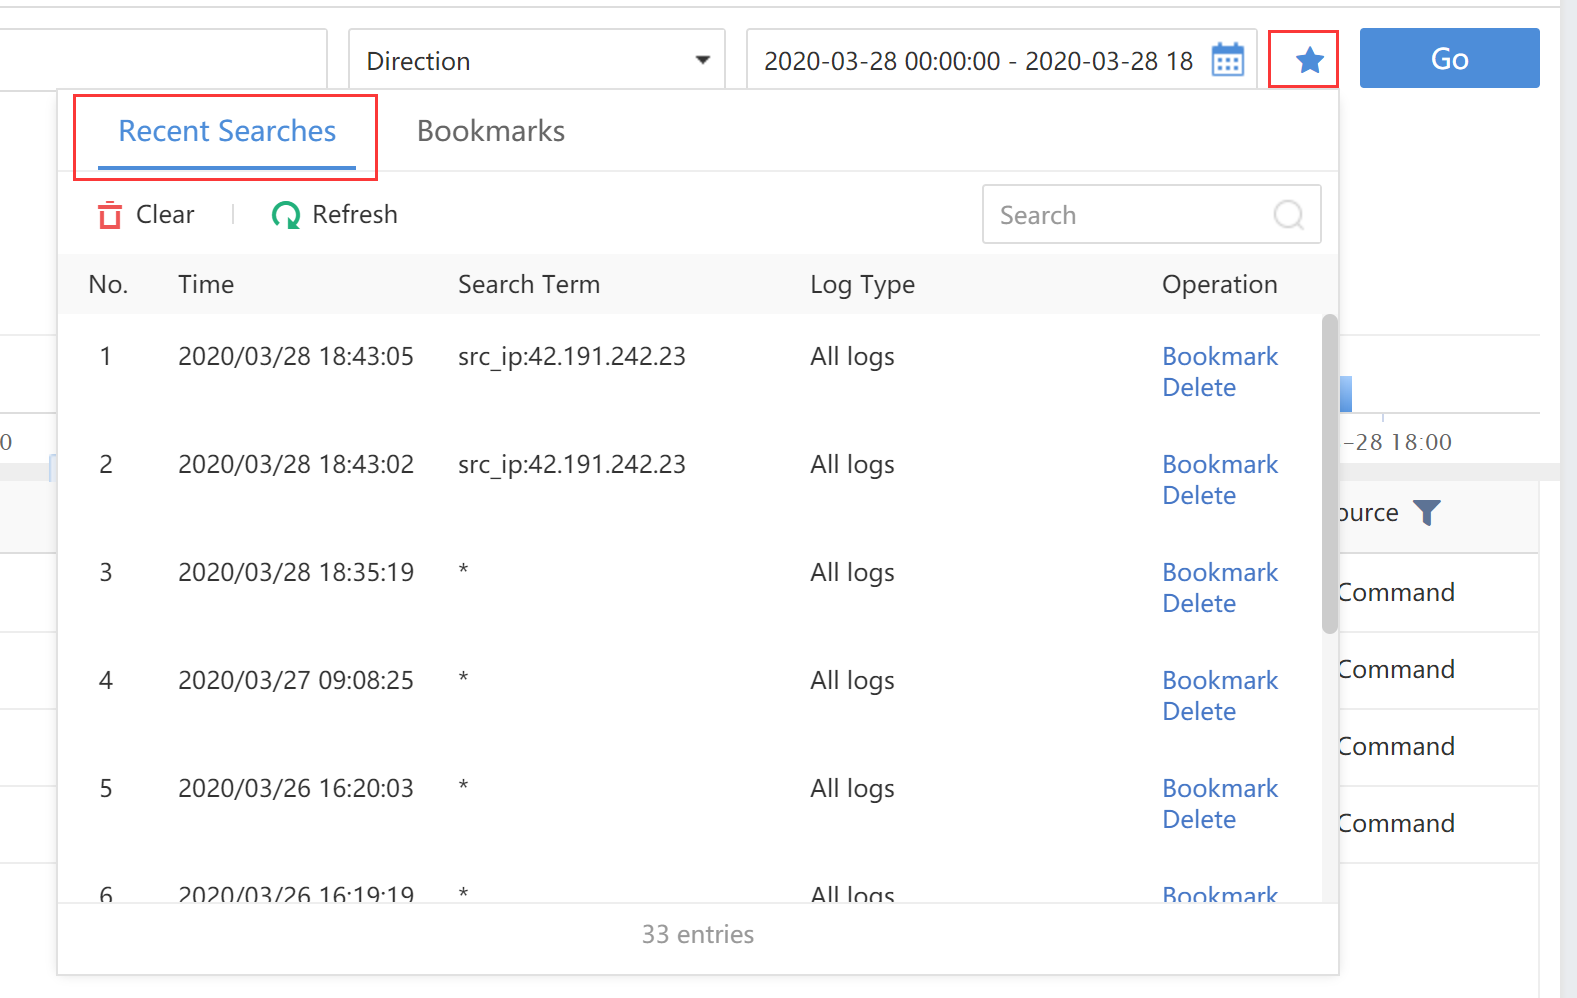
Time:Refer to the generation time of logs.
Search Term:Refer to the attacks on hosts.
Log Type:Refer to the types of logs.
Operation:Bookmark the records.
Threats
Through the threat analysis module, Cyber Command can perform detailed analysis on threats such as Ransomware,Cryptomining, File Threats,Inbound Attacks,and Evasive Attacks.
Ransomware
The ransomware risk analysis page focuses on displaying and managing ransom-themed Security Incidents. This part of the data mainly comes from Endpoint Secure and Network Secure(NGAF) integration equipment. The traffic/process of relevant ransom behavior characteristics is found through traffic learning or endpoint security monitoring, and a small part of the data comes from Cyber Command.
Currently, the ransomware attack methods are:
RDP Brute-Force Attack, Ransomware Infection, Ransomware Attack, Commonly-Exploited Vuln, Commonly-Used Port, and C&C Communication.
Threat Presentation
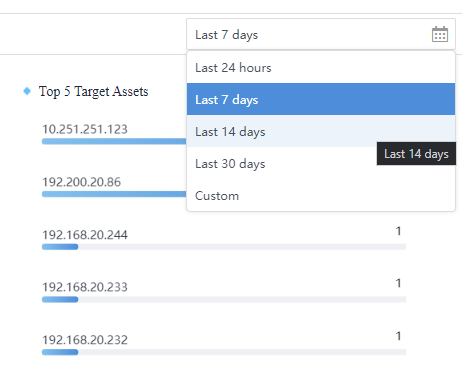
The Ransomware page has several parts, including Time Selection, Detections,Top 5 Target Assets, etc.
Time selection:
You can choose Last 30 days, Last 14 days, Last 7 days, Last 24 hours, or Custom from the drop-down list (not only limited to 1 month, it can be customized), as shown in the figure below.
Detection
The sources of detection include Cyber Command, Endpoint Secure, and Network Secure(NGAF). The data are classified into the ransomware infection route/method, including RDP Brute-Force Attack,Ransomware Infection,Ransomware Attack, Commonly-Exploited Vuln,Commonly-Used Port, and C&C Communication, as shown in the figure below.
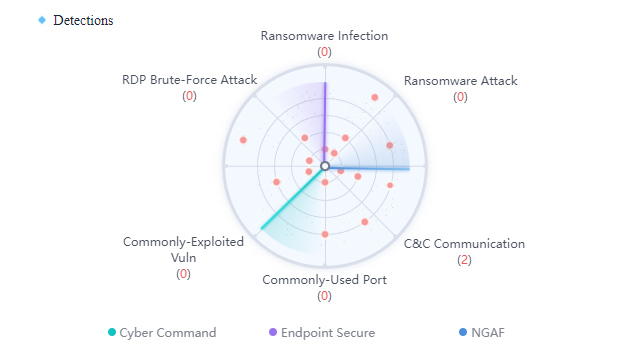
The red number represents the frequency of all ransomware risky assets that this method hits. The source device displays blue under normal conditions and gray when abnormal, and the associated 3-pointers are blue under normal conditions and will detect periodically.
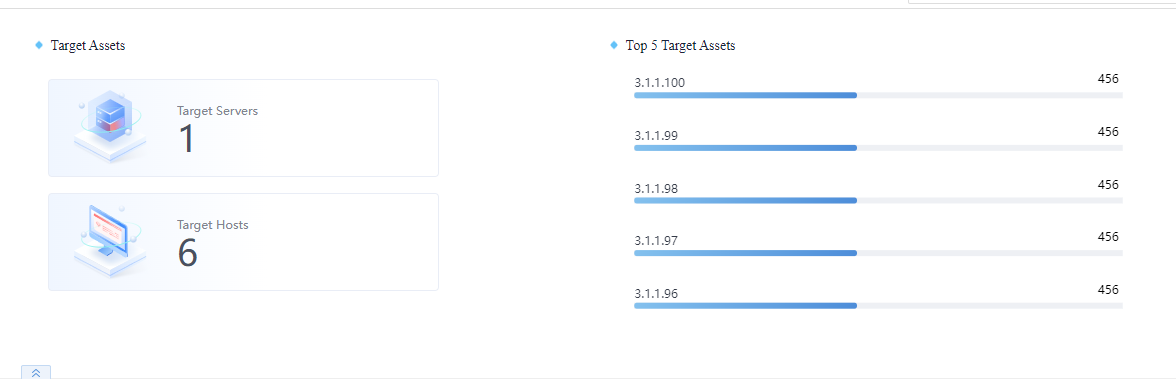
Target Assets
Target assets are classified into four levels: High, Medium, Low, and Compromised. Click each severity level to see a list of related target assets.
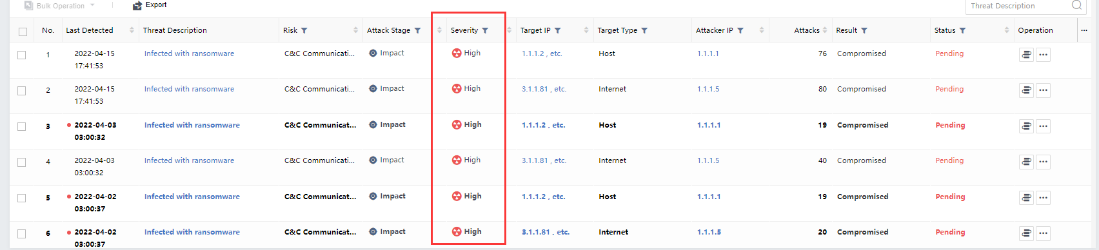
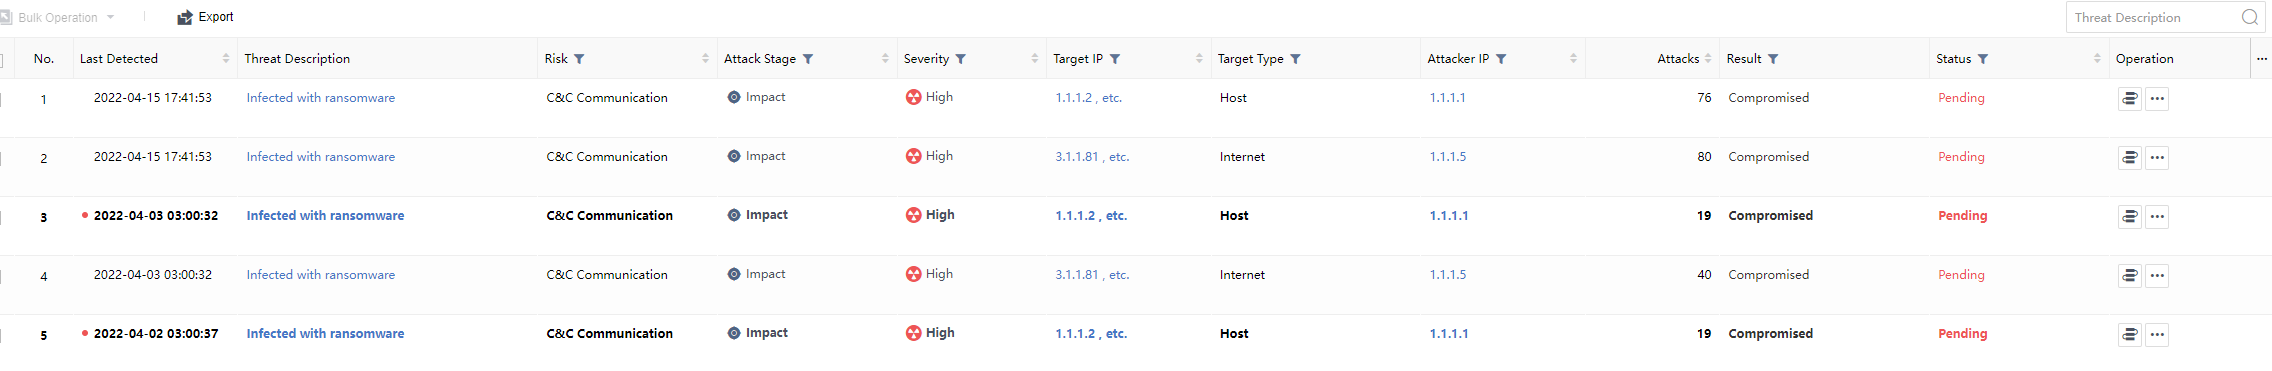
List view
The list of ransom risky assets includes Last Detected, Threat Description,Risk, Attack Stage,Severity,Target IP,Target Type,Attacker IP,Attacks,Result,Status,Operation, etc.
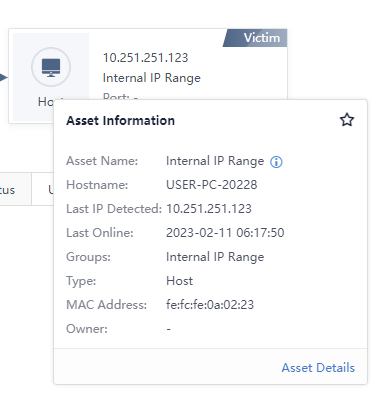
Single view
Click the specific name in the Threat Description column to go to the Details page. The risk summary displays the Asset Name,Hostname,Groups,Owner, etc.
The risk details section mainly includes security alerts and ransomware exposure. Click the specific risk name in the list to enter the vulnerability details page.
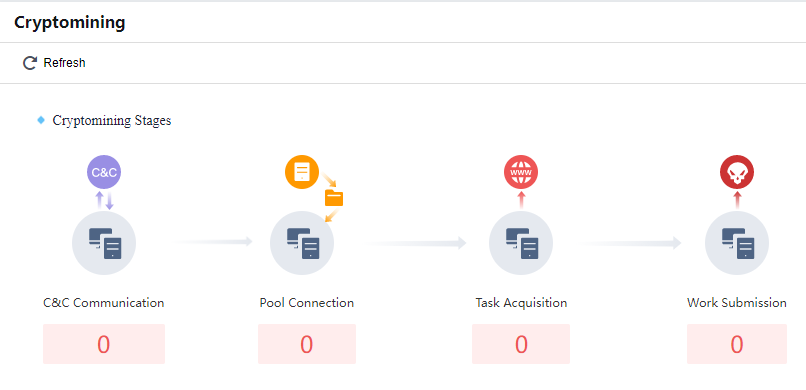
Cryptomining
The Cryptomining special detection function can analyze the intranet mining events detected by the platform.
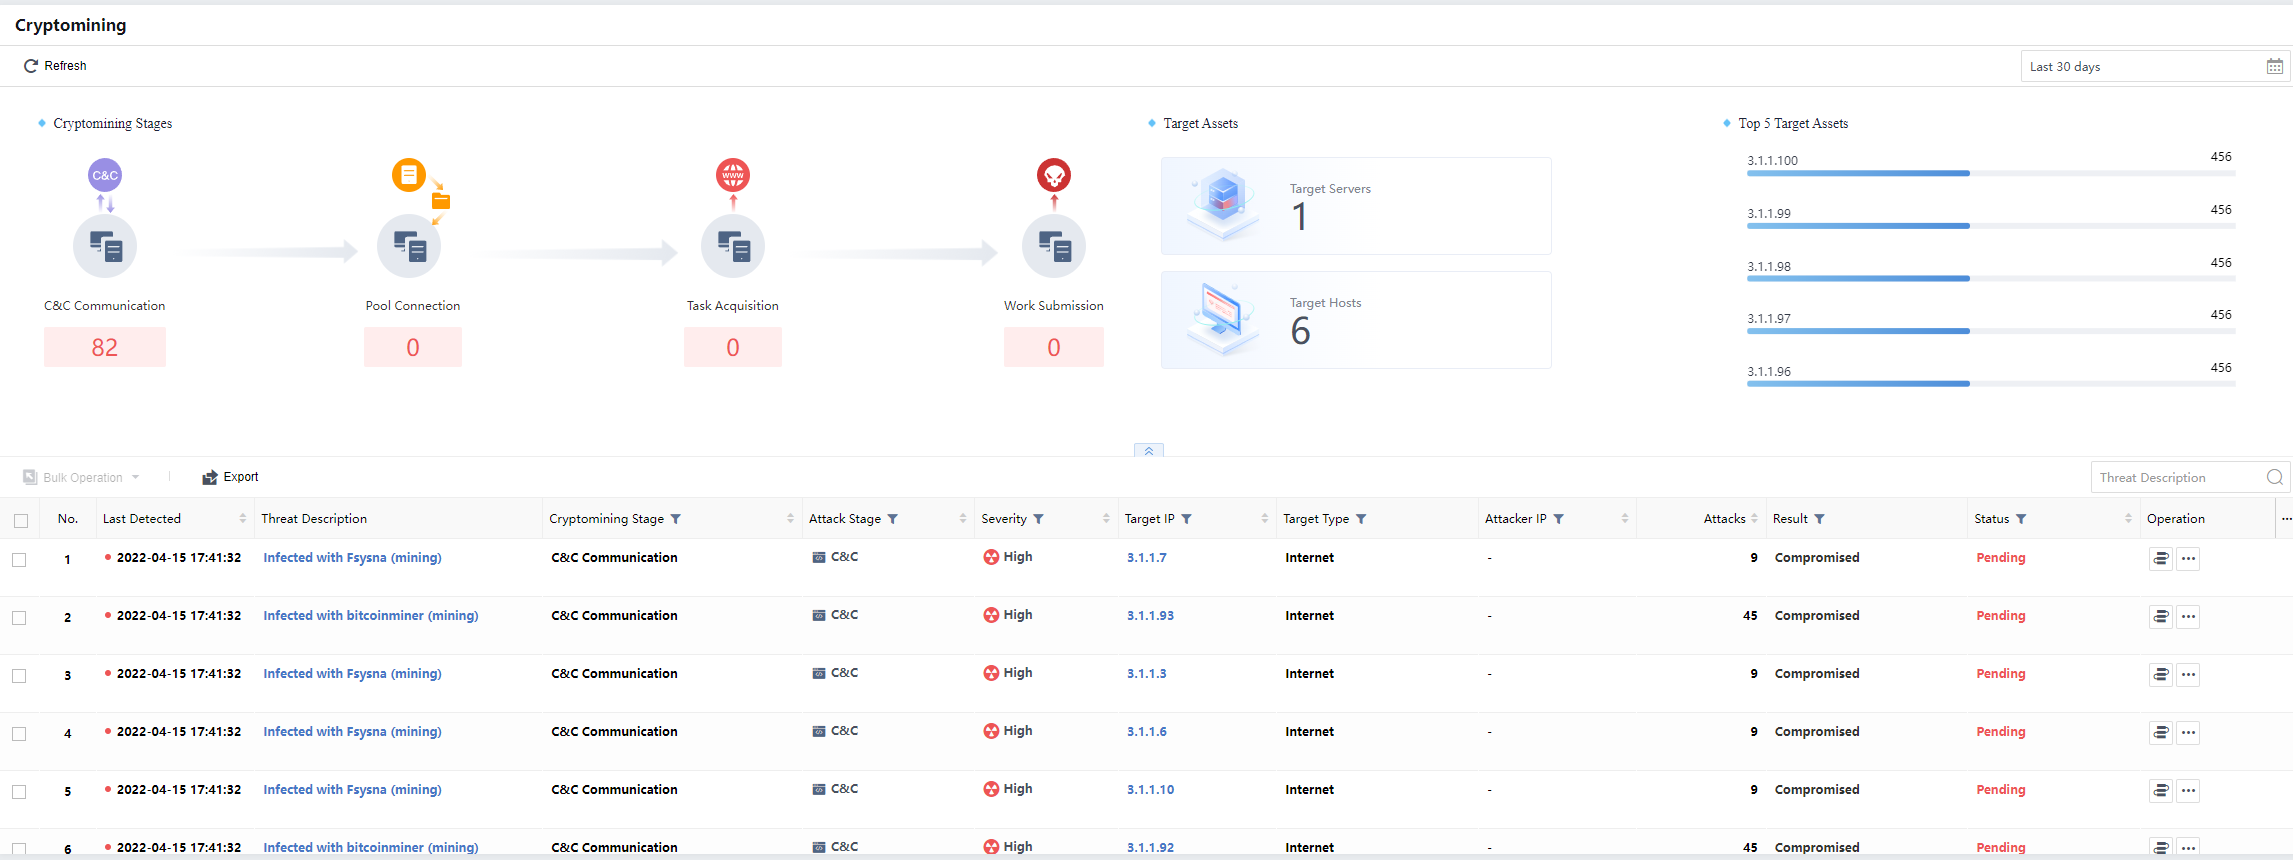
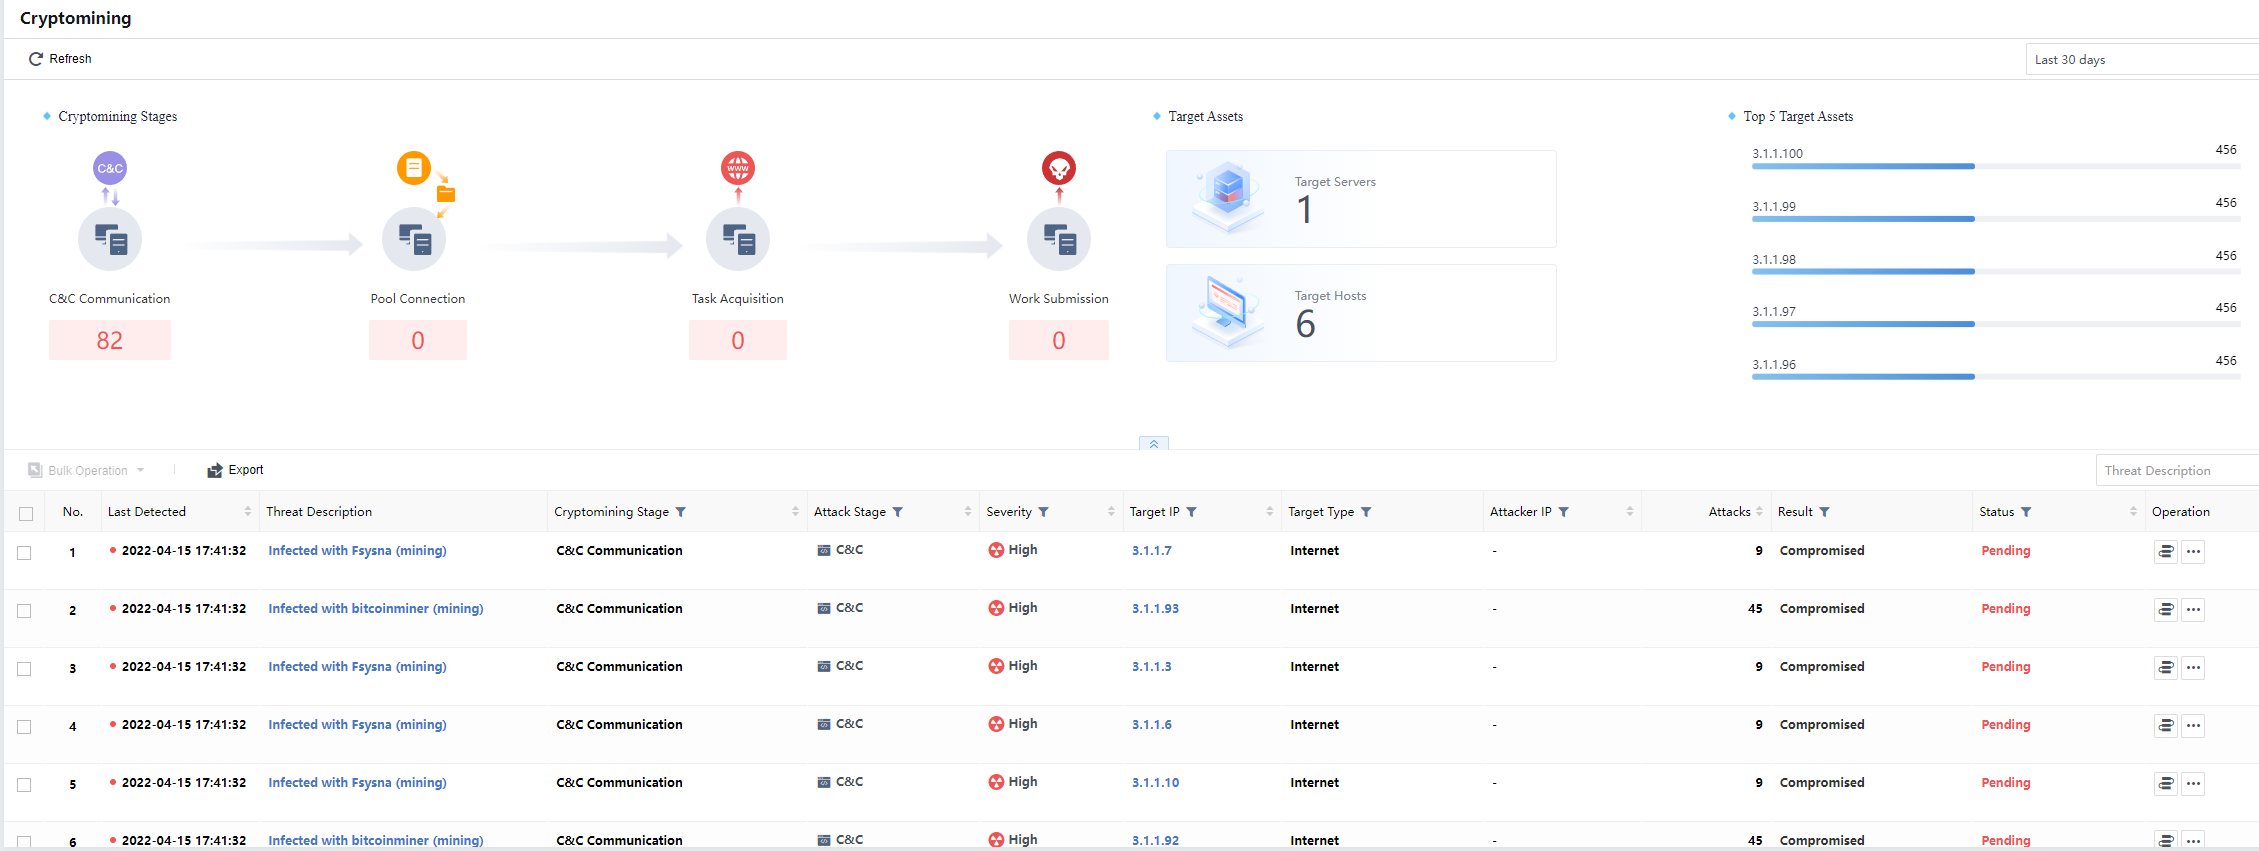
It displays the Cryptomining Stages,Target Assets, and Top 5 Target Assets, as shown below.
Click the listed Threat Description to redirect to the security knowledge base in the help document to view detailed instructions for mining and suggestions. Meanwhile, click the typical mining case shown on the right to view the case details.
Cryptomining Stages
Under the Cryptomining Stages, you can analyze and display the affected hosts at different stages. Mining includes C&C Communication, Pool Connection, Task Acquisition,and Work Submission, as shown below.
Distribution of Cryptomining (number of infected hosts)
You can analyze and display the infected hosts. You can view the number of infected hosts for each stage and the risk trend of the number of mining events per day, as shown below.
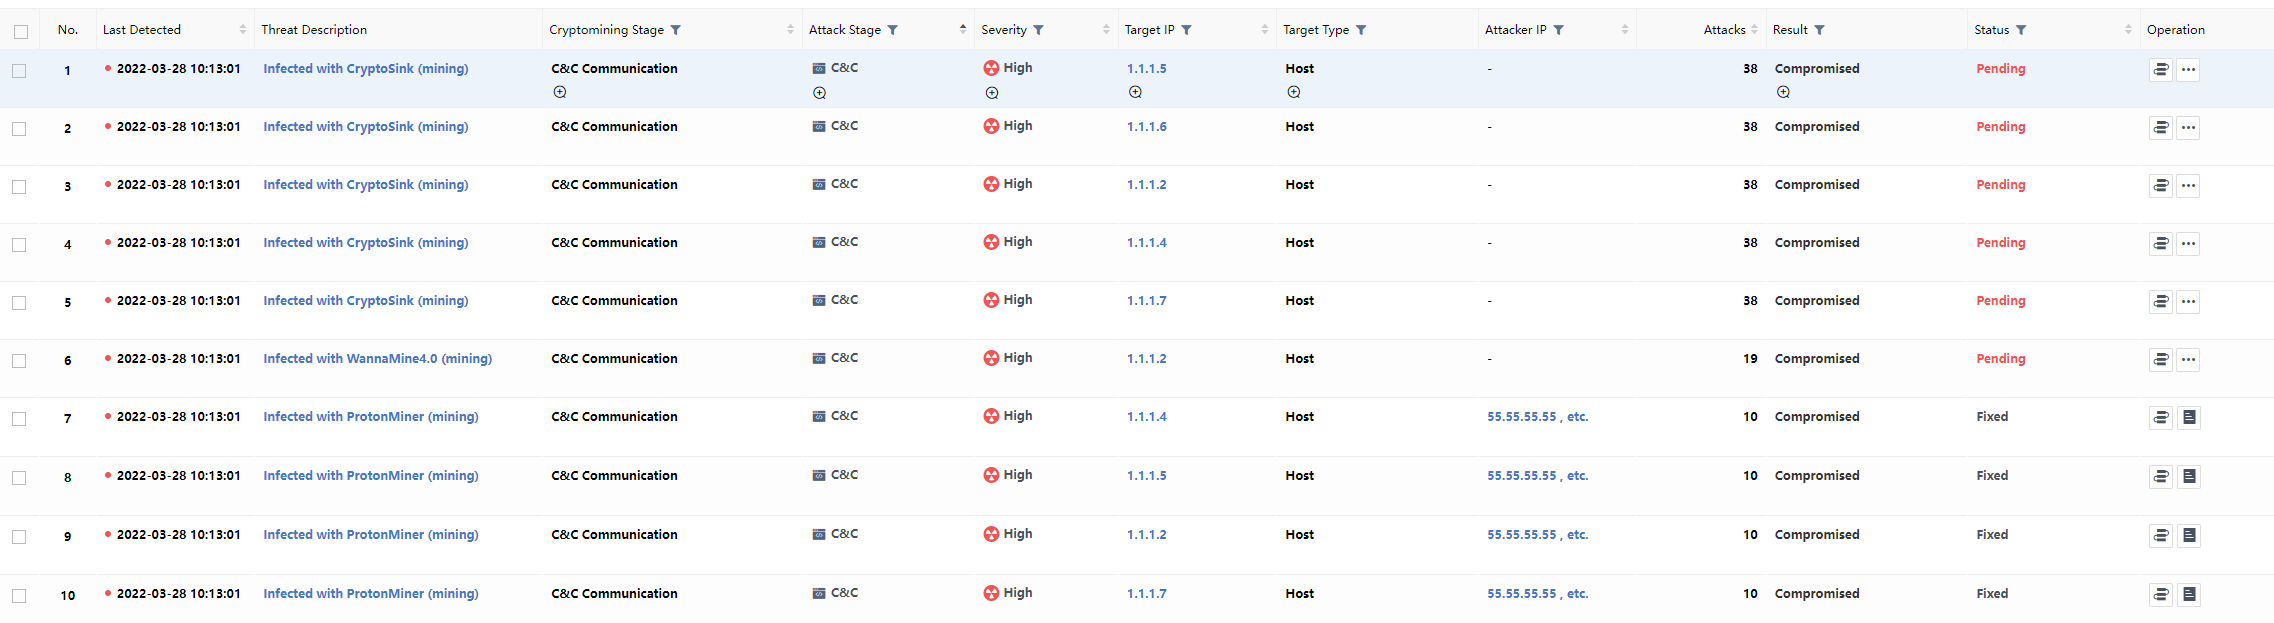
Target Hosts
You can click the Target Hosts to view the hosts currently affected by the mining virus. Click the IP address to view detailed Security Incidents information, and you can search through fields such as the mining stage. The page is shown in the figure below.
Mining Host Retrieval
You can search according to the mining stage and keywords fuzzy search. The mining stage includes C&C Communication,Pool Connection,Task Acquisition,Work Submission, etc., as shown in the figure below.
File Threats
The file threats intrude into LAN hosts by spreading virus files. After the malicious file is executed in a user’s host, it can control the host and disclose sensitive data. Thus, it is an important entry point in the attack chain.
You can view the statistics by selecting the Last 24 hours, Last 7 days, Last 14 days,Last 30 days, or Custom.
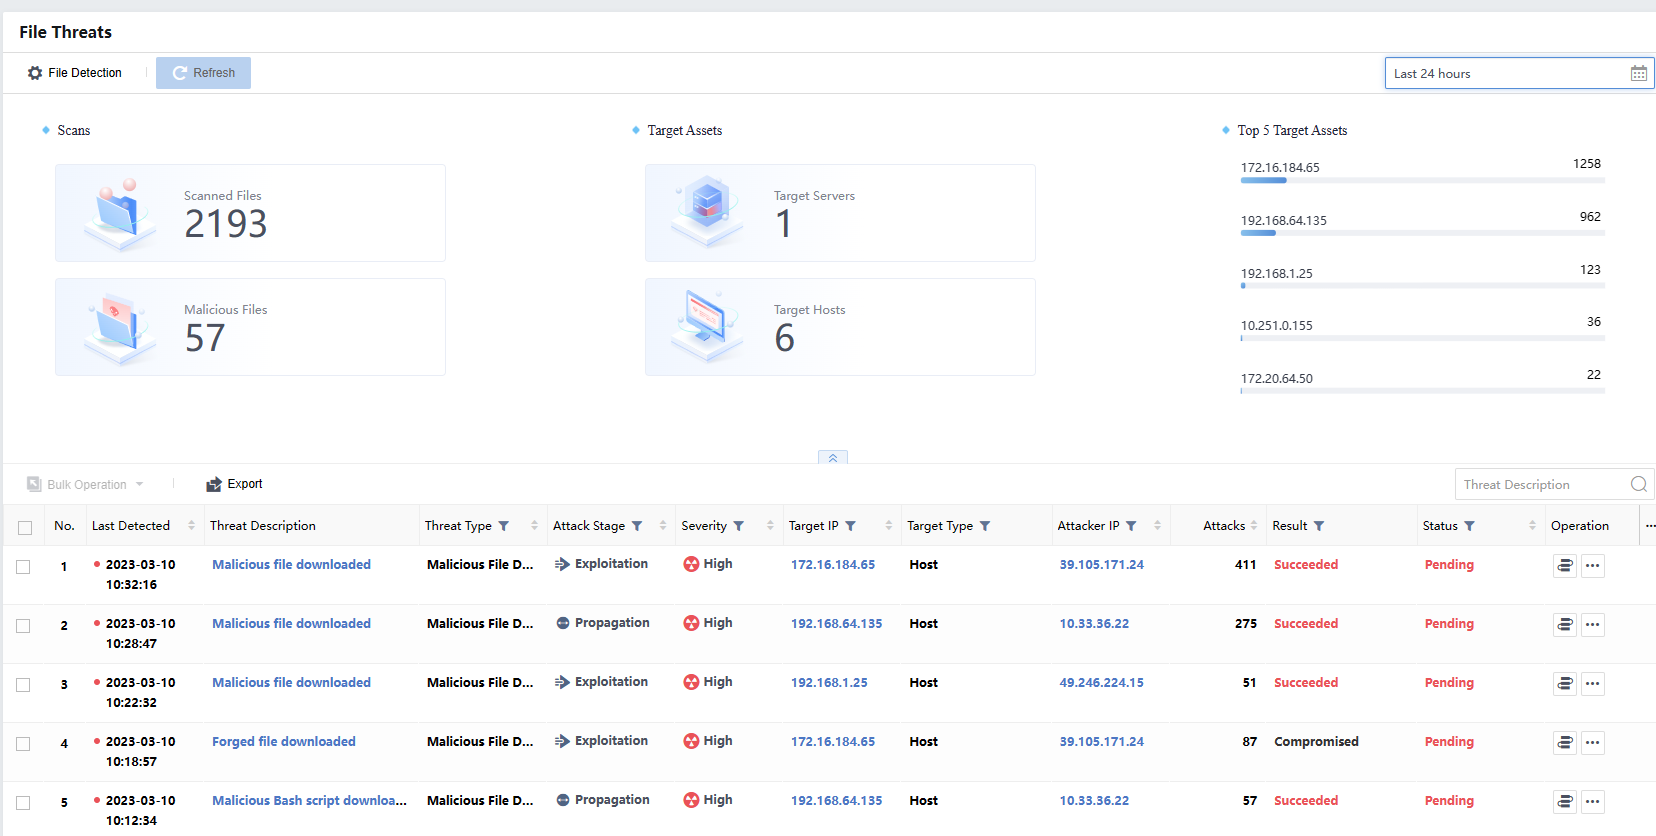
Click Export to export all file threats in Excel format, as shown below:
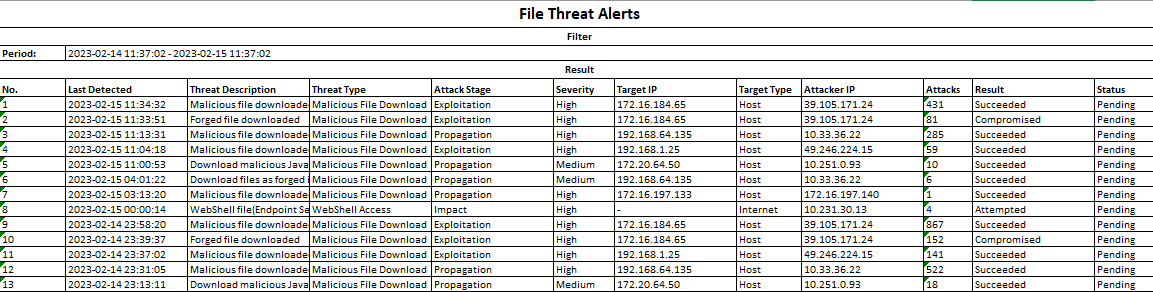
Last Detected: Refer to the recent time when the Cyber Command detected malicious emails.
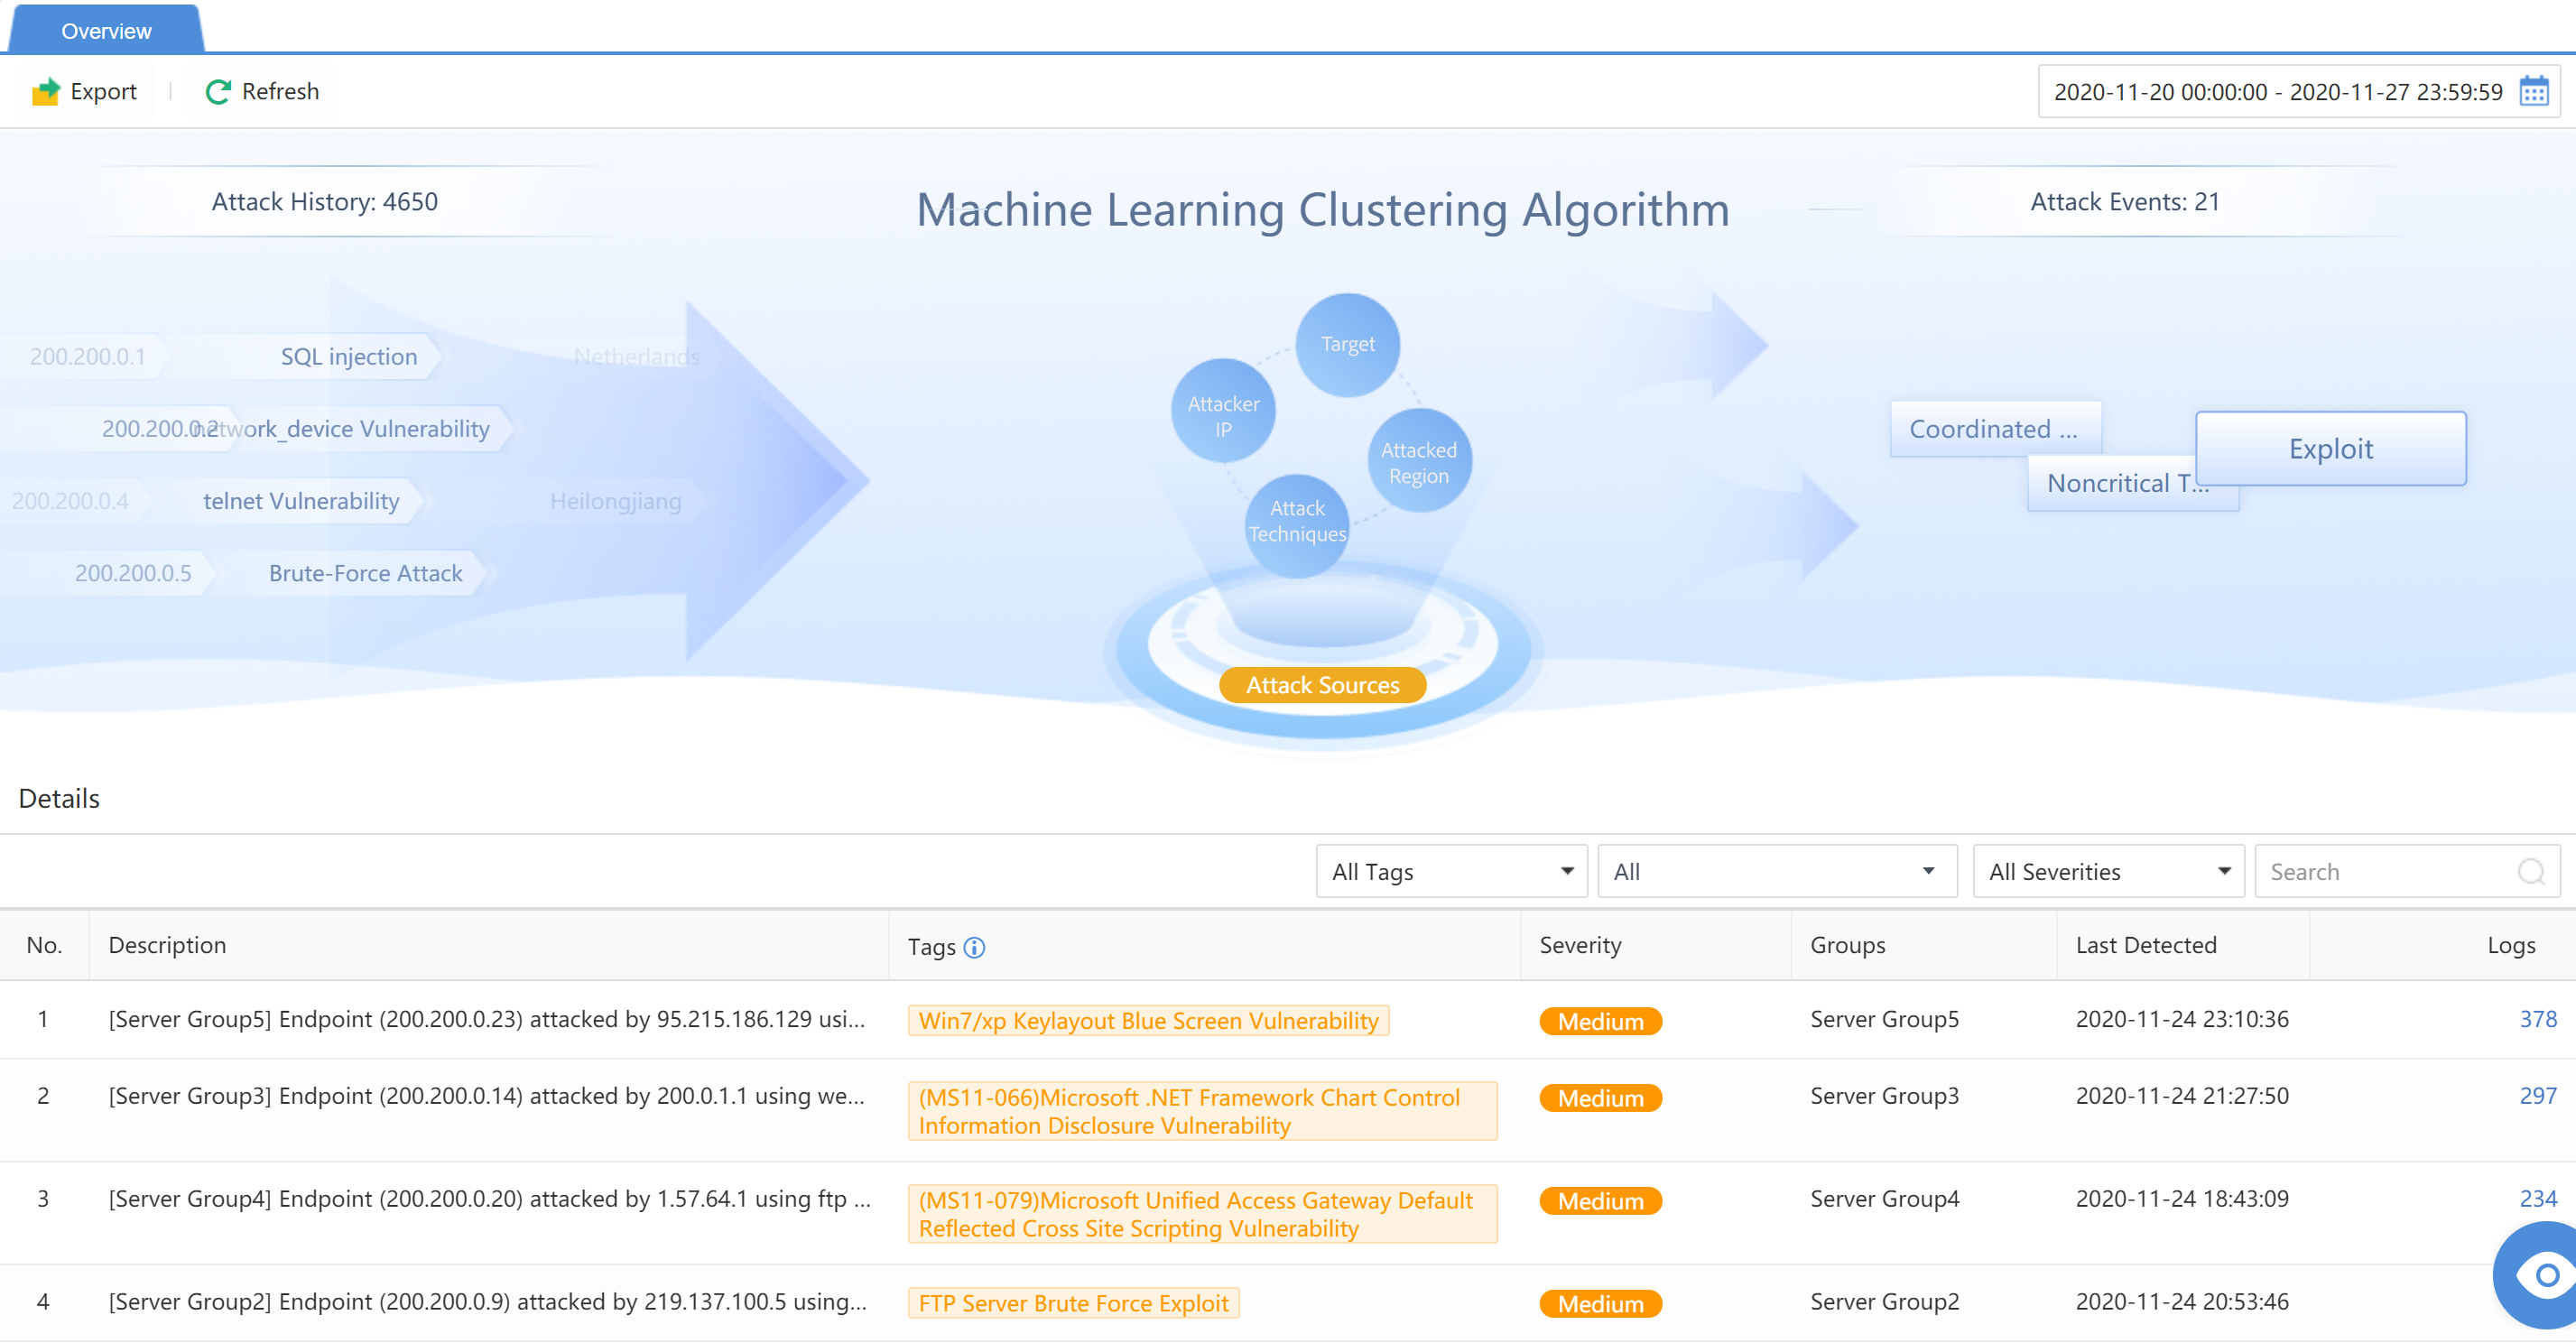
Inbound Attacks
Cyber Command can perform a Machine Learning Clustering Algorithm for attacks over some time to provide an overview of outbound attack clustering. As shown below:
Evasive Attack
Evasive attacks refer to attacks detected by STA deployed behind the defense system. Such attacks indicate that the defense capabilities of the corresponding devices need to be upgraded, or the defense policy has omissions and needs further reinforcement.
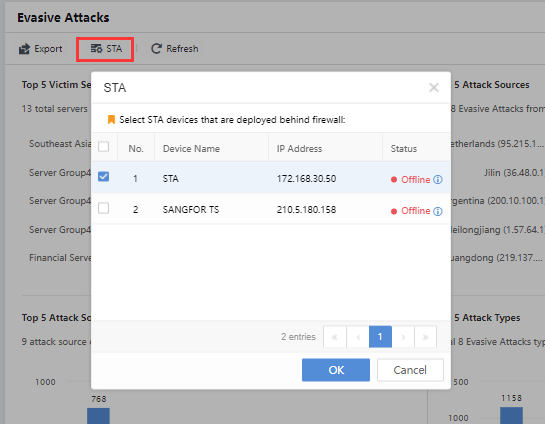
Definition of STA
To ensure accurate analysis of evasive attacks, it is necessary to manually define the probes deployed behind the firewall. When the STA detects the external network attack behavior, the attack behavior is an evasive attack. On the Detection>Threats>Evasive Attacks page, the administrator can click the Configure Now button to configure the STA behind the firewall.
.
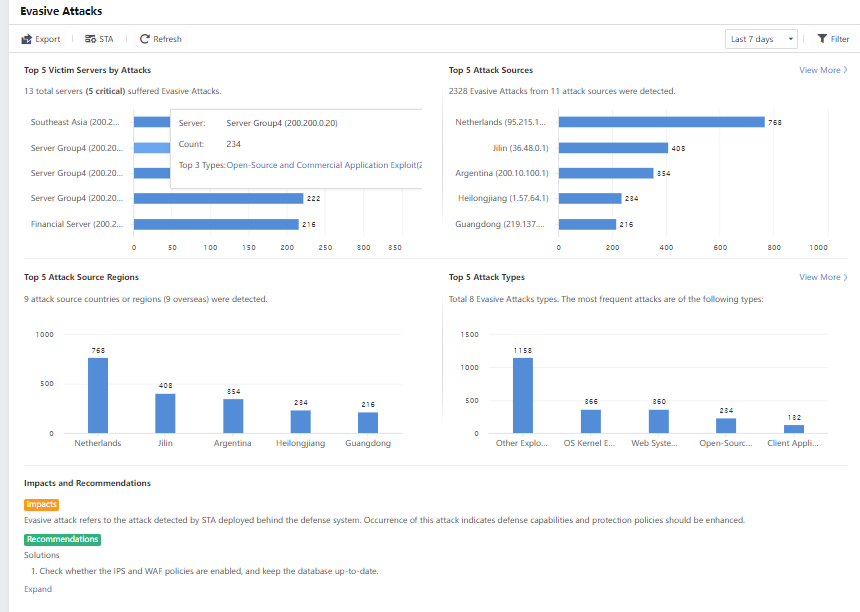
Overall Display
On the Detection>Threats>Evasive Attacks page, the administrator can view the following TOP 5 data:
Top 5 Target Servers by Attacks: The top five servers have suffered the most evasive attacks.
Top 5 Attack Sources: You can click View More to view all attack sources and export the data.
Top 5 Attack Source Regions: The top five countries or regions have launched the most attacks.
Top 5 Attack Types: You can click View More to view detailed information, such as the victim’s IP address corresponding to the attack type, and export the data.
You can also view the statistics based on the time range by selecting the last 7 days, Last 30 days, Last 24 hours, or Today. Meanwhile, you can click Filter to filter the Attacker Geolocation and Attack Type, as shown below:
Administrators can click Export at the upper left corner of the page to export all evasive attacks as an Excel sheet.
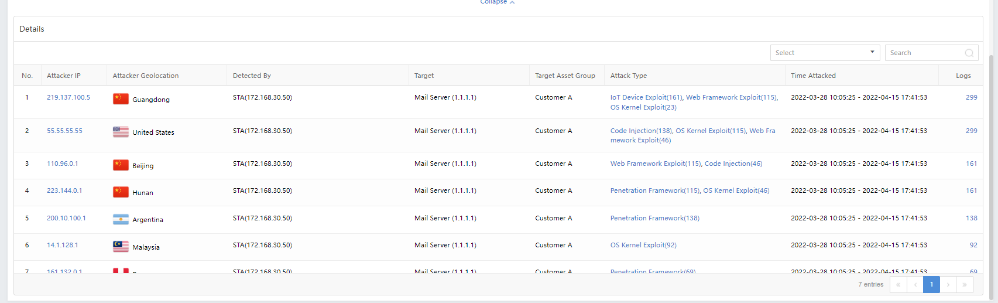
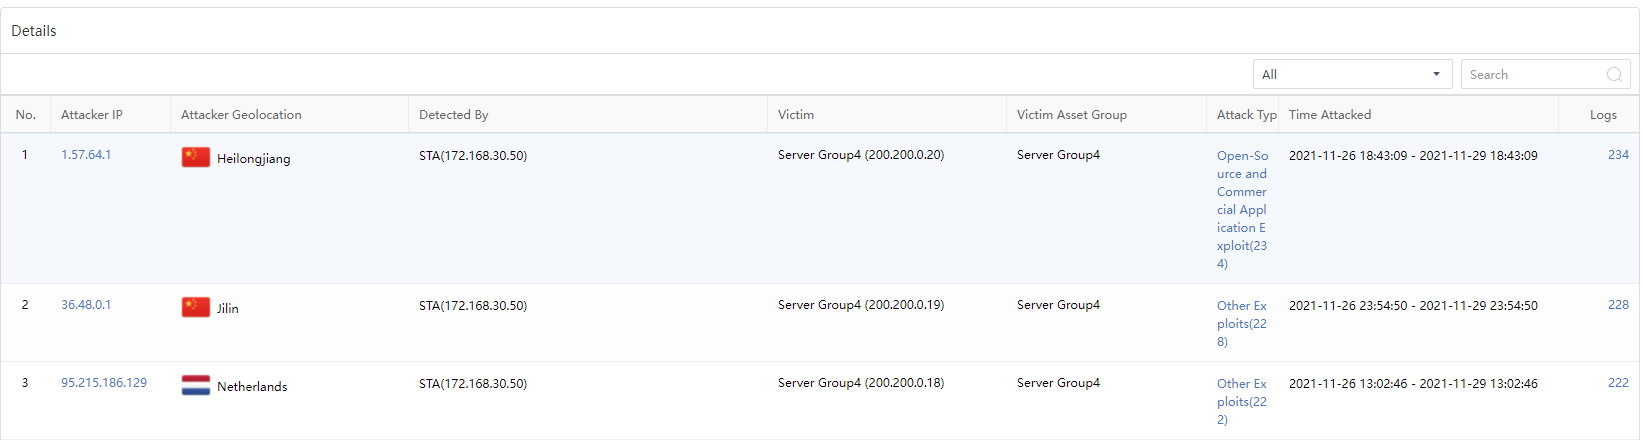
Detailed Analysis
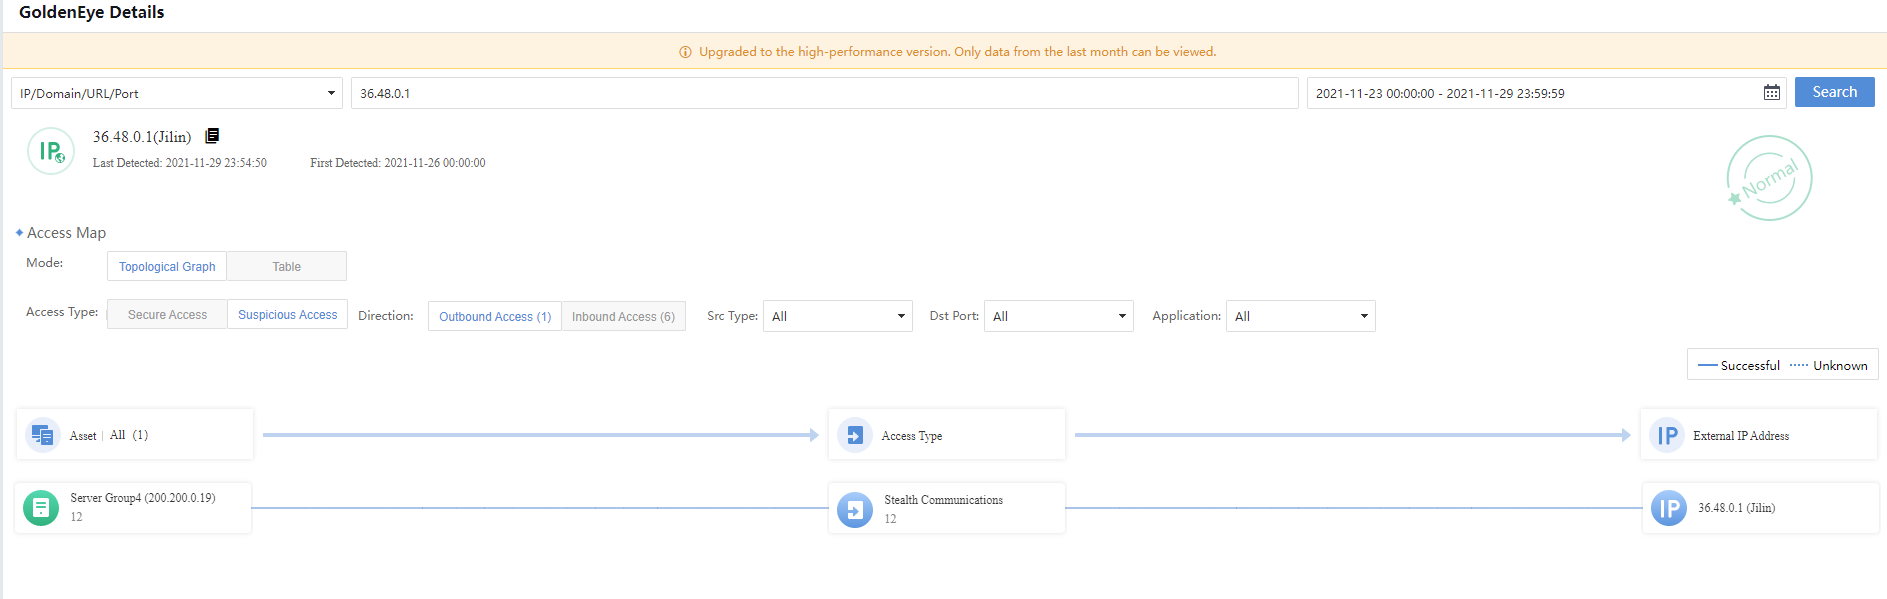
On the Detection>Threats>Evasive Attacks page, the administrator can view the attack details, including the Attacker IP,Attacker Geolocation,Detected By,Attack Type,Time Attacked, etc., as shown below.
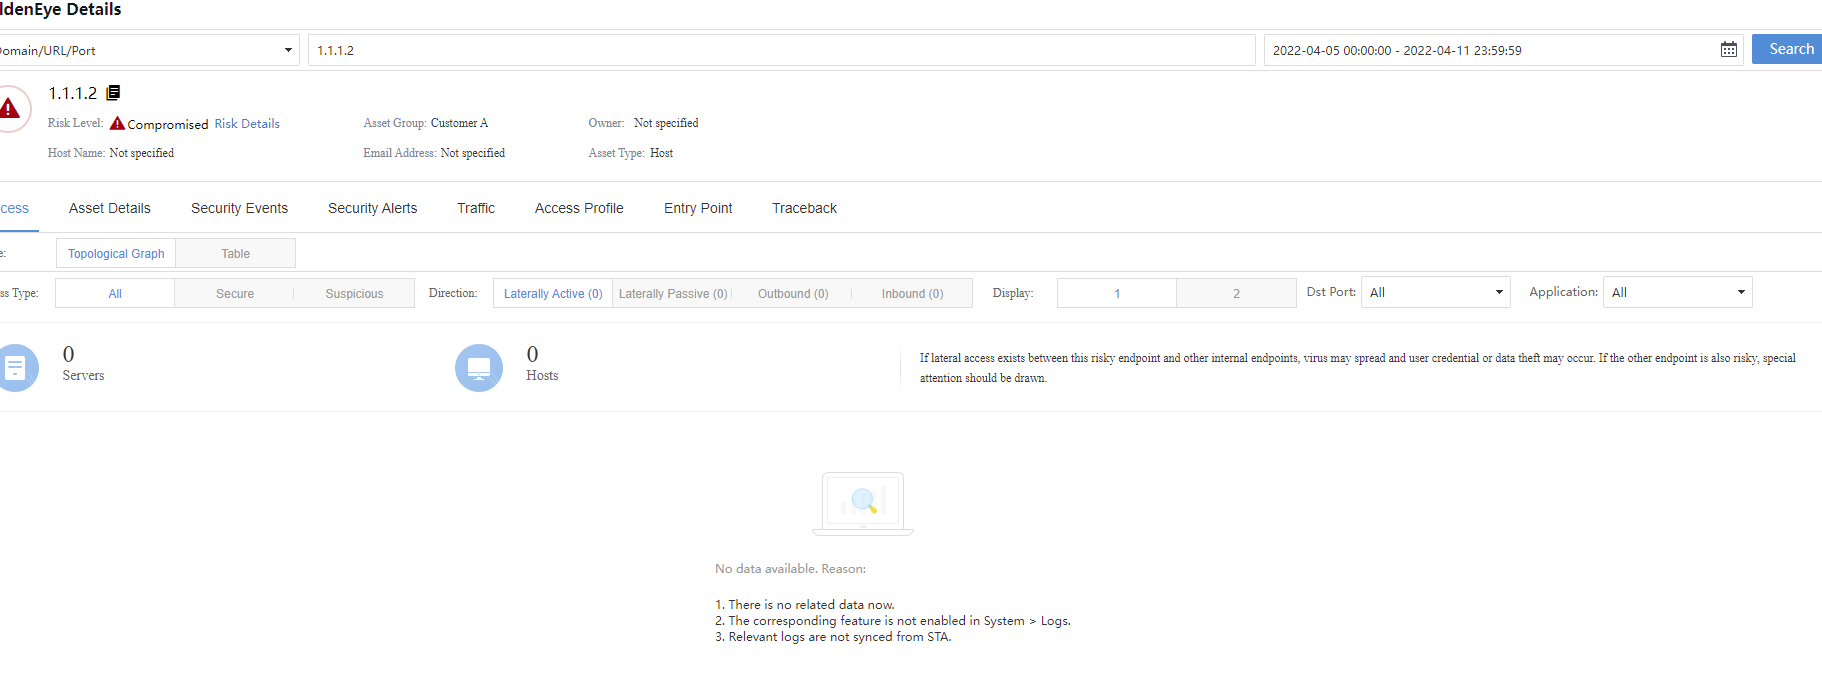
Click a specific Attacker IP to enter the GoldenEye Details page to view the risk of the IP, as shown in the figure below.
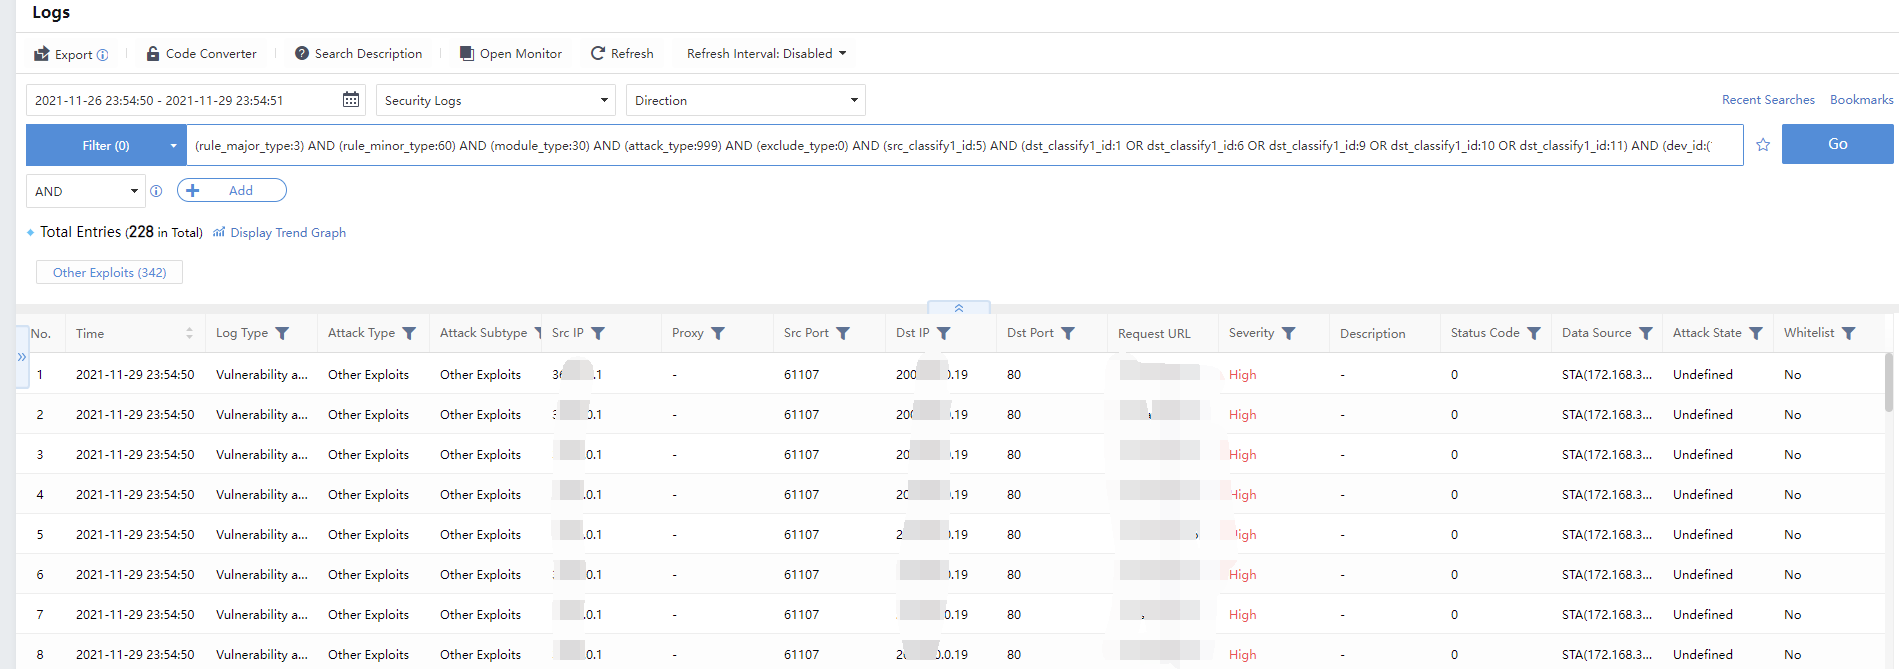
Clicking the Attack Type or the number of Logs will go to the Detection>Logs page to view the detailed log information of the attack type, as shown in the figure below.
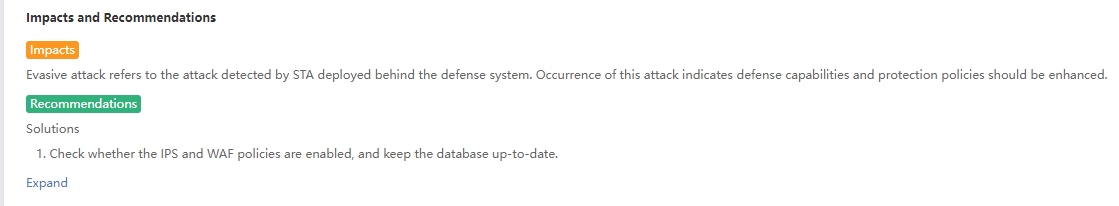
Impact and Response Advice
Under the Detection>Threats>Evasive Attacks page, the administrator can view the Impacts and Recommendations. You can click Expand to view the complete suggestions, as shown in the figure below.
Traffic
View the lateral access relationship of internal hosts and the external connection access relationship from the LAN host to the Internet.
Lateral Traffic
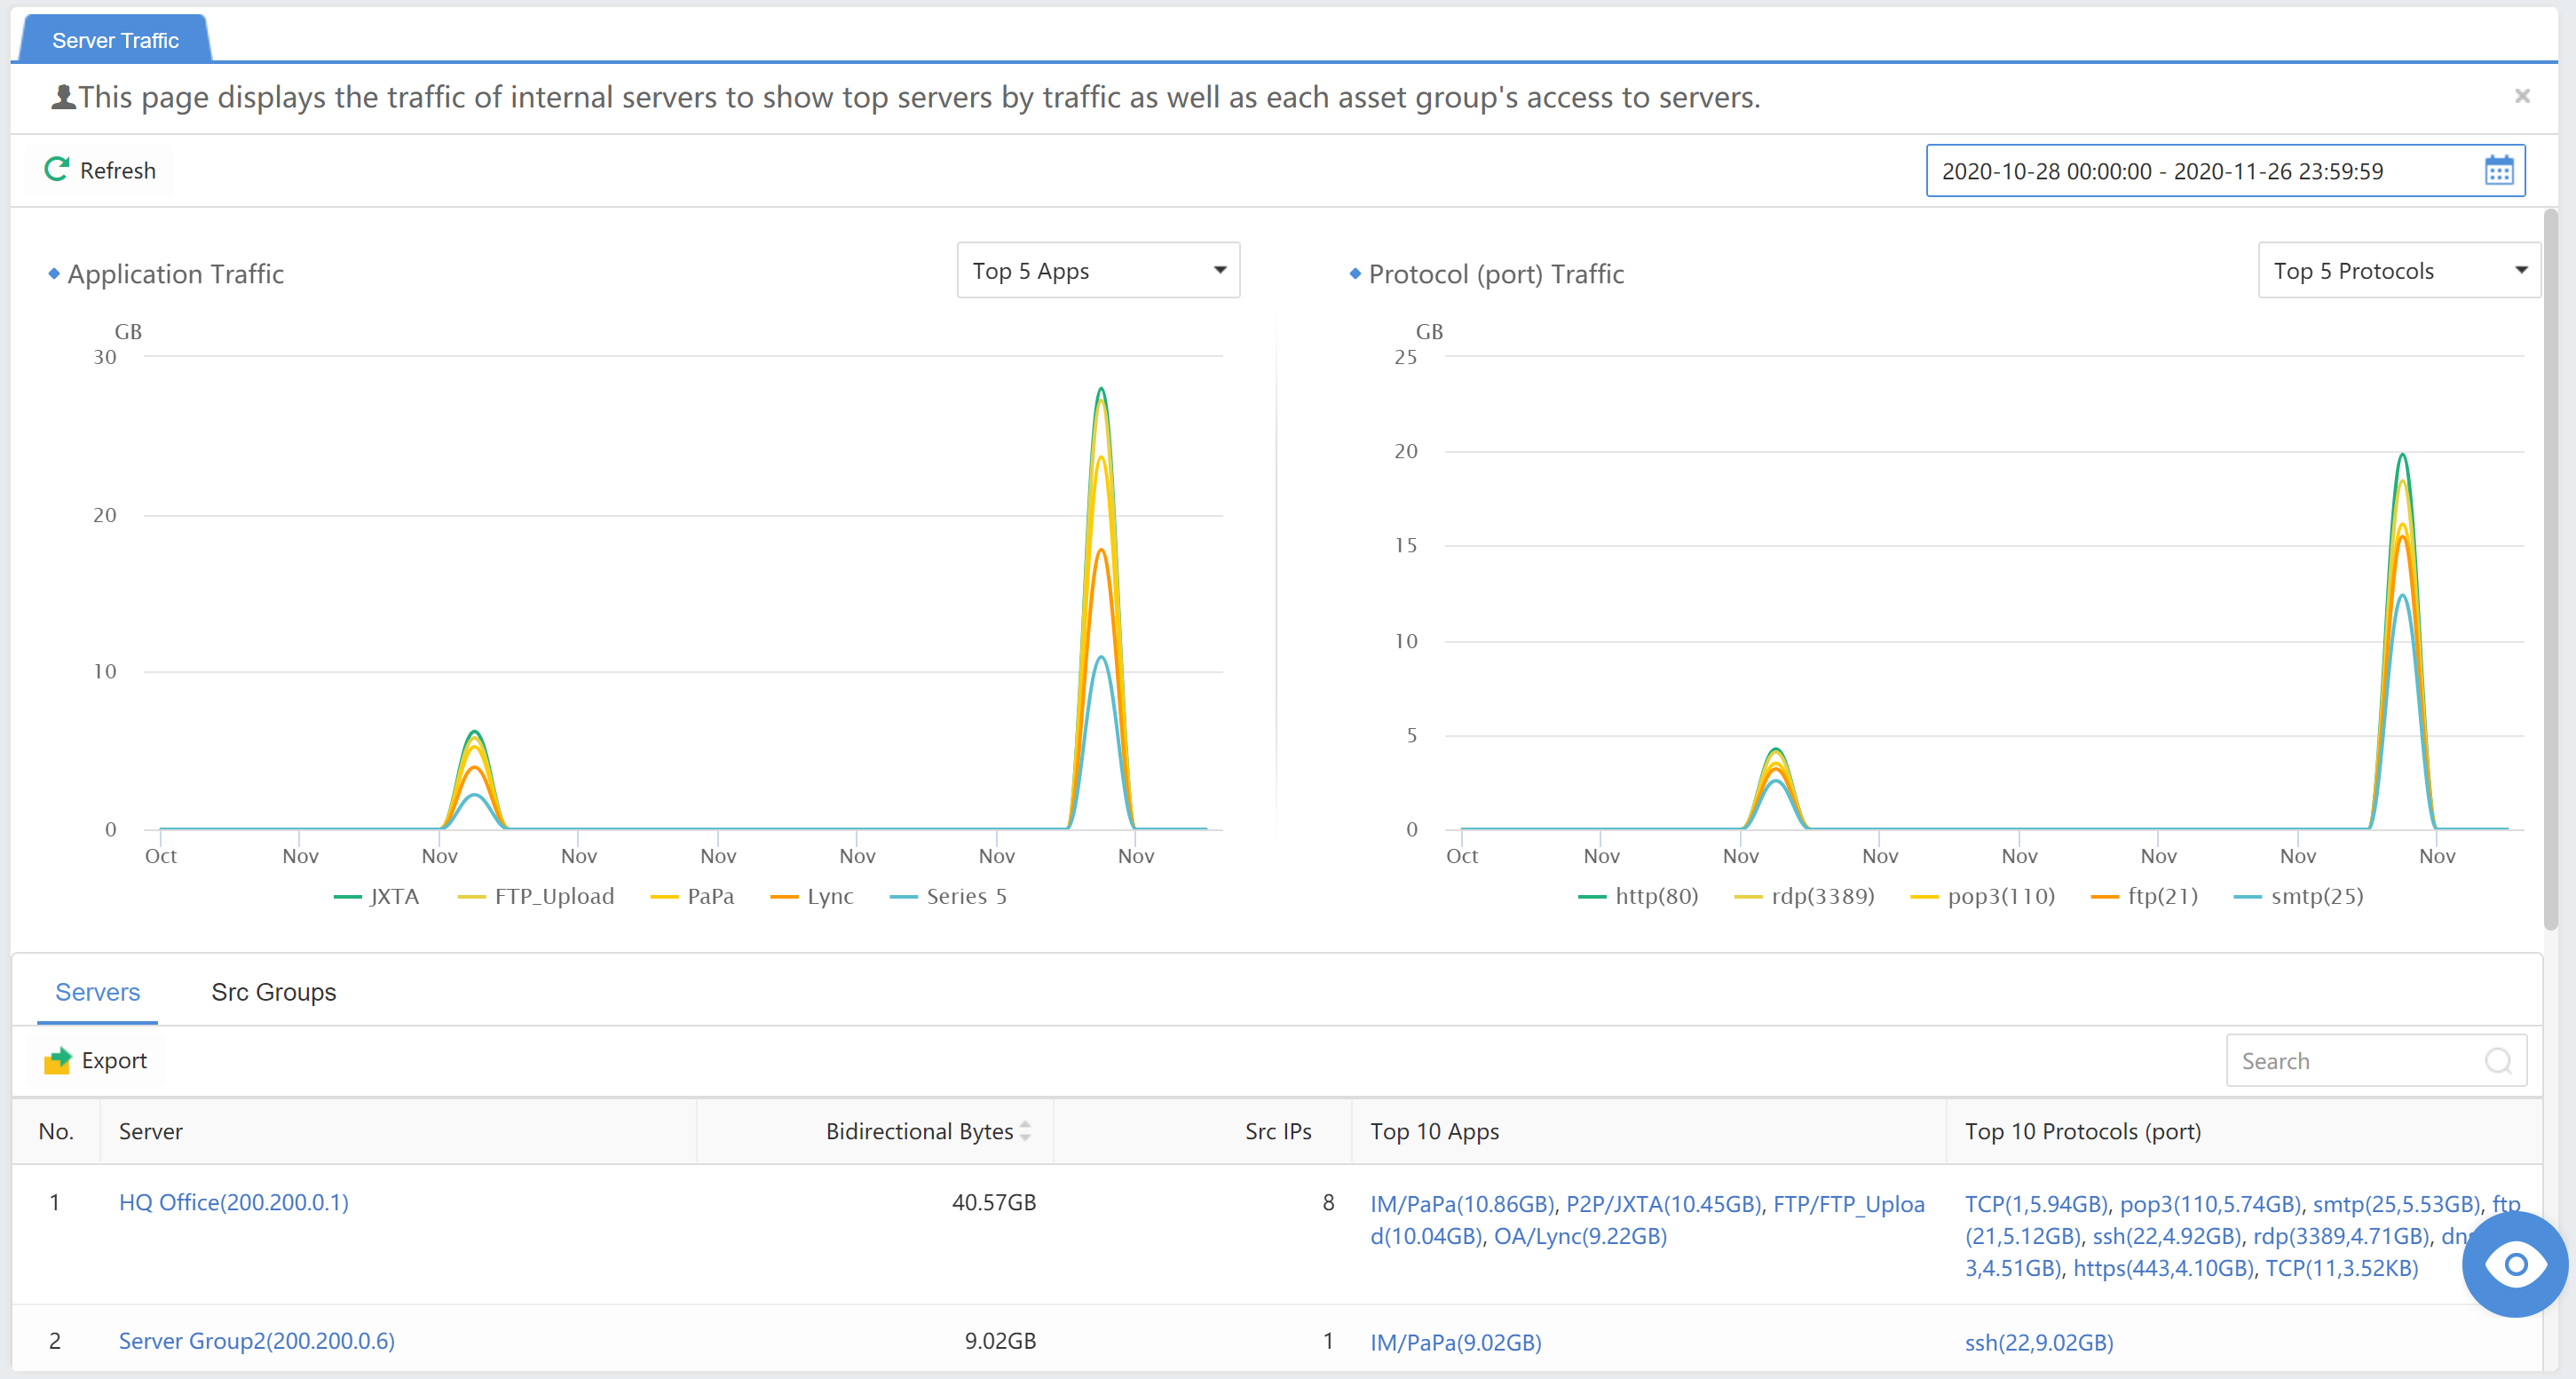
Navigate to Detection>Traffic>Lateral Traffic page. It displays the traffic of internal servers to show top servers by traffic and each asset group’s access to servers, including:
- The total number of servers and endpoints that initiated lateral threats and the total number of servers that suffered lateral attacks.
The Application Trafficand Protocol (port) Traffic.
You can view the statistics of a time range by selecting the last 24 hours,7 days,14 days,and 30 days, as shown below.
Outbound Traffic
Outbound access is an access relationship between the endpoint or server and the Internet. You can change the data time range for outbound access data by selecting the Last 24 hours or Last 7 days in the upper right corner.
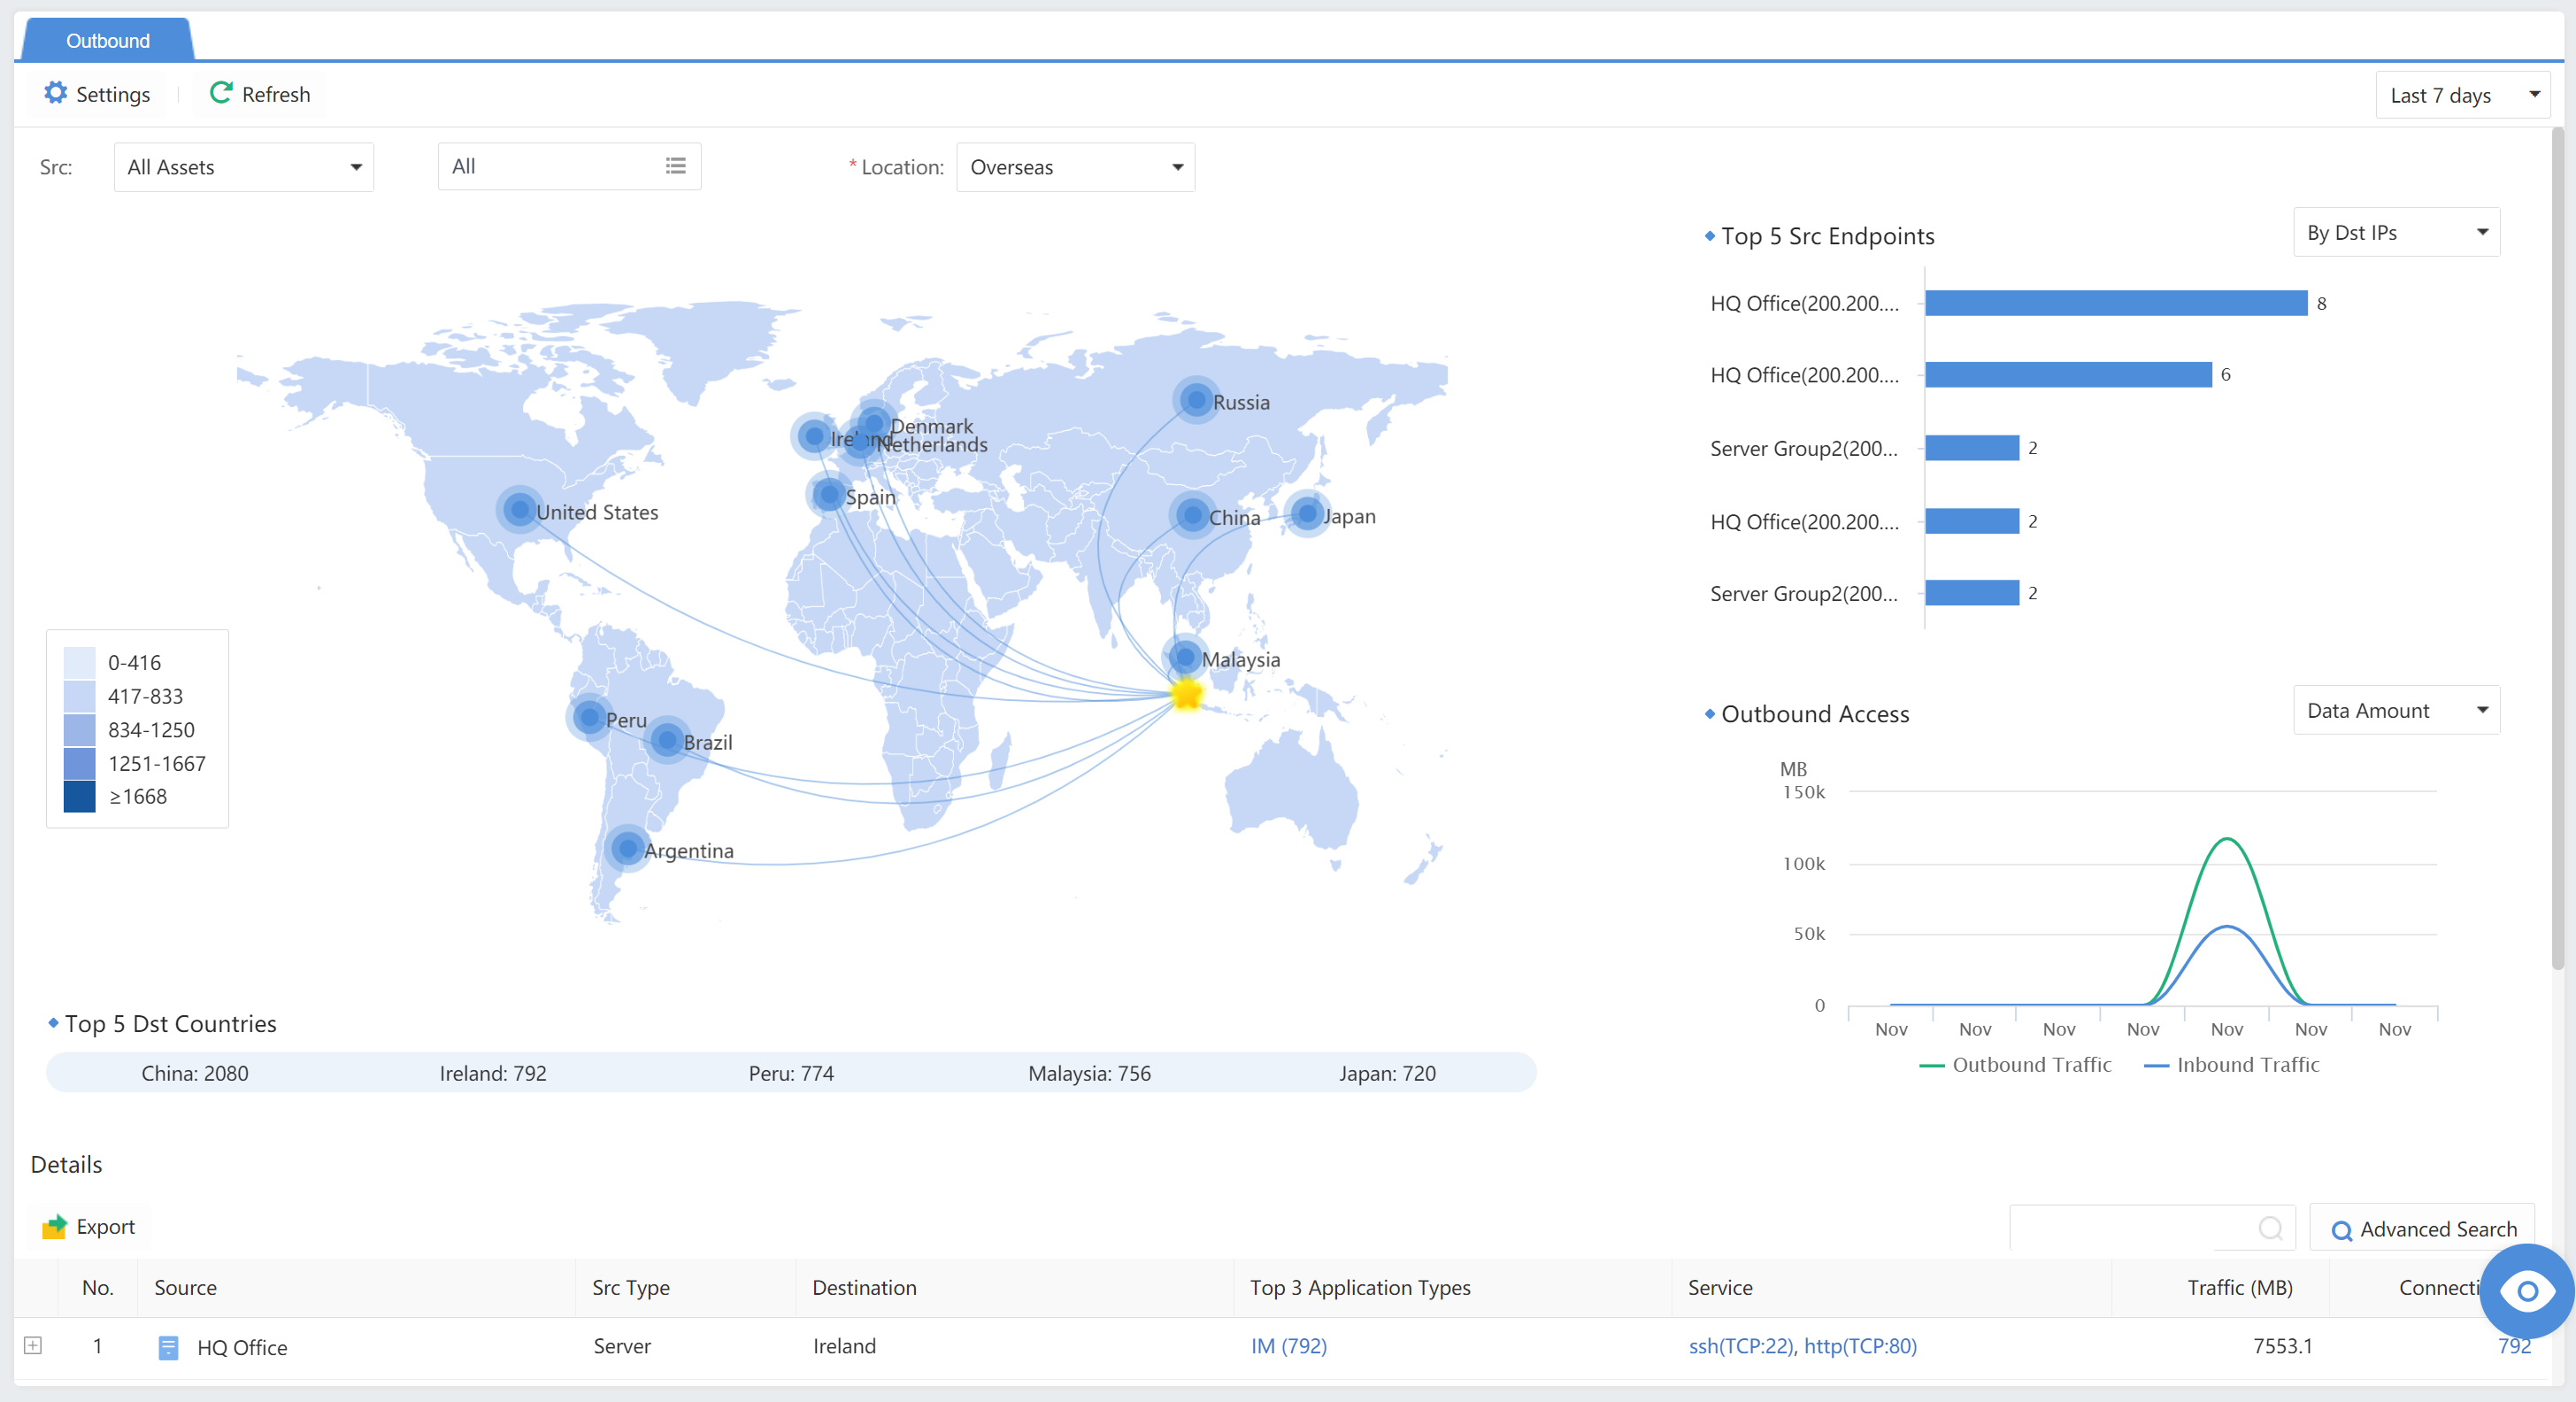
Click Settings to change the Asset location. Select one point on the map to represent the user’s location.
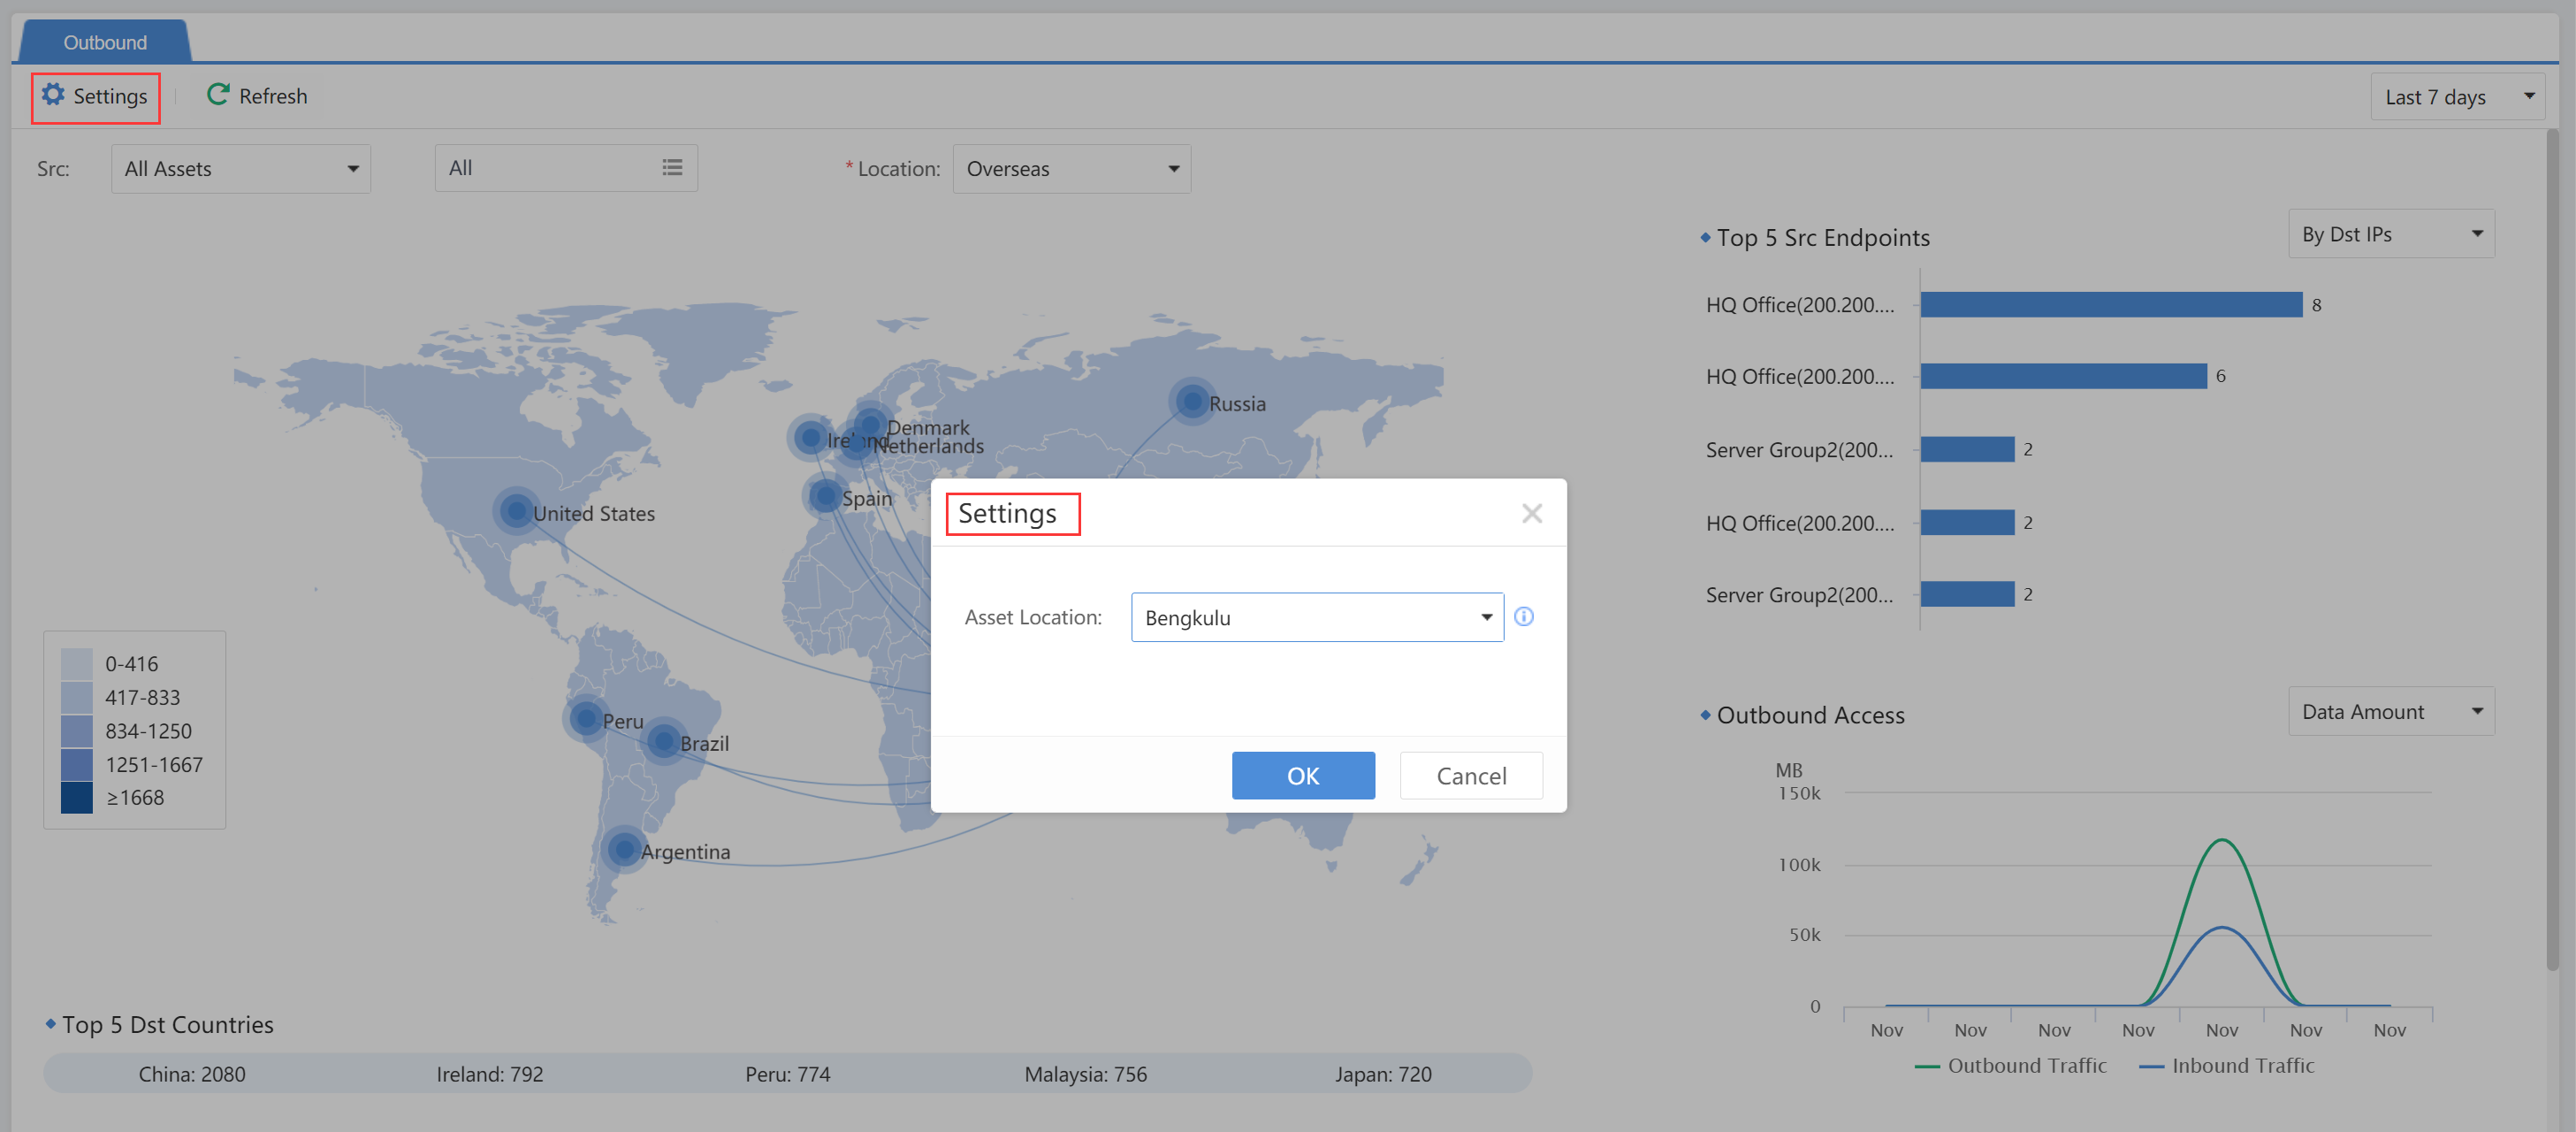
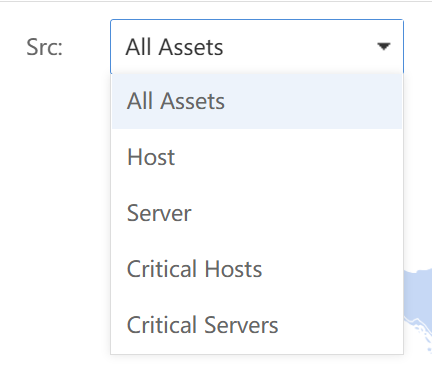
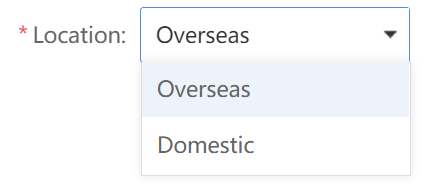
Select Src and Location(Domestic or Overseas) to view the outbound access situations.
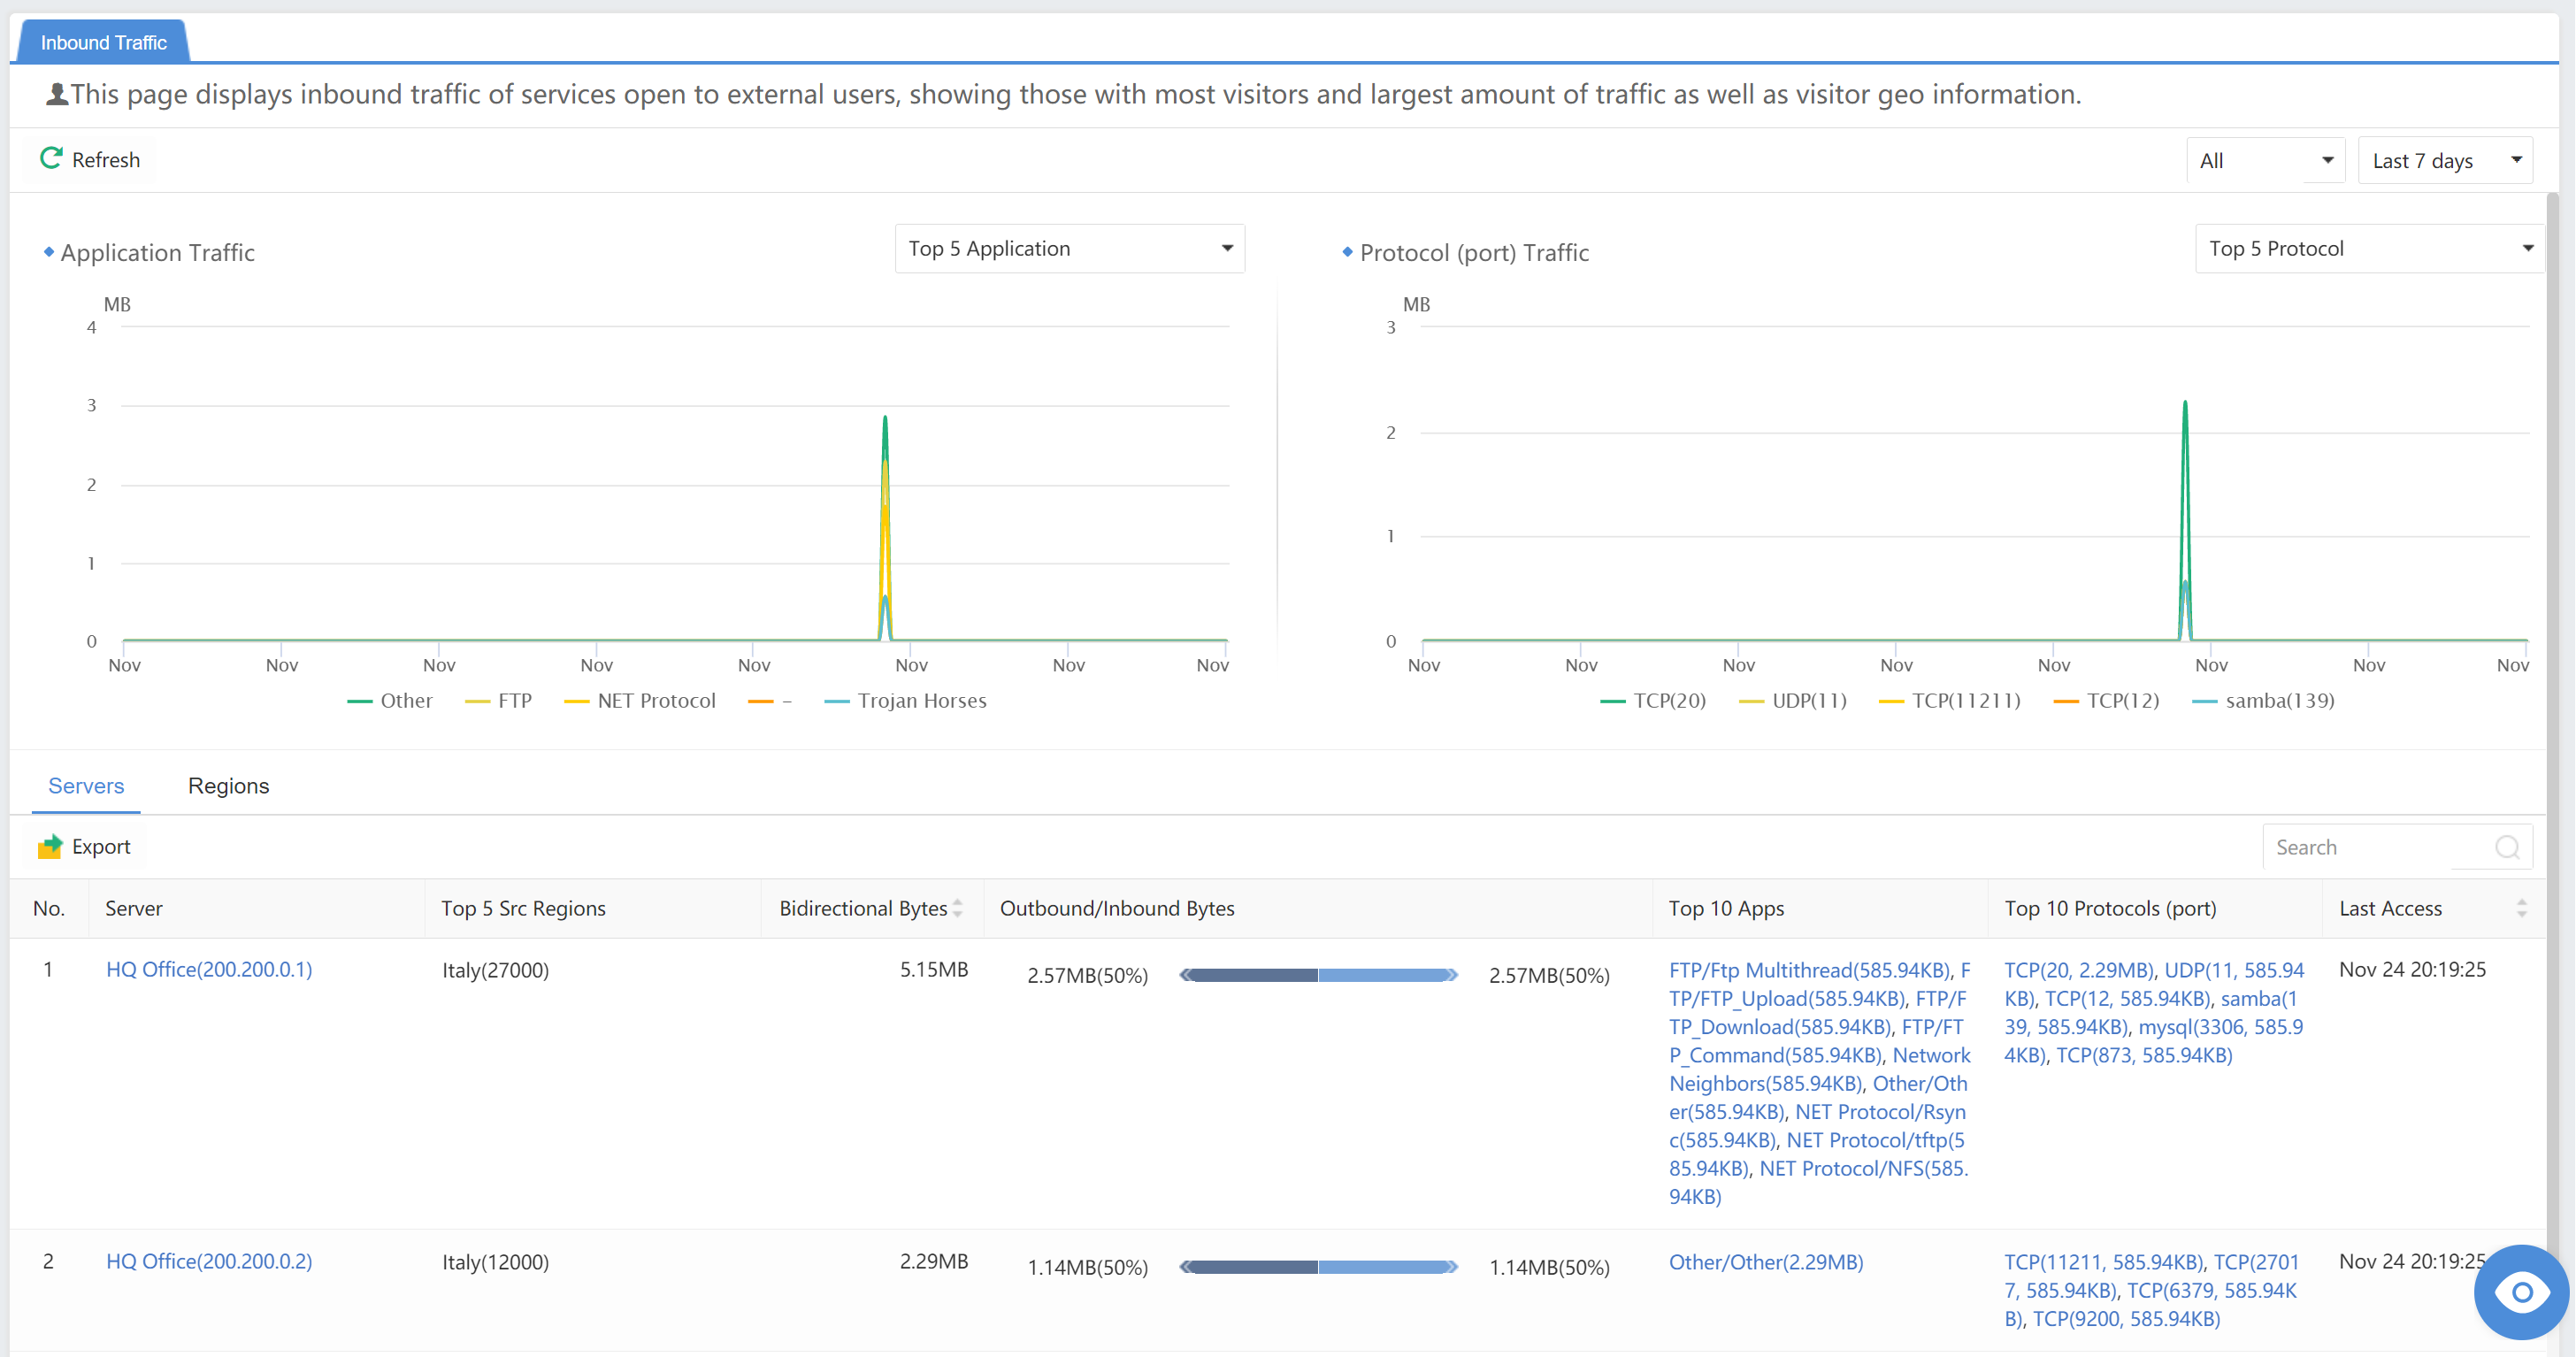
Inbound Traffic
This page displays inbound traffic of services open to external users, showing those with the most visitors and the largest amount of traffic and visitor geoinformation.
Anomalies
Abnormal behavior analysis is mainly based on access direction and includes submodules, such as Unauthorized Access, Lateral Access, and Outbound Server Access, etc.
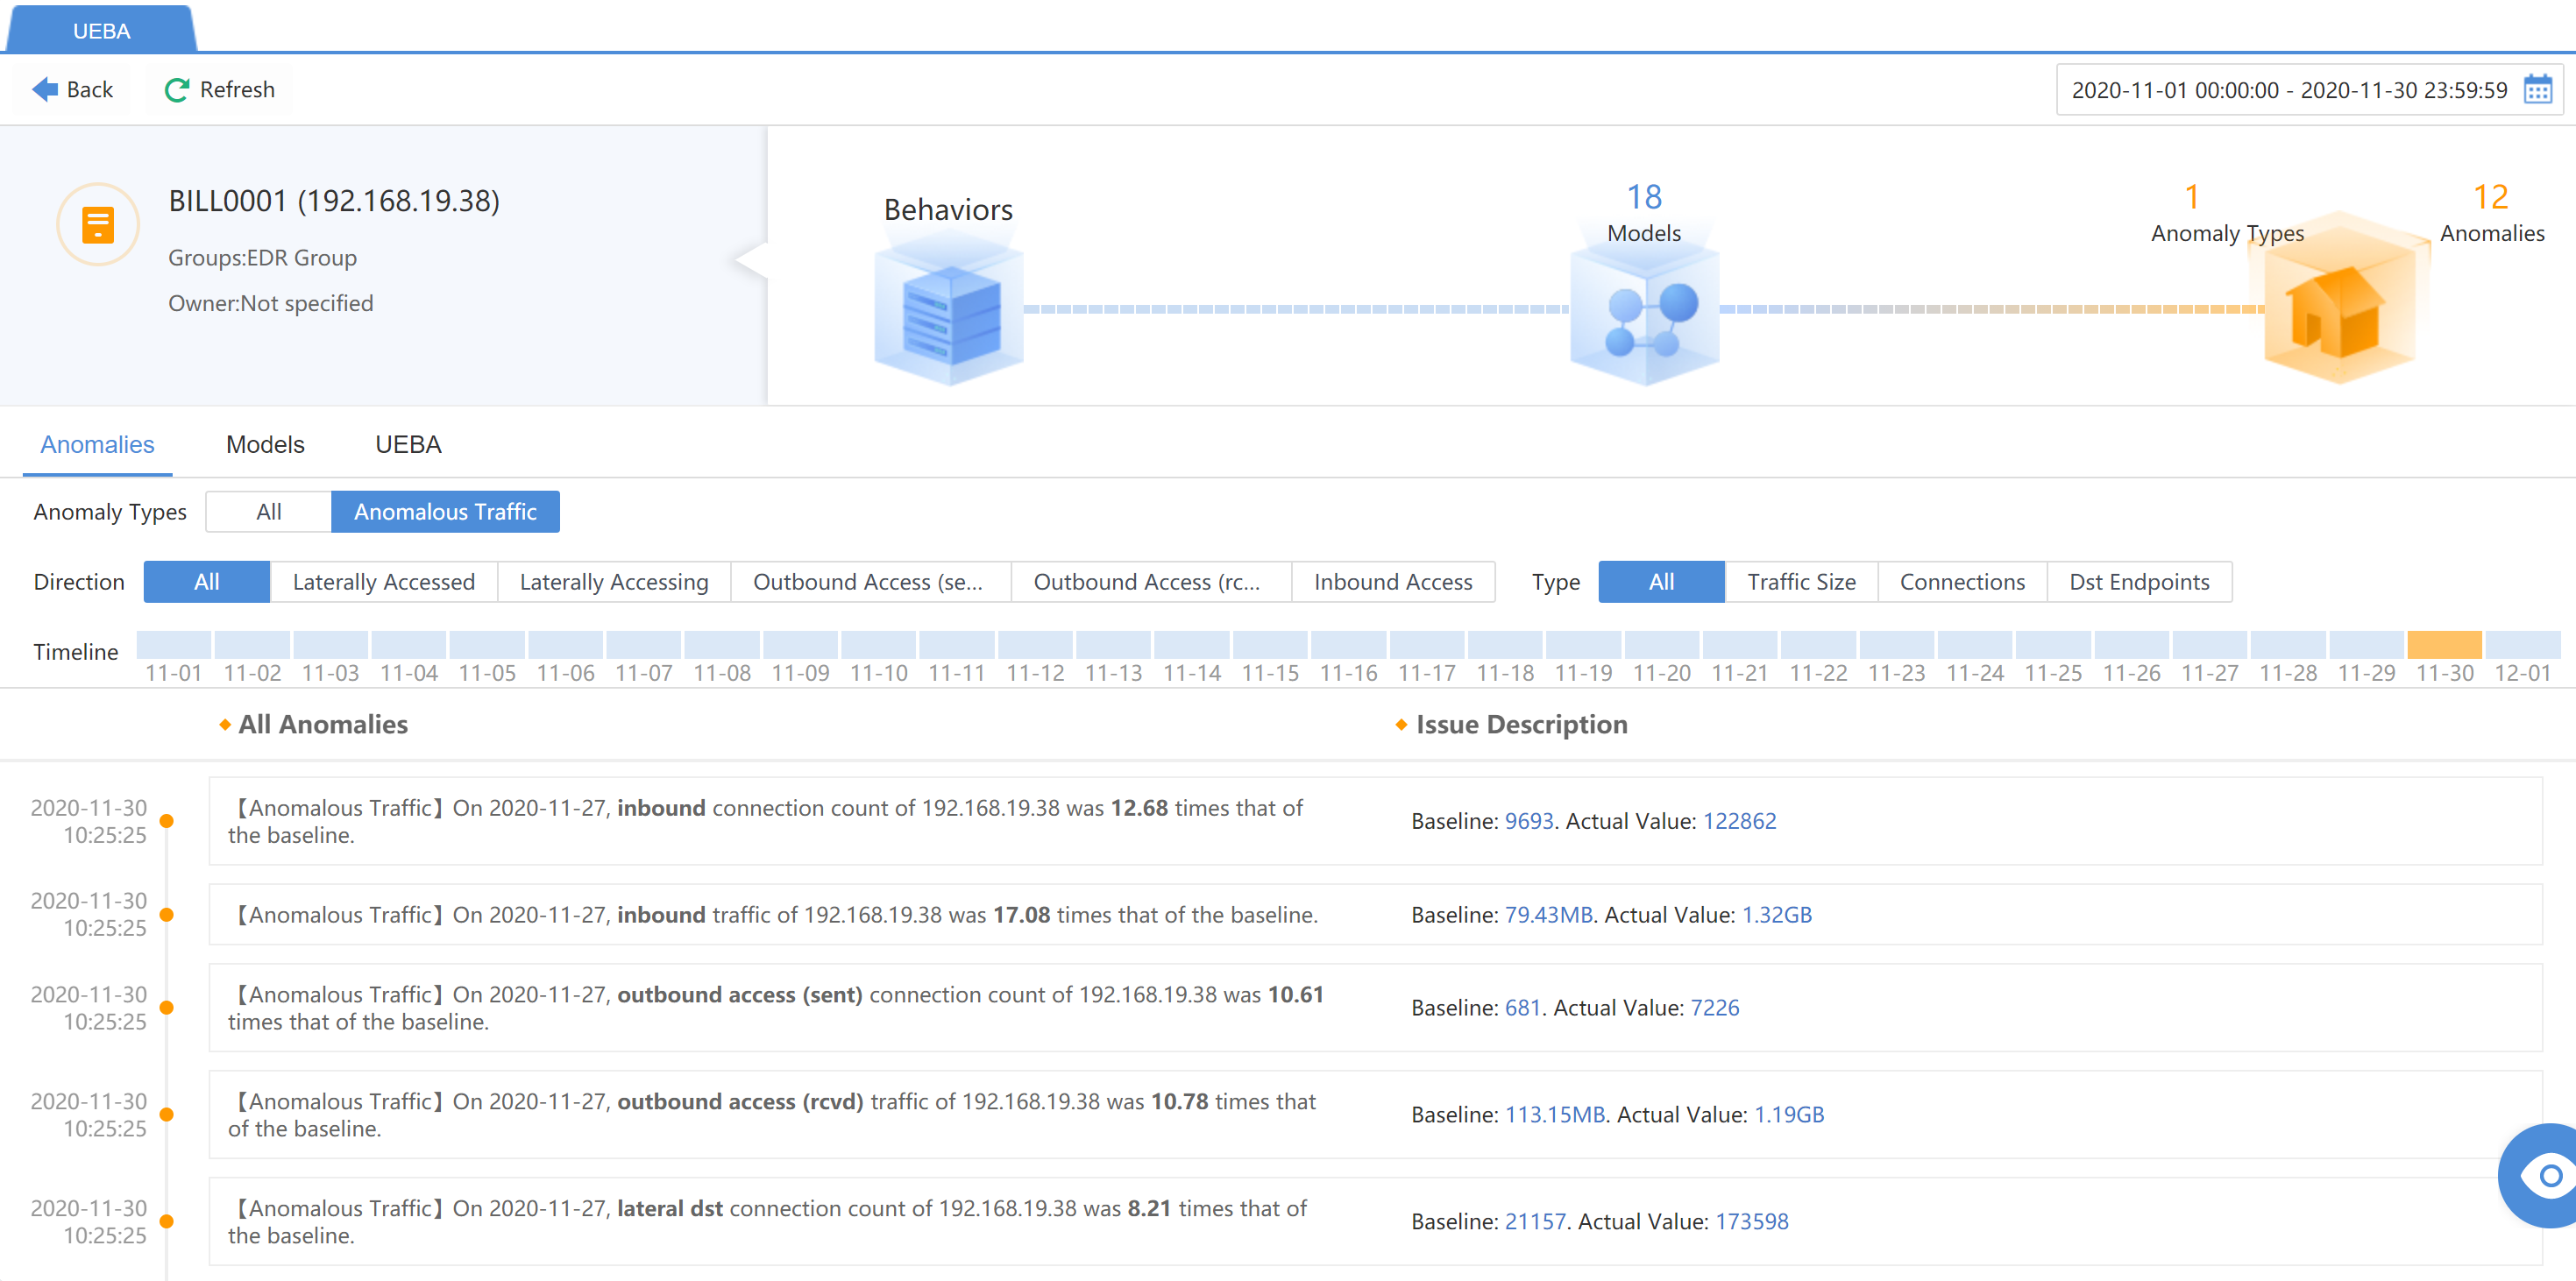
UEBA
The behavior analysis module can use the UEBA (User and Entity Behavior Analytics) engine to analyze the host (server/endpoint) operation’s abnormal behavior and display the behavior according to different risk scenarios. Under the UEBA page, the administrator can overview the number of days of continuous behavior study, risk scenarios/abnormal hosts/abnormal behaviors, and further view different anomaly types.
It requires a minimum of 96G memory to display this UEBA module.
Overview
The administrator can search for abnormal behaviors according to the Time Range or IP Address.
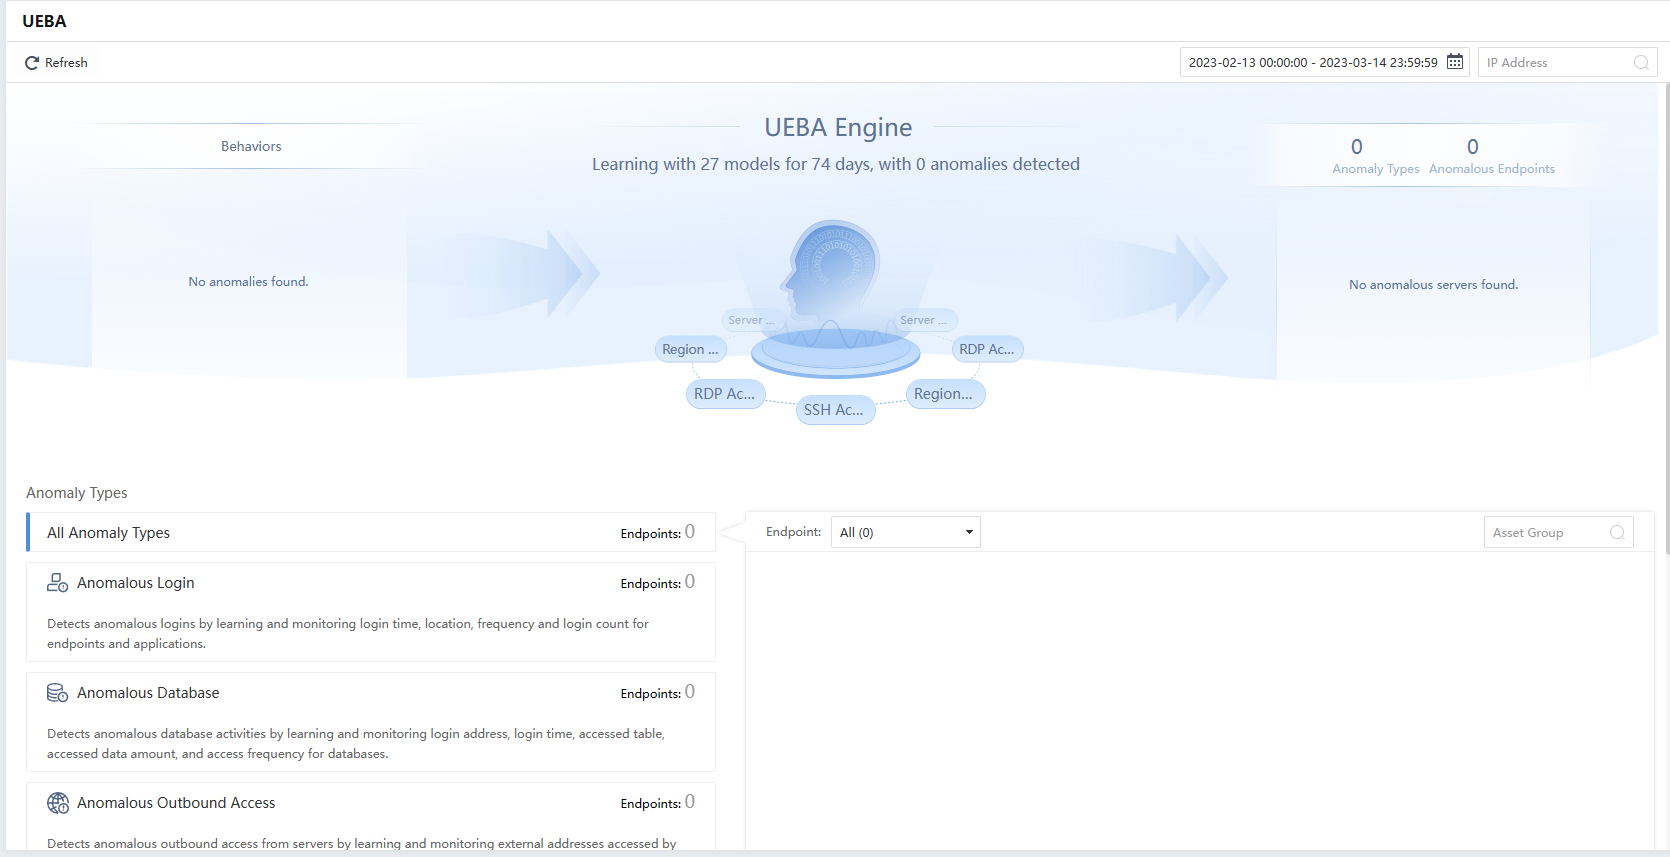
- All Anomaly Types
All anomaly types includeAnomalous Login,Anomalous Database,Anomalous Outbound Access,Anomalous Outbound Data,Anomalous Access, andAnomalous Traffic.
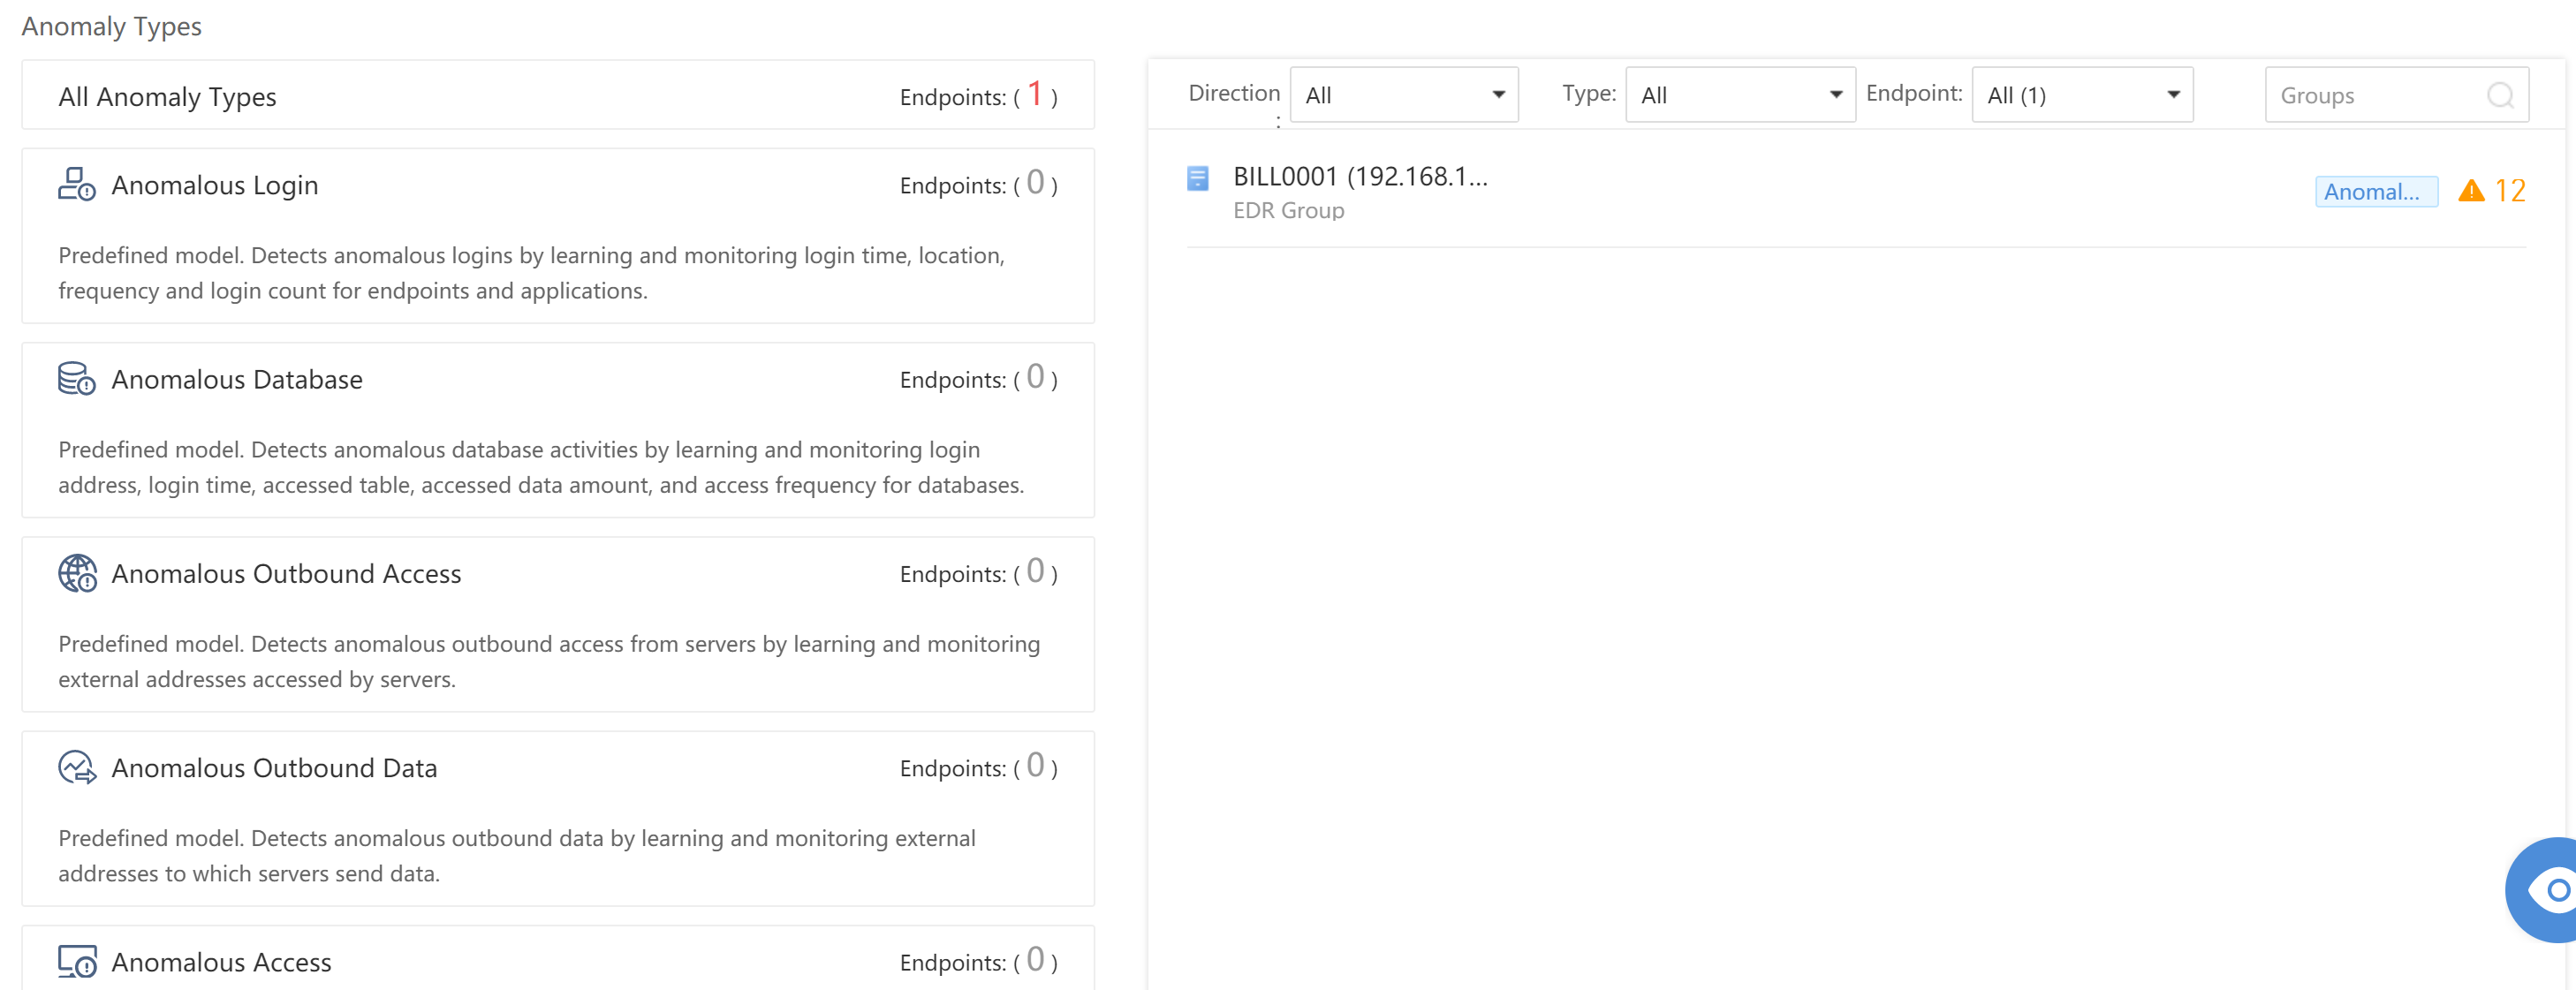
Administrators can click specific anomaly behaviors to view detailed Anomalies, Models, and UEBA.
Unauthorized Access
Unauthorized access mainly refers to the access behavior that matches the STA’s illegal access policy blacklist or whitelist or the behavior that violates the application control policy in the Network Secure(NGAF) When frequently accessed in violation, the host may be controlled by a hacker or a violation by an intranet user. The Cyber Command platform displays the overall situation of illegal access for administrators on the Detection>Anomalies>Unauthorized Access page and guides specific analysis and corresponding handling.
Overall Display
Under the Detection>Anomalies>Unauthorized Access page, administrators can summarize the following overall data:
Lateral Threat: Shows all lateral threats.
Outbound Threat: Shows all outbound threats.
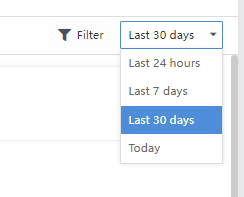
In addition, you can view statistics of a specific time frame by selecting the Last 24 hours, Last 7 days,Last 30 days, or Today.
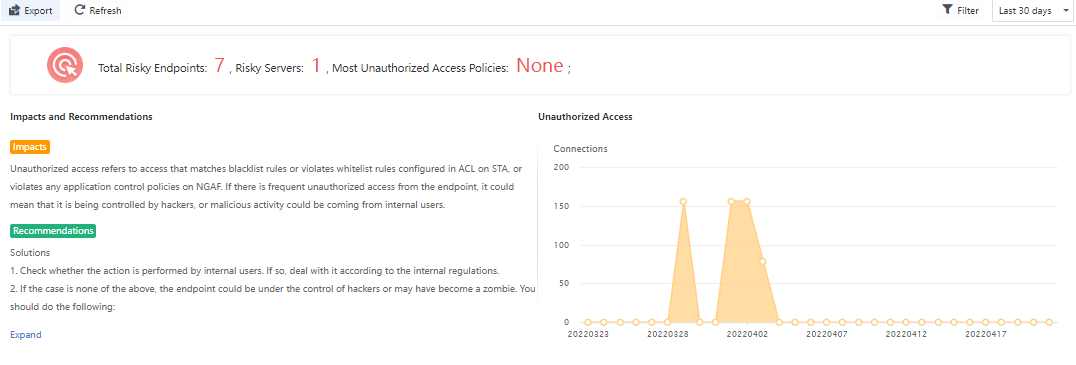
The administrator can click Export in the top left corner of the page to export the data in Excel format.
Detailed Analysis
Administrators can view unauthorized Sources and Destinations by category on the Unauthorized Access page.
Sources
Administrators can view the Src IP, Src Type, Groups, Destinations, Dst Type, Top 3 Policy Breaches, and Logs, as shown in the following figure.
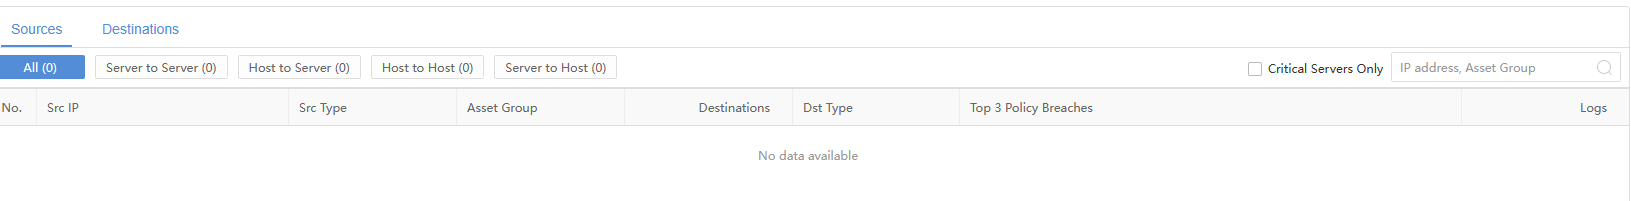
You can filter by All, Server to Server, Host to Host, Host to Server, and Server to Host. You can also directly search for the IP address or Groups through the search box on the right side and check the Critical Servers Only checkbox. The list will display the details of the critical servers only.
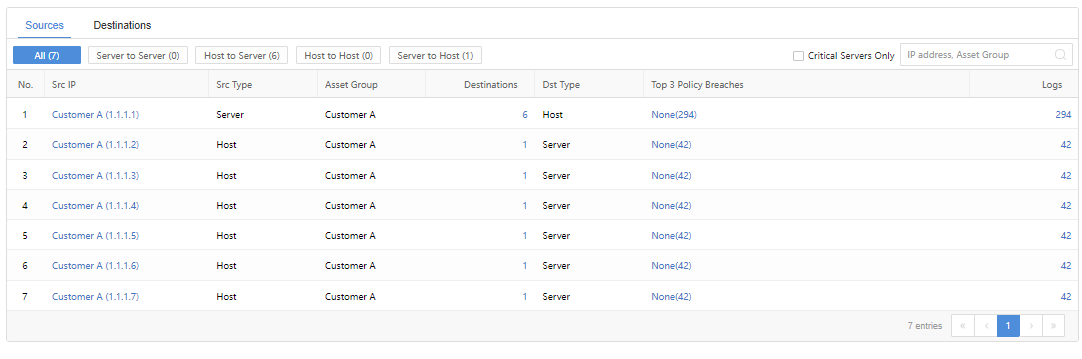
Note: The illegal access policy needs to be configured on the STA in advance. For the configuration method, see the STA security policy configuration section.
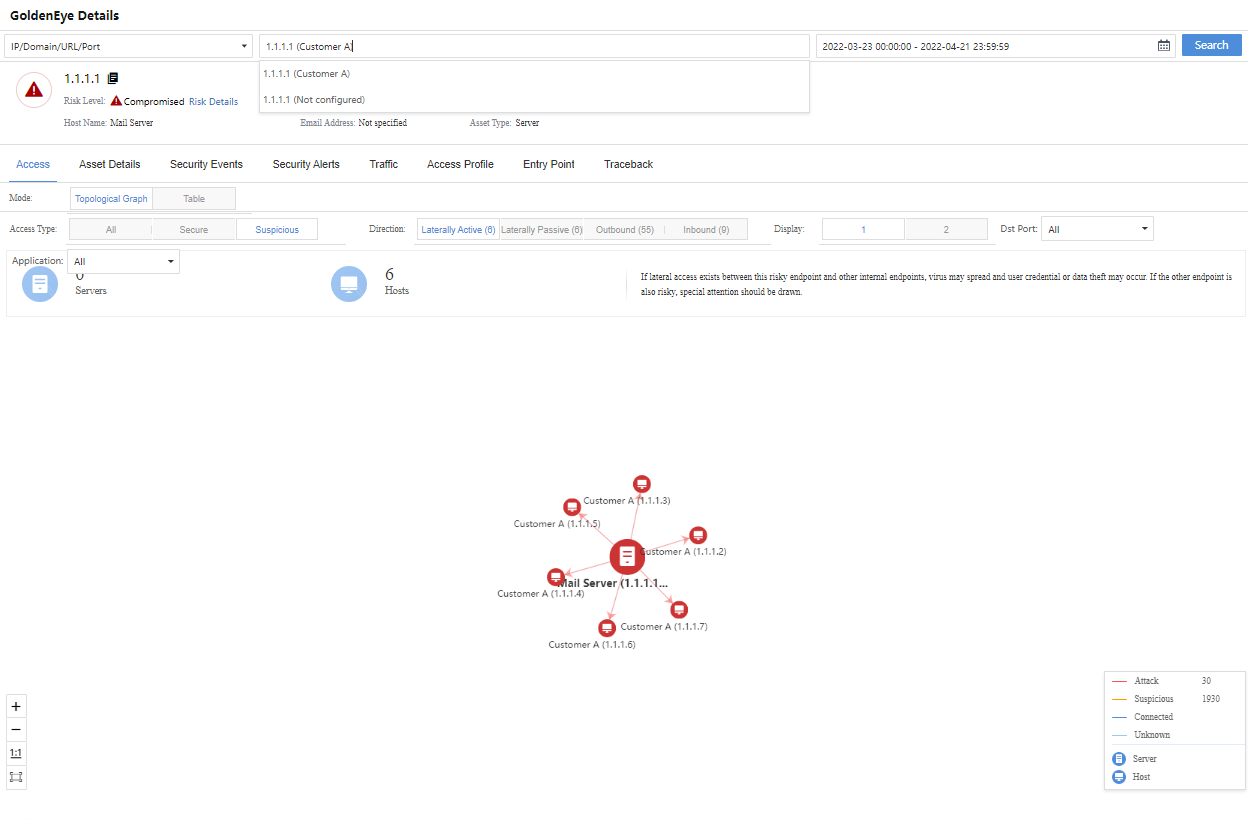
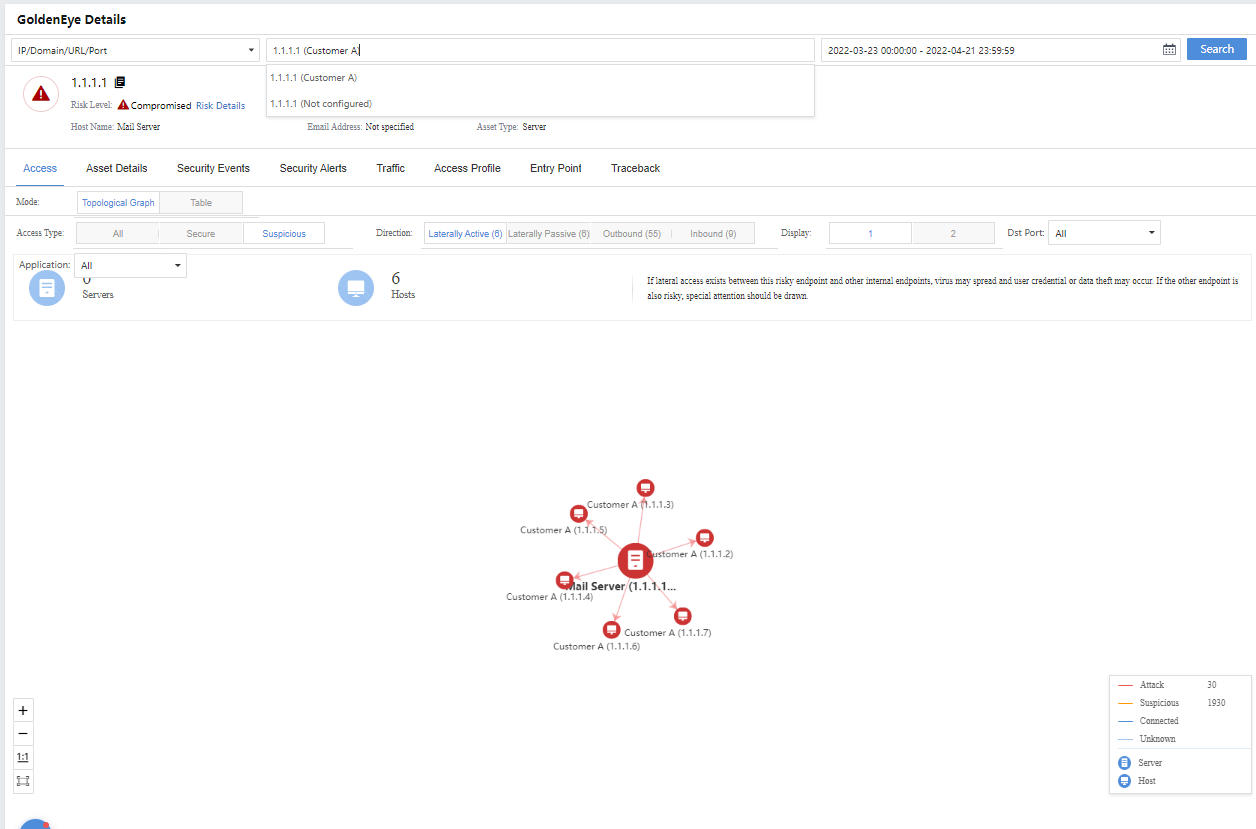
Administrators can click the specific IP/internal target number to enter the corresponding GoldenEye Details page for further details, as shown in the following figure.
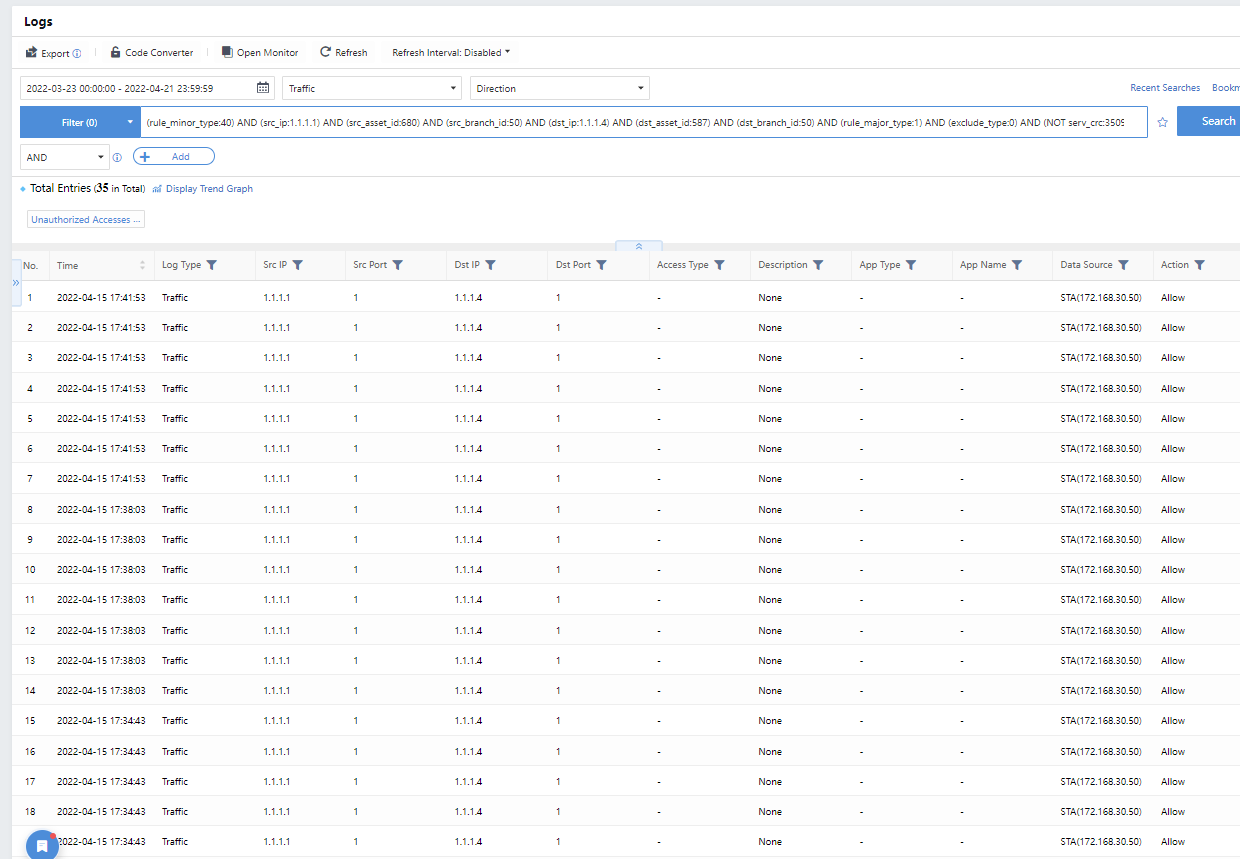
The administrator can click the specific policy breachesto redirect to the corresponding Detection >Logs to filter the corresponding logs automatically, as shown below.
Destinations
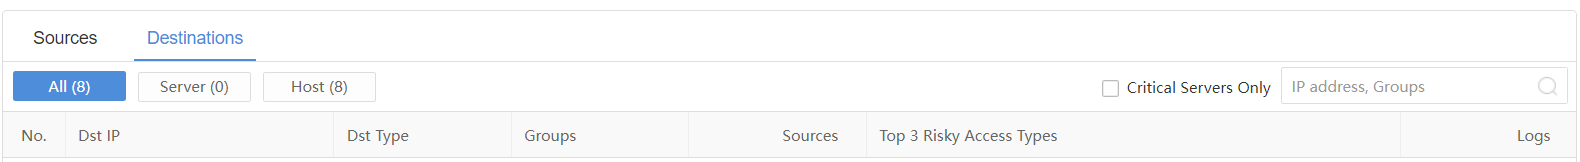
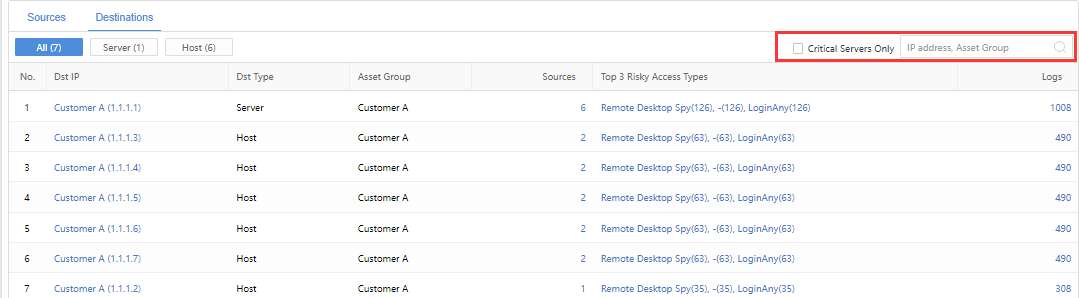
On the Destinations page, administrators can view the Dst IP,Dst Type,Groups,Sources,Top 3 Risky Access Types, and Logs, as shown in the following figure.

You can filter by All, Server, and Host. It supports searching and filtering by IP address or Groups. If you check the Critical Servers Only checkbox, the list only displays the data details of critical servers.
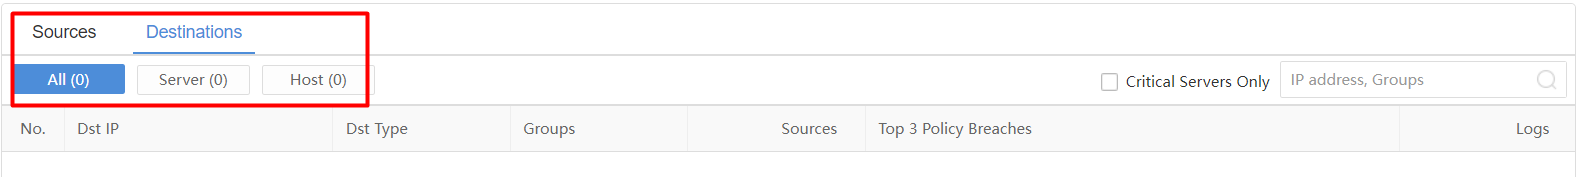
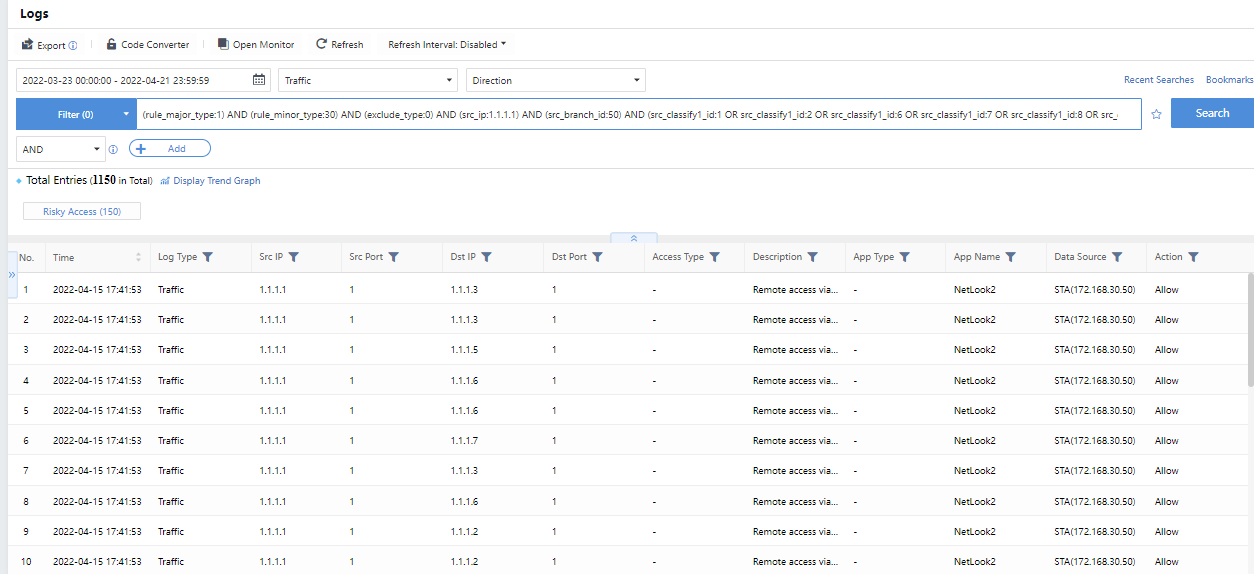
The administrator can click the specific Top 3 Risky Access Typesto enter the corresponding Detection> Logs to filter the corresponding logs automatically, as shown in the figure below.

Lateral Access
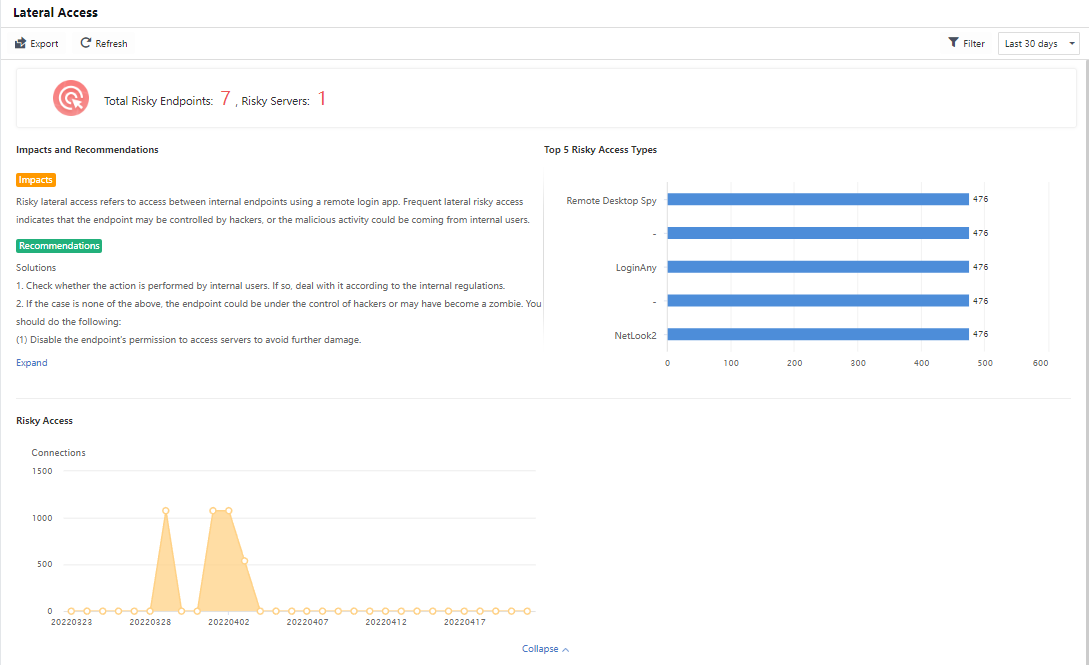
Lateral attacks mainly refer to attacks by internal endpoints on other internal endpoints. Hackers may control the endpoint to become a springboard to control more other endpoints on the intranet or malicious acts by intranet users, which significantly affects the customer’s intranet security. On the Lateral Access page, the Cyber Command platform displays the overall situation of lateral attacks for administrators and guides specific analysis and corresponding solutions.
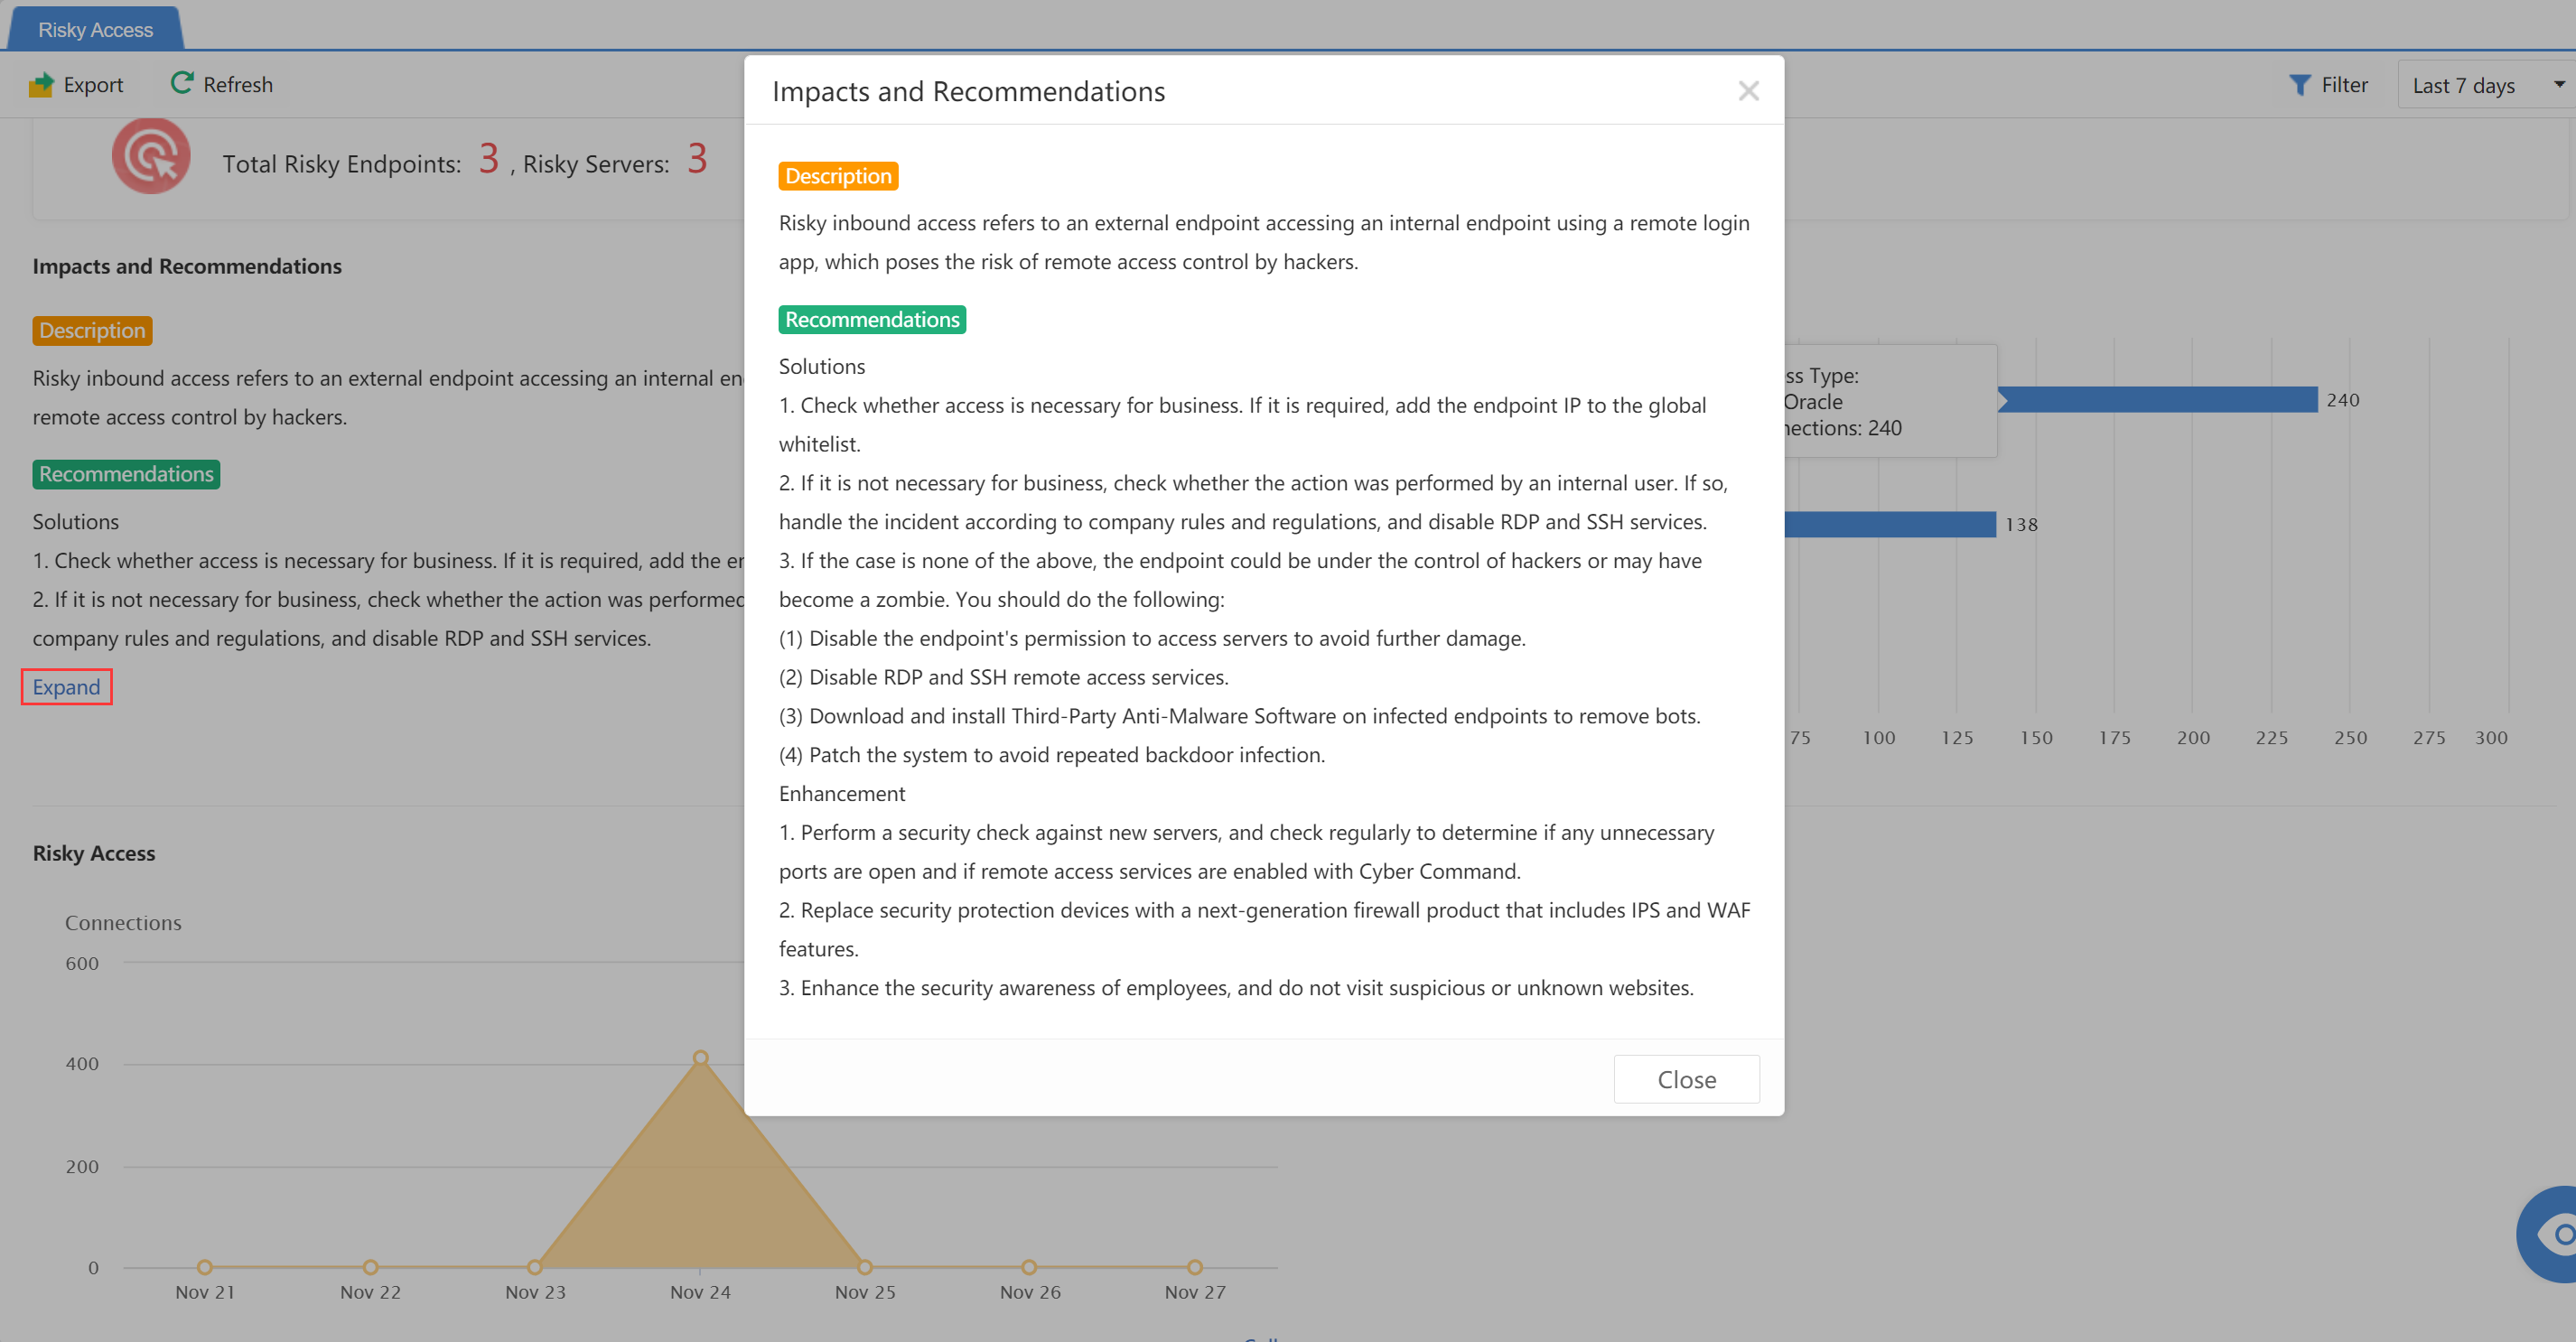
Overall Display
Under the Lateral Access page, the administrator can overview the following overall data:
The number of Risky Endpoints and Risky Servers.
Risky Access: Records the number of insider attacks that occur every day over some time.
Impacts and Recommendations: Includes hazard description and safety recommendations. Click Expand to view the complete recommendations.
You can view the statistics of a specific time range by selecting the Last 24 hours,Last 7 days,Last 30 days,and Today. Meanwhile, you can click Filter to customize the Period and Application, as shown in the following figure.
The administrator can click Export to export the data into an Excel sheet.
Detailed Analysis
Under the Lateral Access page, the administrator can see the Sources and Destinations tabs.
Sources
On the Sources page, administrators can view the Src IP, Src Type, Groups, Destinations, Dst Type, Top 3 Policy Breaches, and Logs, as shown in the following figure.
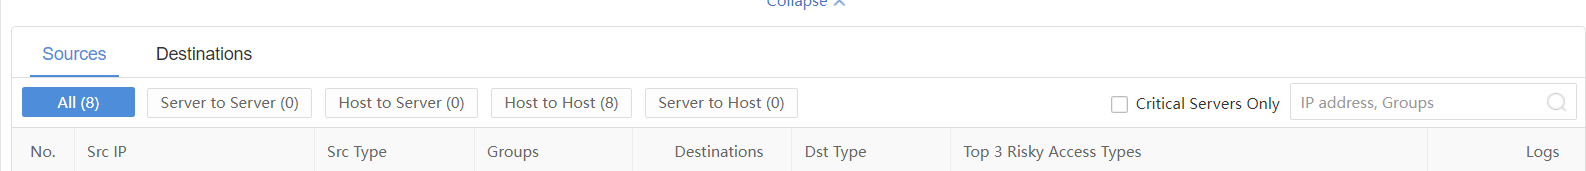
You can filter through All, Server to Server, Host to Server, Host to Host, Server to Host, or directly search the IP address or Groups through the search box.
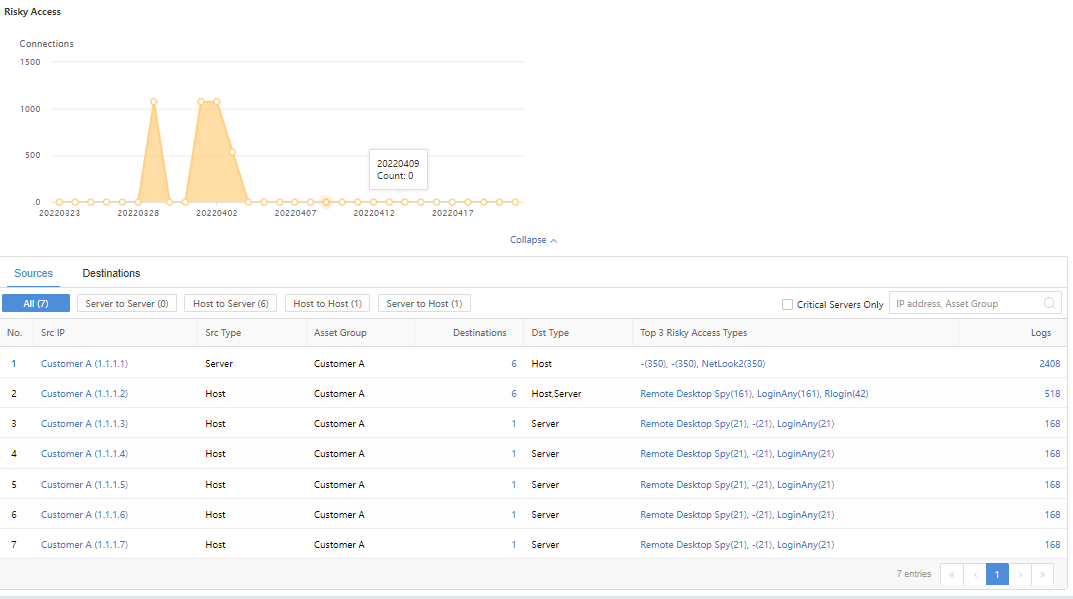
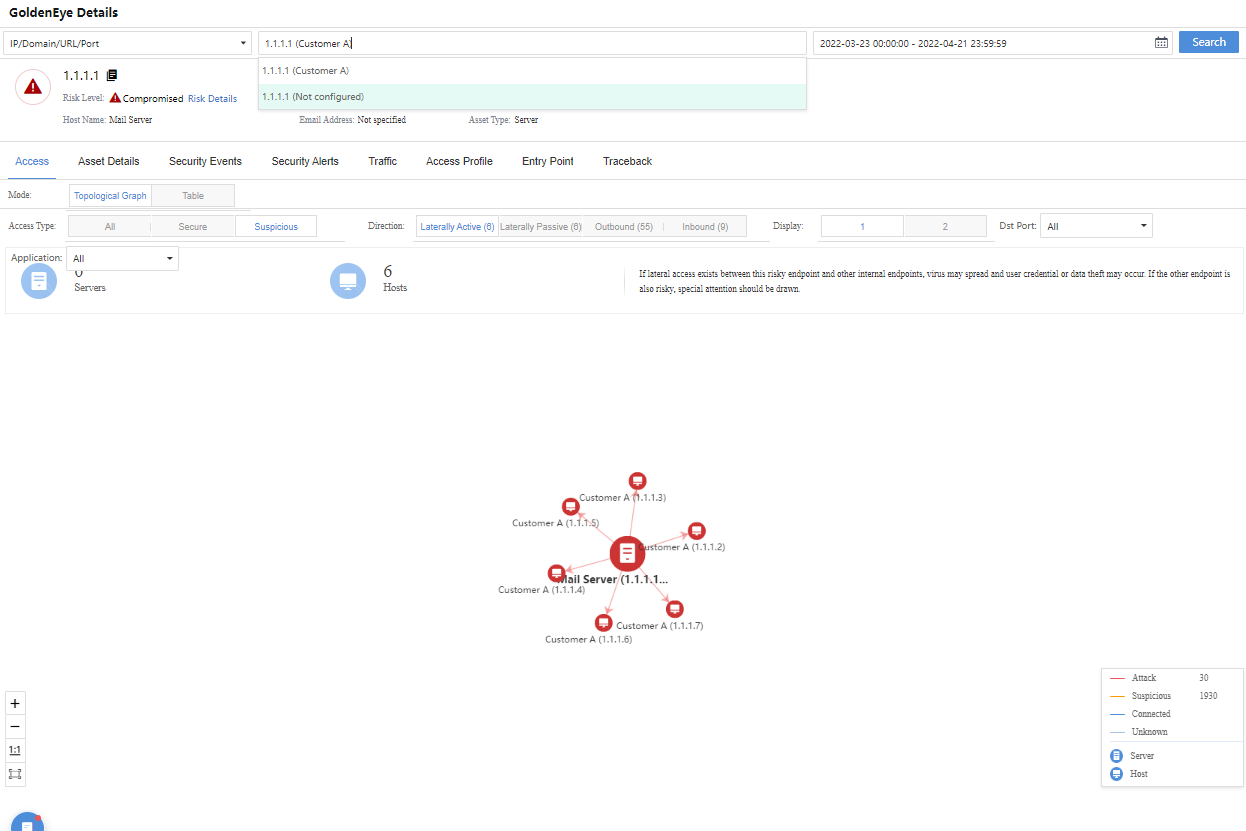
Administrators can click the specific Source IP/number of Destinations to enter the corresponding GoldenEye Details page to further view detailed information, as shown in the following figure.
The administrator can click the specific Top 3 Risky Access Types to go to the corresponding Detection > Logs page and filter the corresponding logs automatically, as shown in the following figure.
Destinations
On the Destinations page, administrators can view the Dst IP,Dst Type,Groups,Sources,Top 3 Risky Access Types, and Logs, as shown in the following figure.
Internal victims can be filtered by All, Server, and Host. Check the Critical Servers Only checkbox to display the details of core servers in the list. Search by IP address or Groups is supported.
Administrators can click the specific IP/number of Sources to enter the GoldenEye Details page to further view detailed information, as shown in the following figure.
The administrator can click the specific Top 3 Risky Access Types to go to Detection>Logs to filter the corresponding logs automatically, as shown in the following figure.

Outbound Server Access
Overall Display
Under the Detection>Anomalies>Outbound Server Access page, administrators can visually view the external connection from the server’s perspective and pay timely attention to the access connections of businesses that do not need access to foreign countries. The administrator can specify the servers, regions, and period. The overall display information mainly includes:
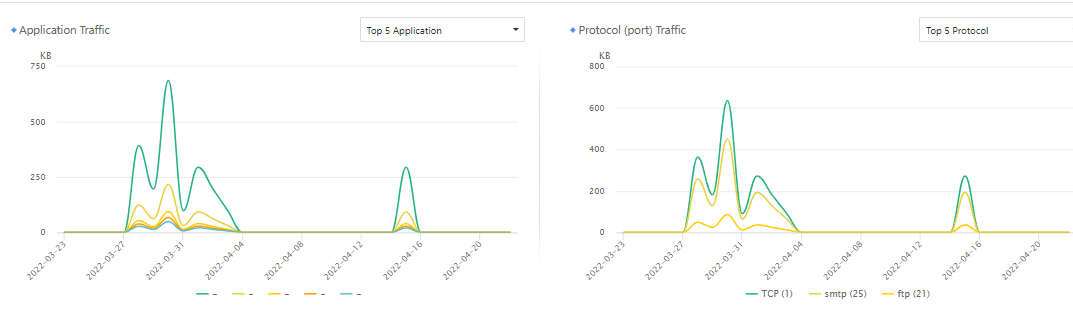
Application Traffic: By default, the trend displays the server’s Top 5 Application traffic. The administrator can switch to the Application Traffic Distribution in the upper right corner of the corresponding section.
Protocol (port) Traffic: The trend displays the server’s default Top 5 Protocol port traffic. Administrators can switch to the Protocol Traffic Distribution in the upper right corner of the corresponding section.
Note: Specify the server scope to include all servers, core servers, upstream traffic greater than downstream, and overnight connections (can be customized by clicking the settings button on the right) categories for further filtering by the administrator.
The Top 5 application and protocol trends are shown in the figure below.
Detailed Analysis
Administrators can view specific server connection details from the perspective of Regions or Servers.
Regions
From the regional perspective, it mainly includes Region,Src IPs,Bidirectional Bytes,Outbound/Inbound Bytes,Top 10 Apps,Top 10 Protocols (port),and Last Access. Administrators can search for keywords through the search bar or click Export in the upper left corner to export.
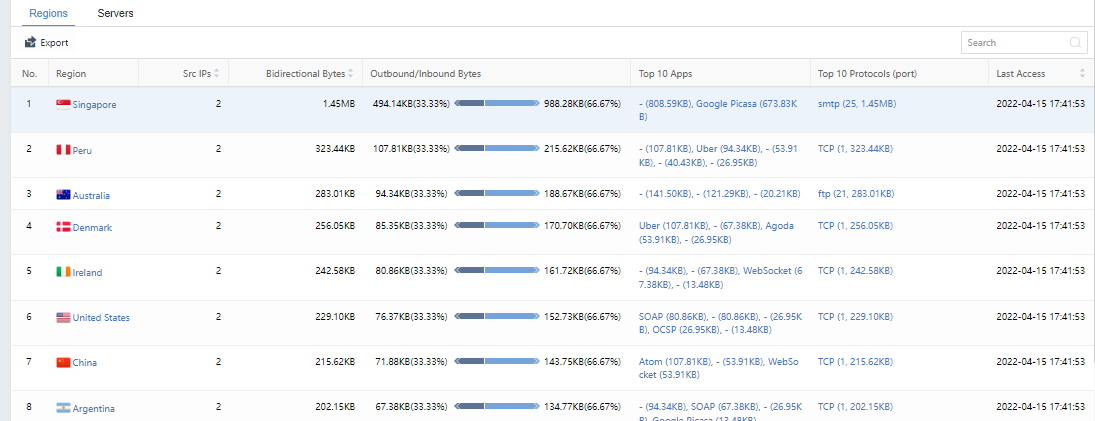
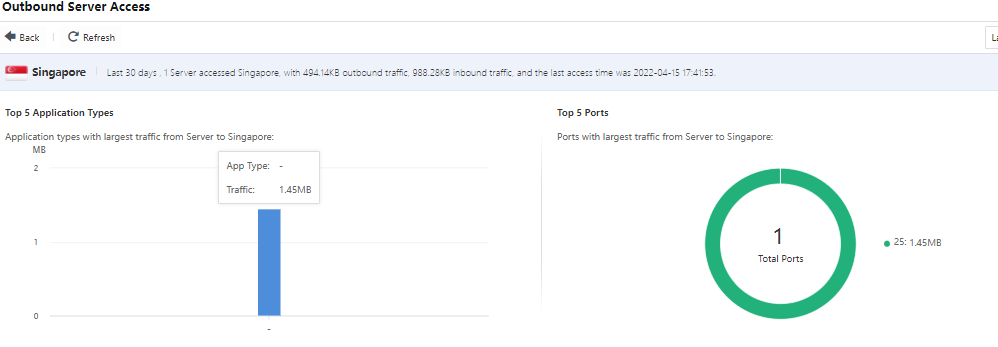
When you click a specific Region,Top 10 Apps, or Top 10 Protocols (port), it will redirect to the page corresponding to the region to display information, such as Top 5 Application Types, Top 5 Ports, and Outbound Access Server List, as shown in the following figure.
Servers
From the server’s perspective, it mainly includes information such as Server,Top 5 Dst Regions,Bidirectional Bytes,Outbound/Inbound Bytes,Top 10 Apps,Top 10 Protocols (port), and Last Access. Administrators can search for keywords through the search bar. You can also click the Export in the upper left corner for batch export operations, as shown in the figure below.
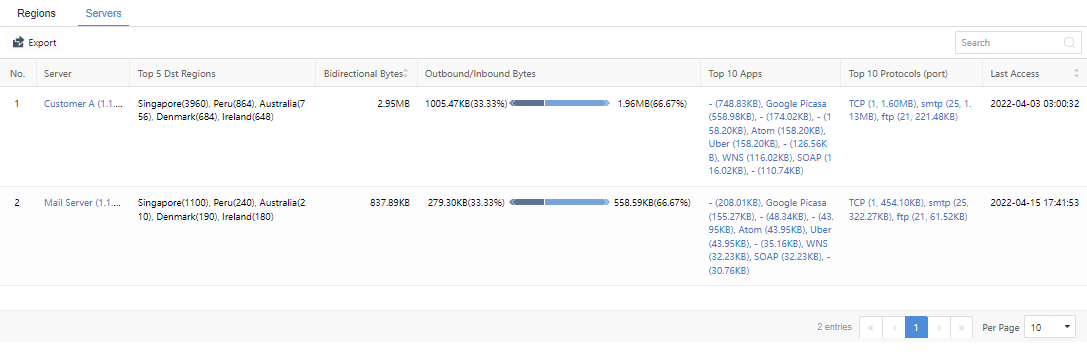
When you click the specific Server, Top 10 Apps, or Top 10 Protocols (port), you will be redirected to the GoldenEye Details page for further details.
Telemetry Hub
Caution: The Telemetry Hub feature requires a valid license and at least 96GB of memory to be deployed on Cyber Command.
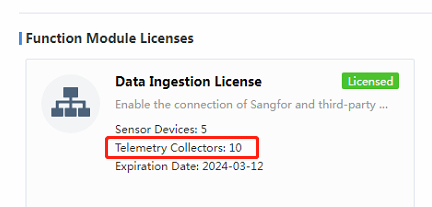
In addition, if the current Cyber Command 3.0.81 version is upgraded from a lower version, you need to update the license to use the Telemetry Hub feature.
The Telemetry Hub feature mainly collects third-party vendor logs into Cyber Command for centralized management. Certain types of logs can even be further analyzed and aggregated into security alerts in Cyber Command.
Collectors
The Telemetry Hub feature supports current prevailing data-sending methods, including Database, FTP, Kafka, Local File, SNMP trap, syslog, webservice, winlogbeat, and WMI. You can select the corresponding method; among these methods, the syslog type is the most frequent.
Navigate to Detection > Telemetry Hub > Collectors page, click New to add a new data source. In Type, select the type you want, for example, syslog. Then, pull down the Parsing Rule list and search according to your needs. Due to the many rules imported into Cyber Command, you can search for precise rules by matching keywords, such as Fortinet FW, as shown in the figure below.
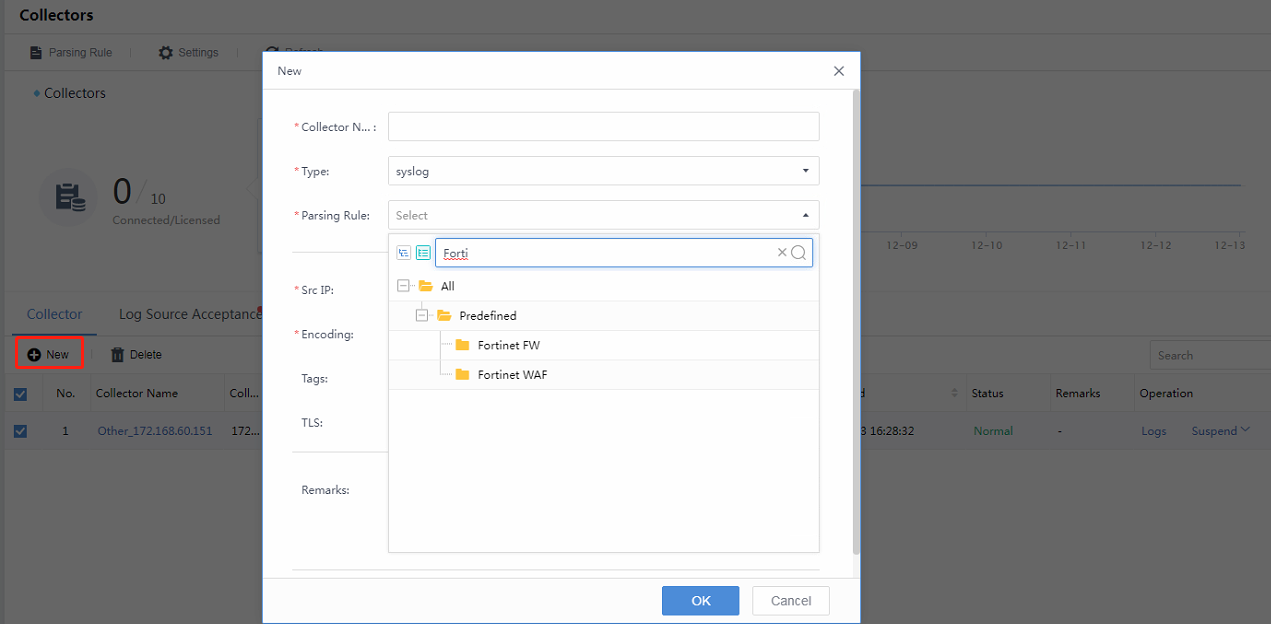
Src IP: Fill in the source vendor IP.
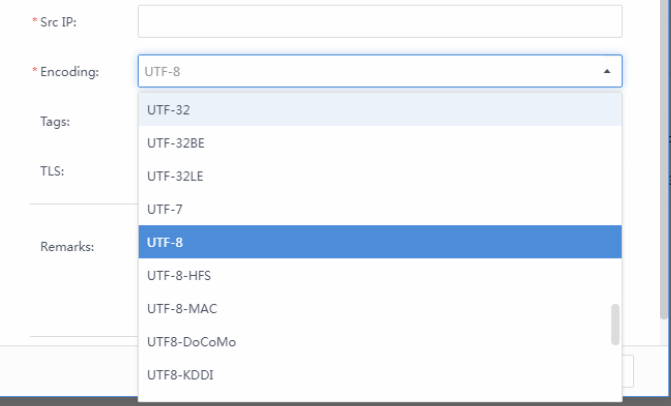
Encoding: Confirm with third-party vendor encoding types.
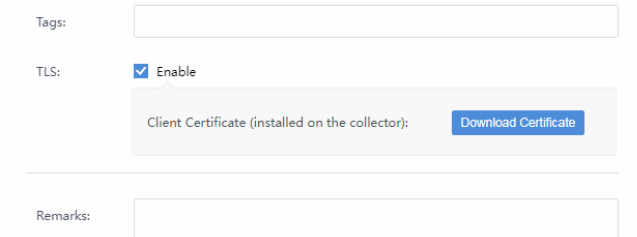
TLS:Usually, there is no need for TLS, and it depends on the customer’s requirement. It needs to be generated and installed on the collector if transmitted with TLS.
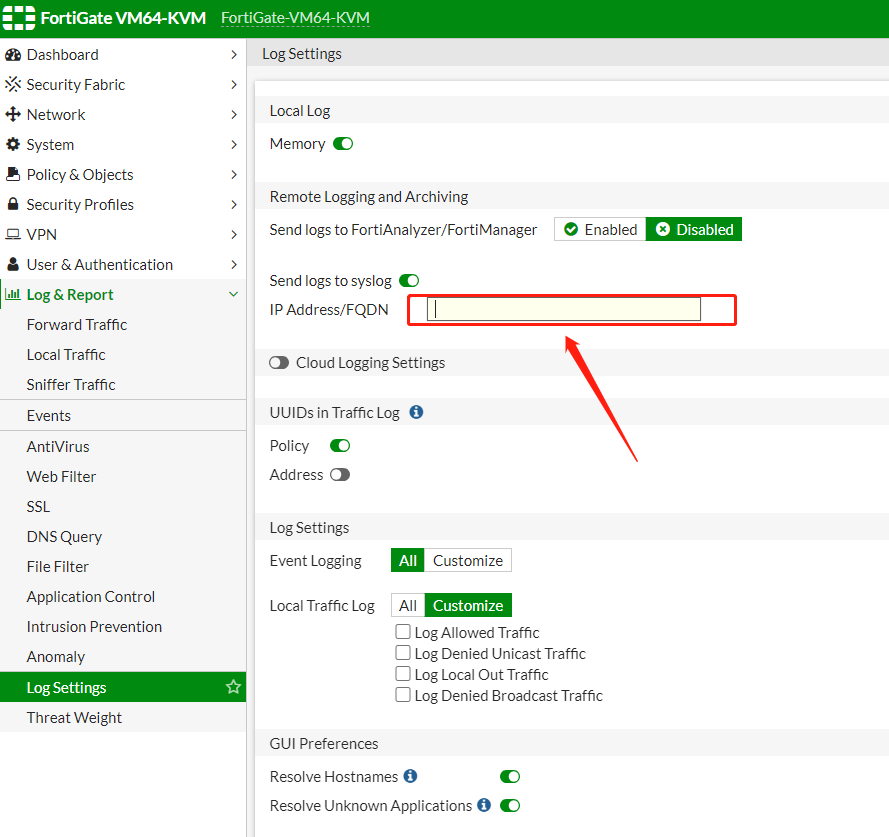
- Configure syslog sending on the third-party vendor’s side, for example, FortiGate, as shown in the figure below.
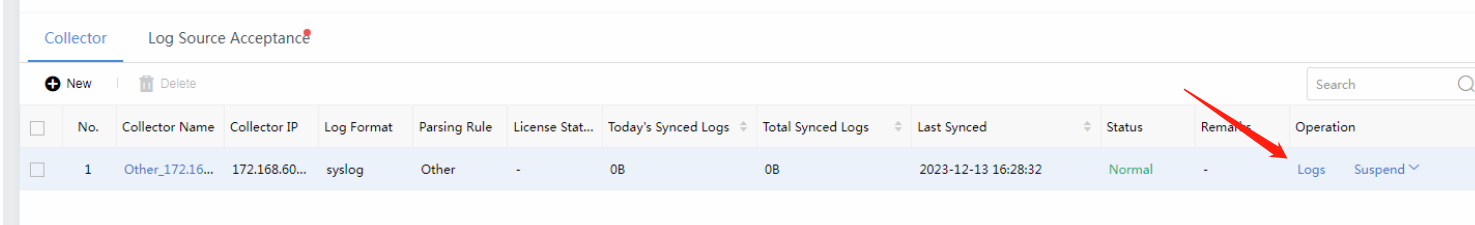
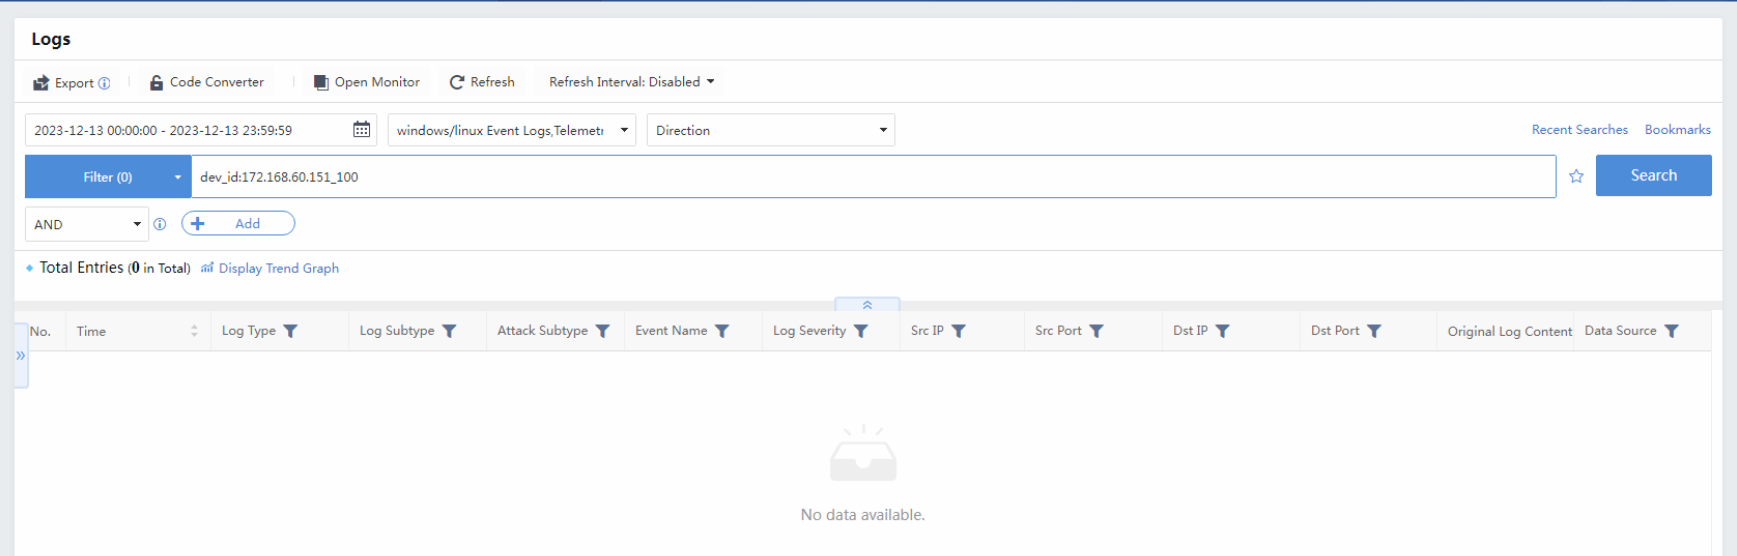
When the data source is configured correctly, you can select a specific collector and search the logs it sends, which will be redirected to the Logs page.
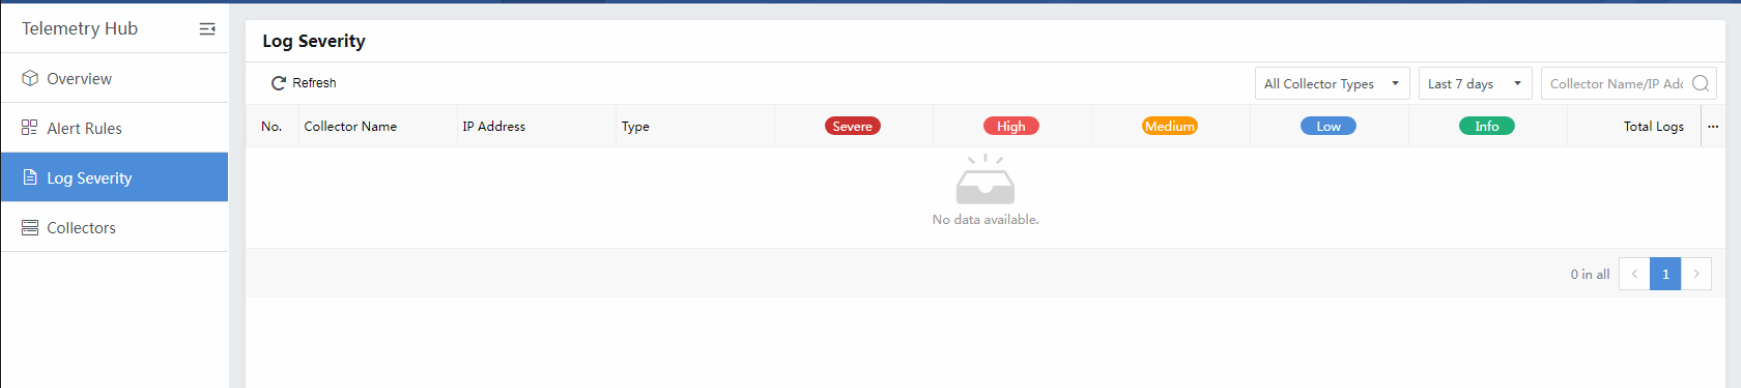
Log Severity
Parts of logs being received and parsed correctly are shown on the Log Severity page. It displays by severity with different levels.
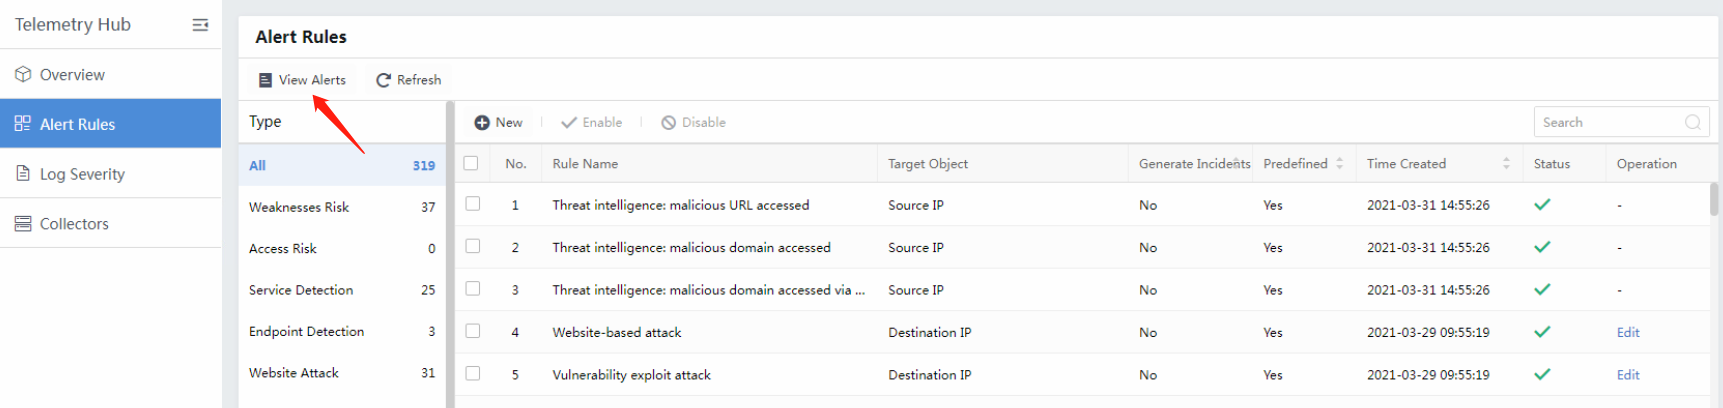
Alert Rules
The alert rule is mainly focused on correlating third-party logs to security alerts. The Alert Rules module has many built-in alert rules, as shown in the following figure.
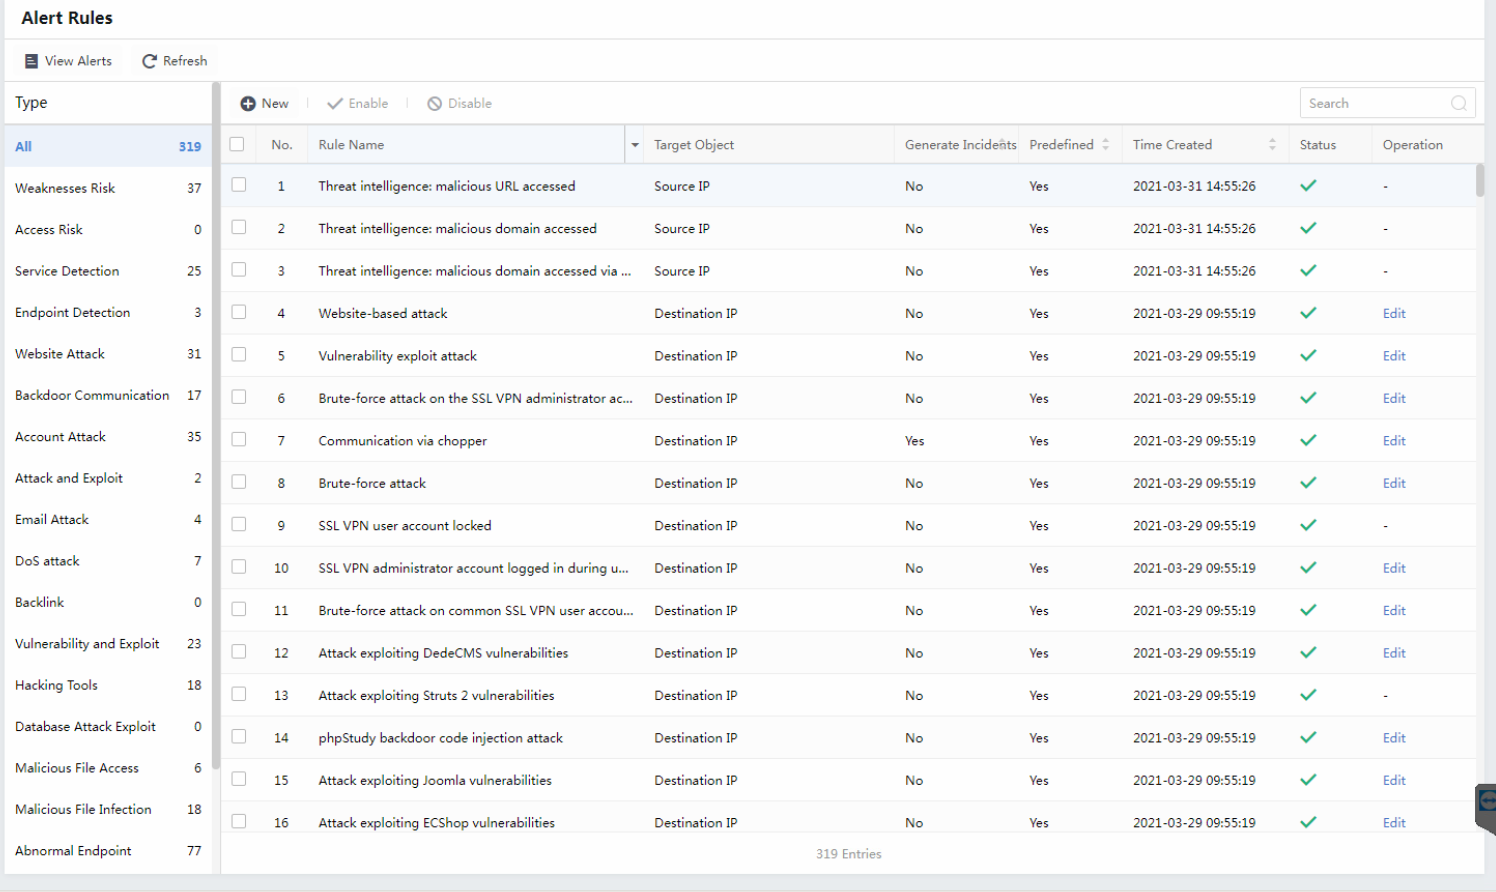
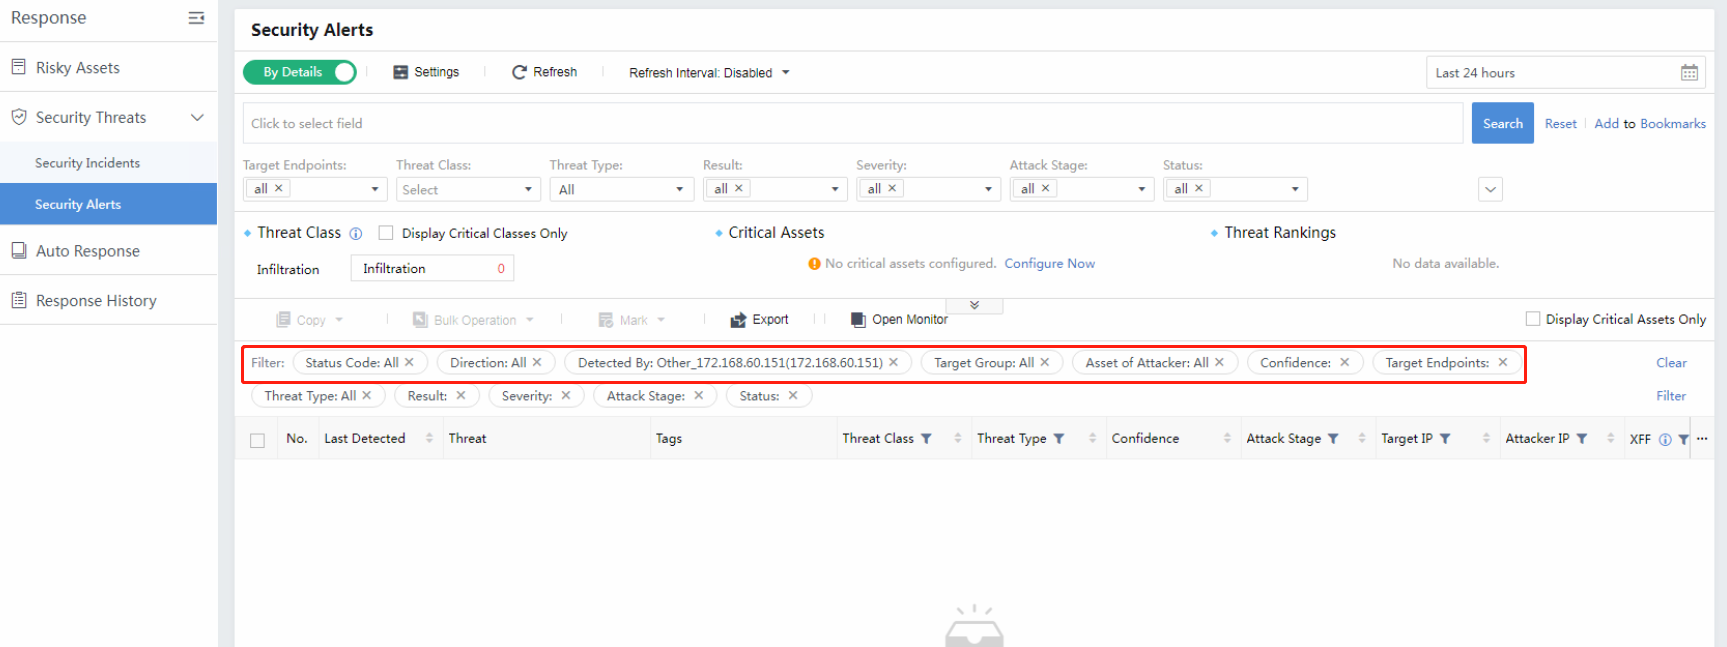
Click View Alerts to go to the Security Alerts page and filtered
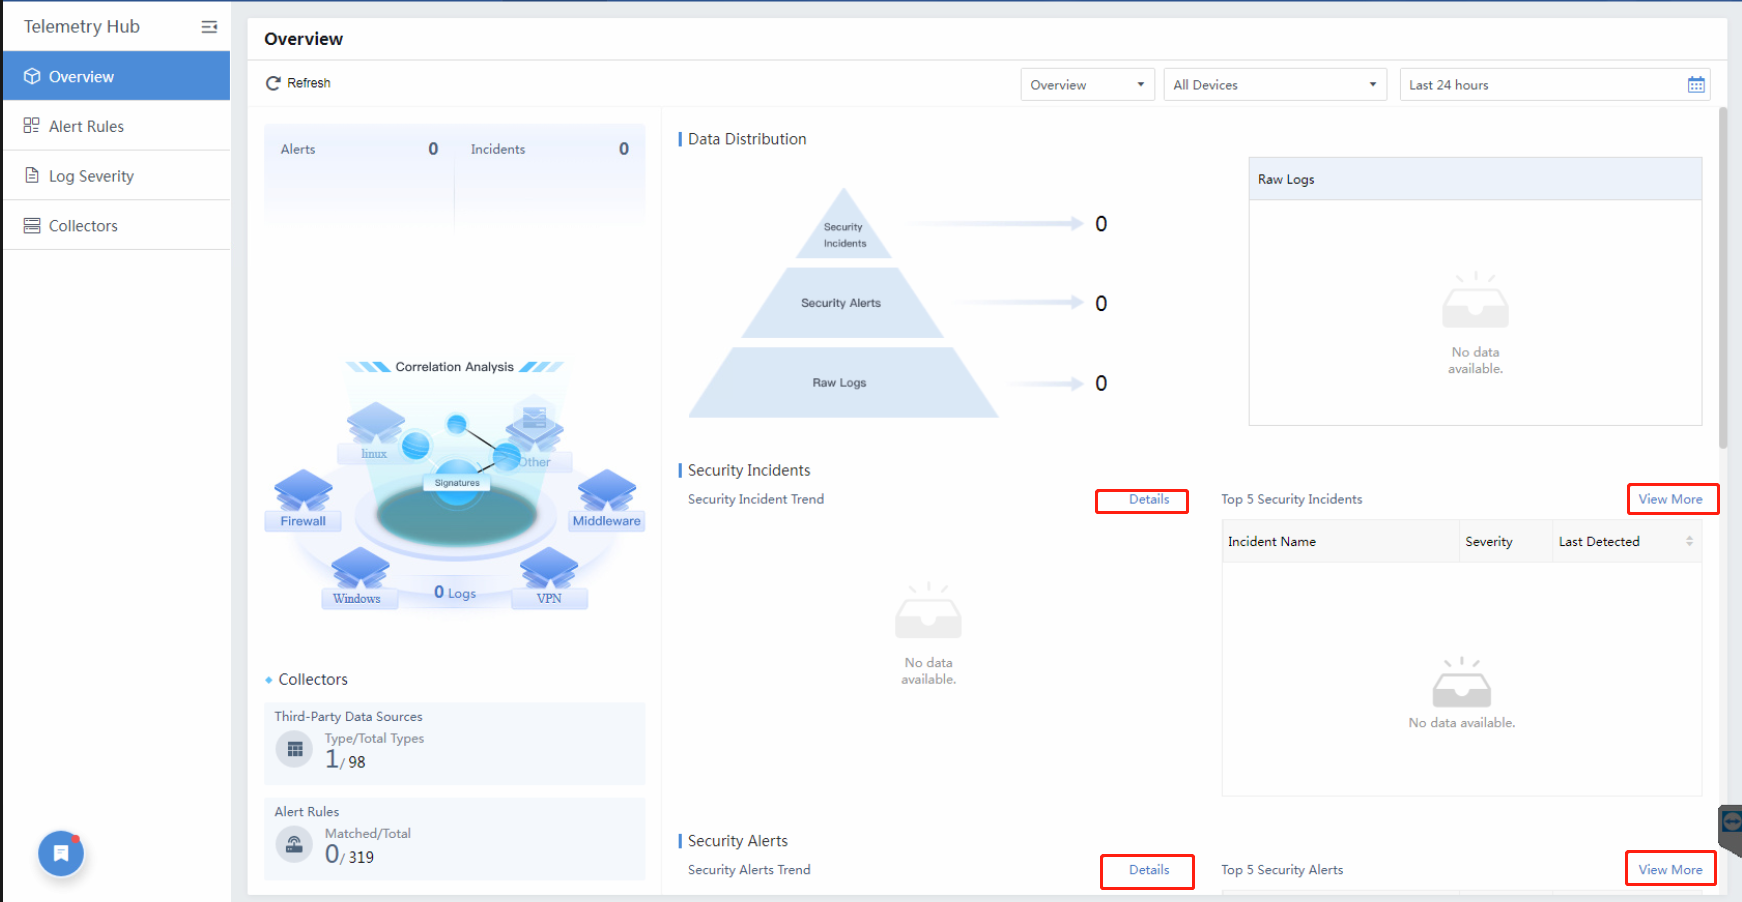
Overview
The Overview page provides a general dashboard about the Telemetry Hub module. You can click Details or View Morefor further data.
Assets
The assets center includes Assets and Weaknesses. In Assets, you can discover and define LAN’s endpoints, servers, and asset groups. You can find Vulnerabilities, Weak Password, Unencrypted Web Traffic, and Improper Configuration of assets in Weaknesses.
Assets
In Assets, you can discover and define LAN’s endpoints, servers, and business systems. Branches can also be configured in a multi-branch scenario.
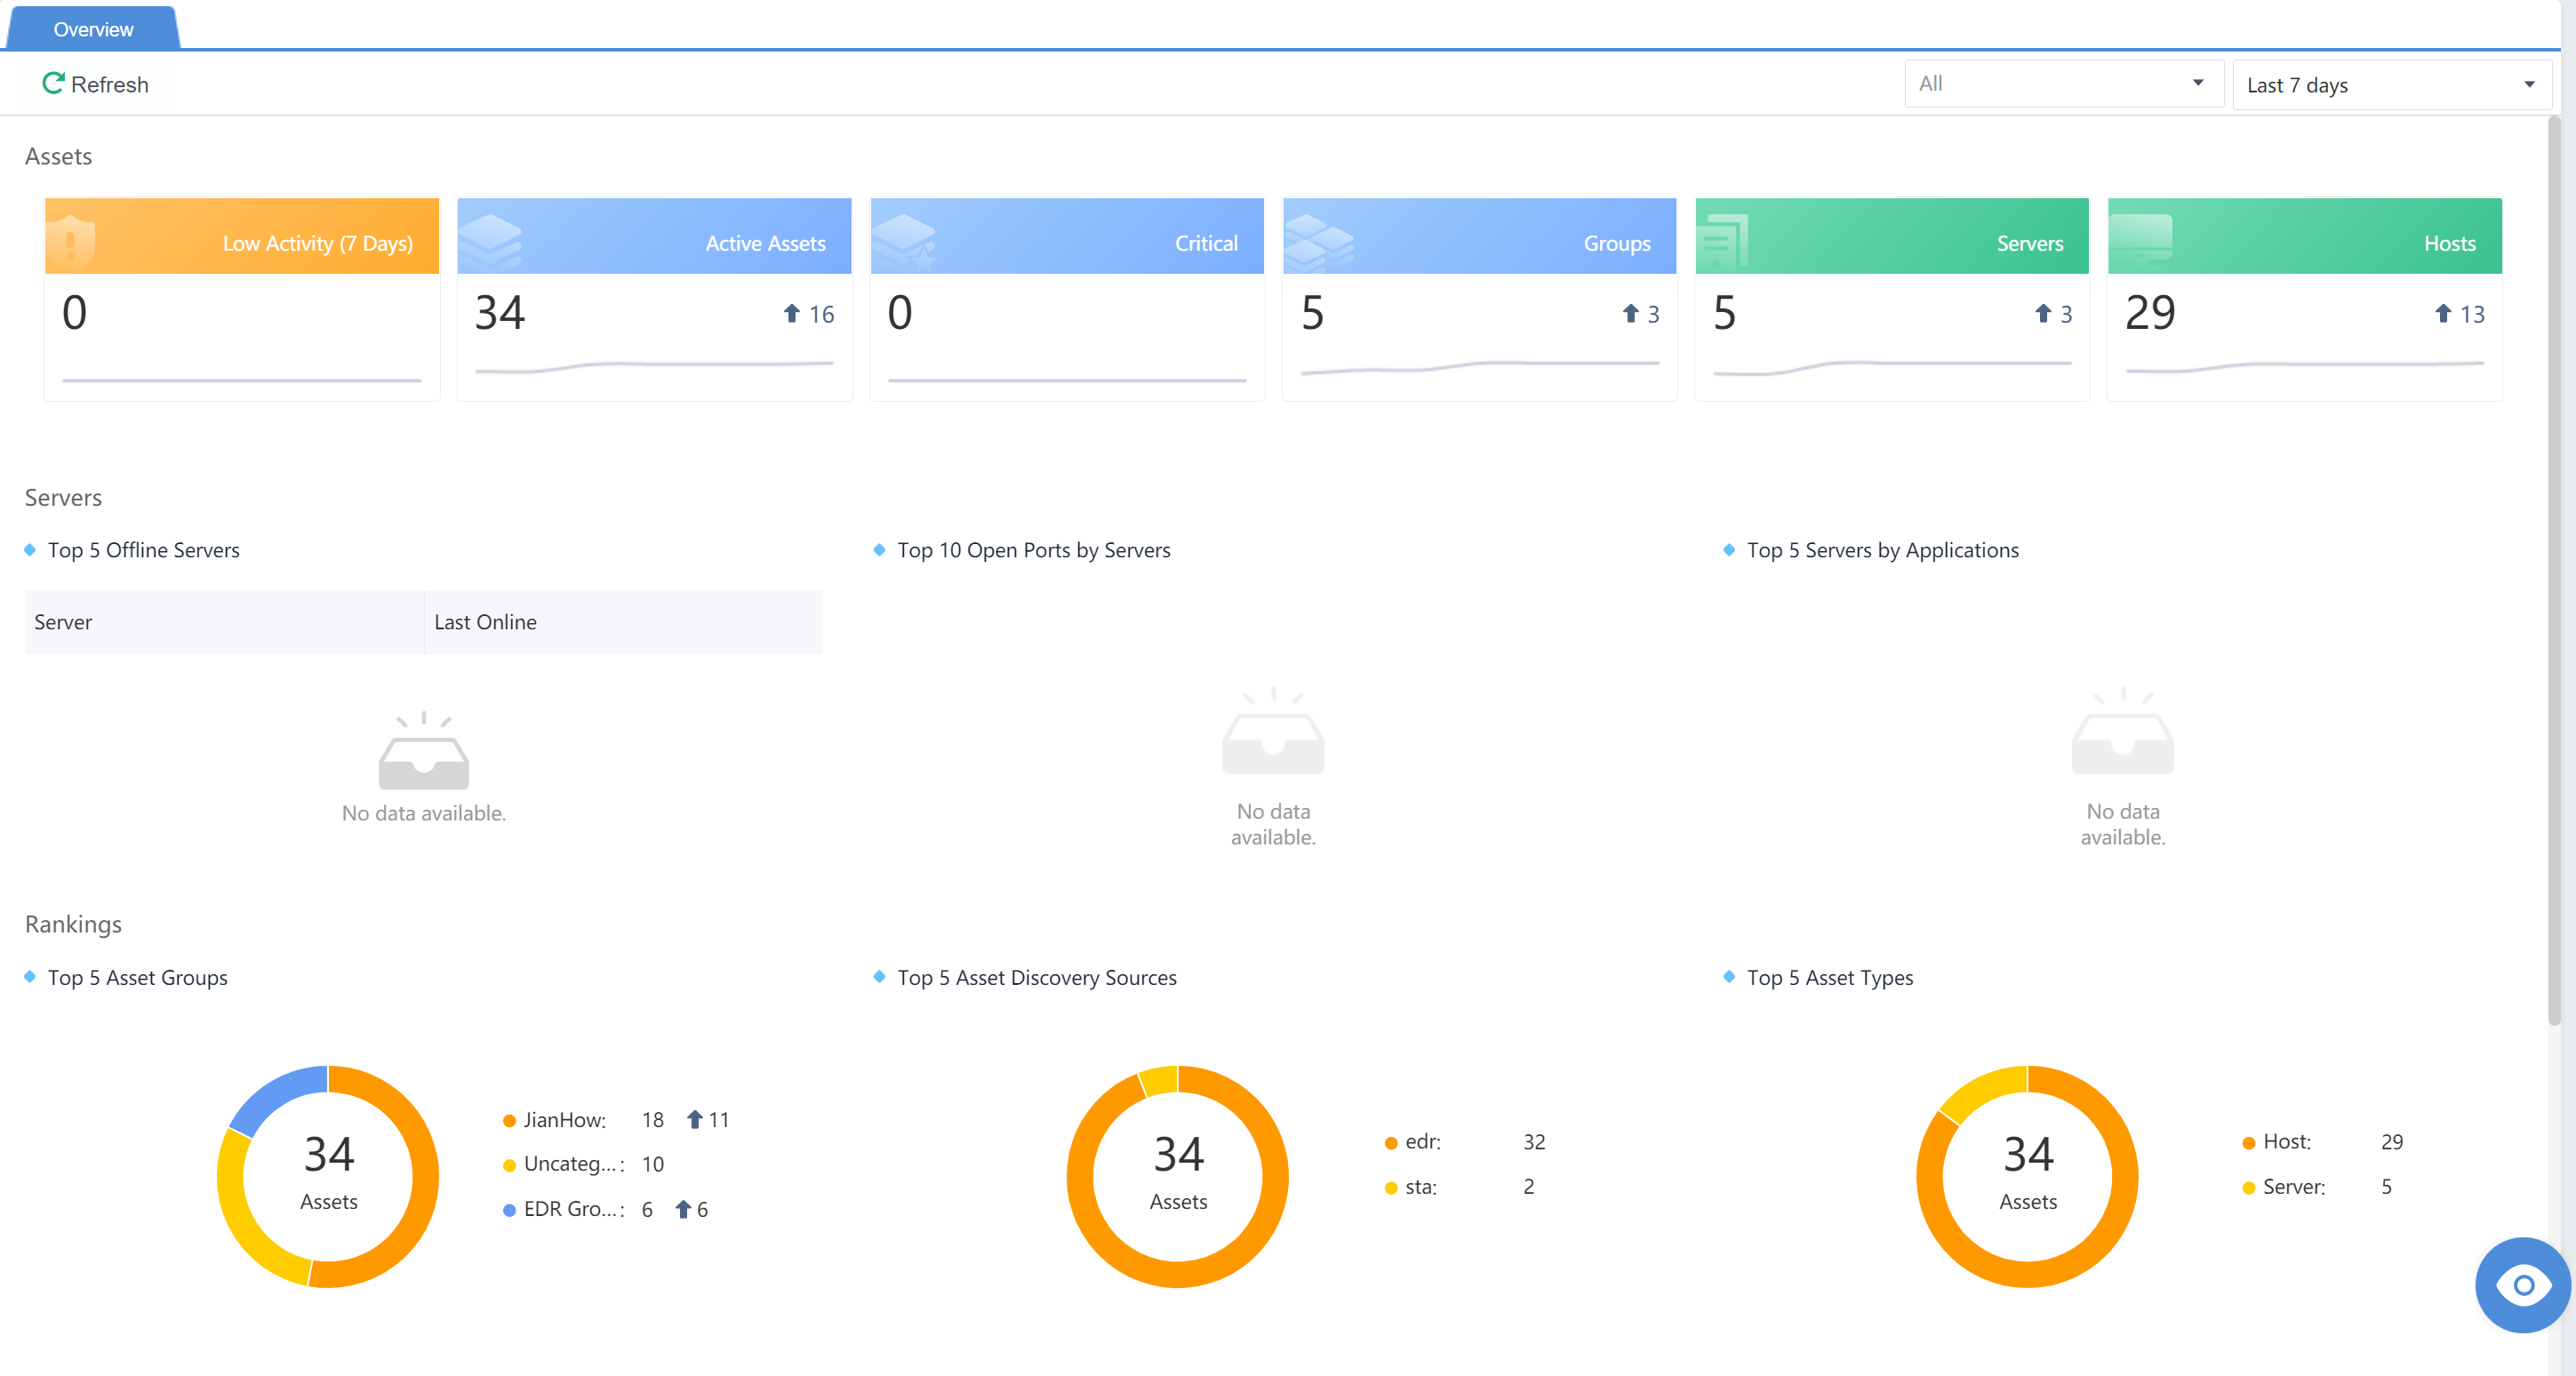
Overview
A panel to display all assets, as shown below:
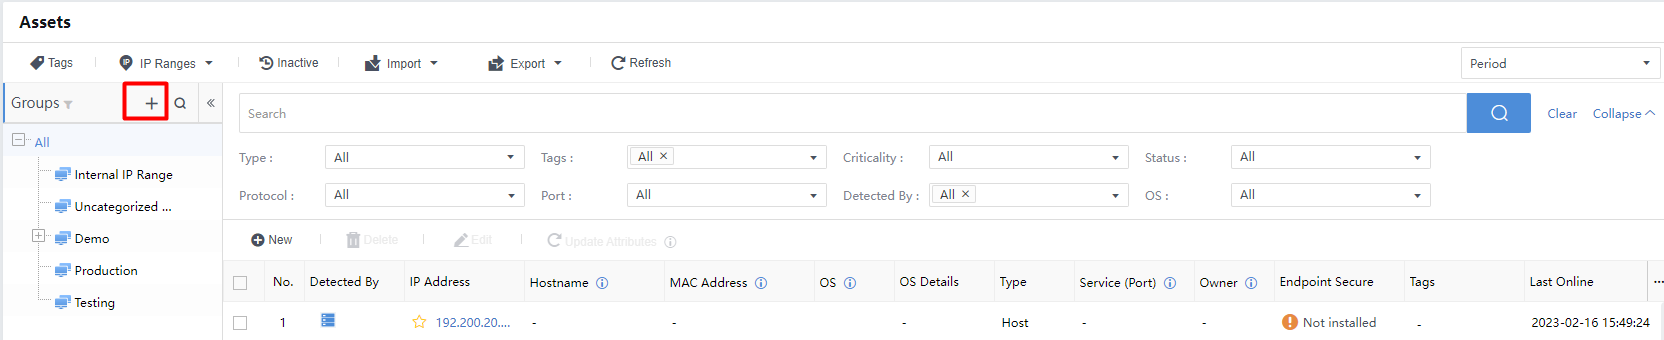
Assets
The Business Systems/Servers display automatically identified servers or manually added servers or asset groups. A server can be automatically discovered, whereas Asset Groups shall be manually added.
Click+to add an asset group manually.
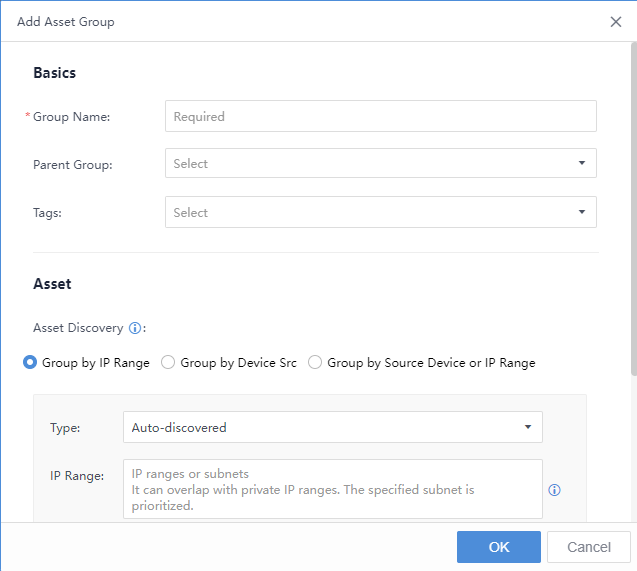
Group Name:Add a group name information for the assets.
Parent Group:Select a parent group.
Tags:Includes Business System, Branch,Security Domains,IP Groups, and Headquarter.
Type:Refer to the type of assets. Classified into Auto-discovered,Server, and Host.
IP Range:It can overlap with private IP ranges. The specified subnet is prioritized.
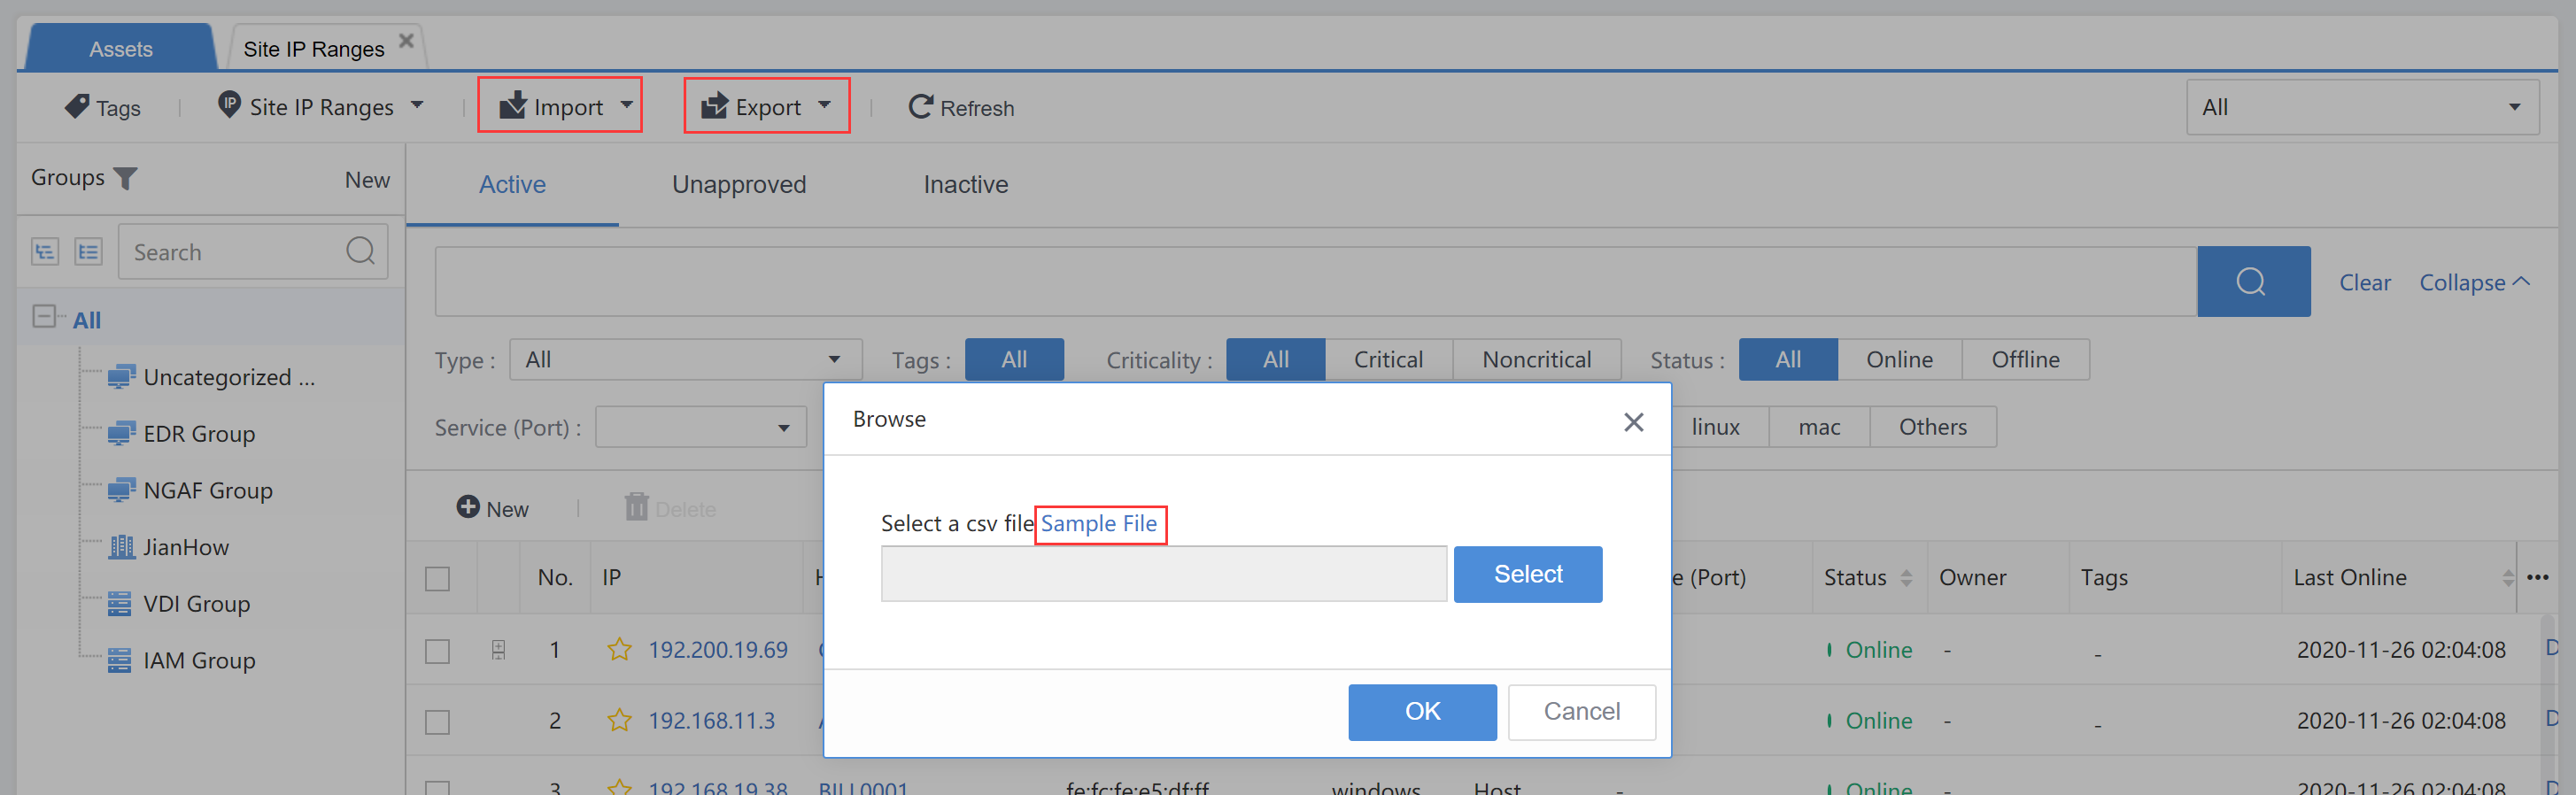
You can manually Import and Export the asset information.
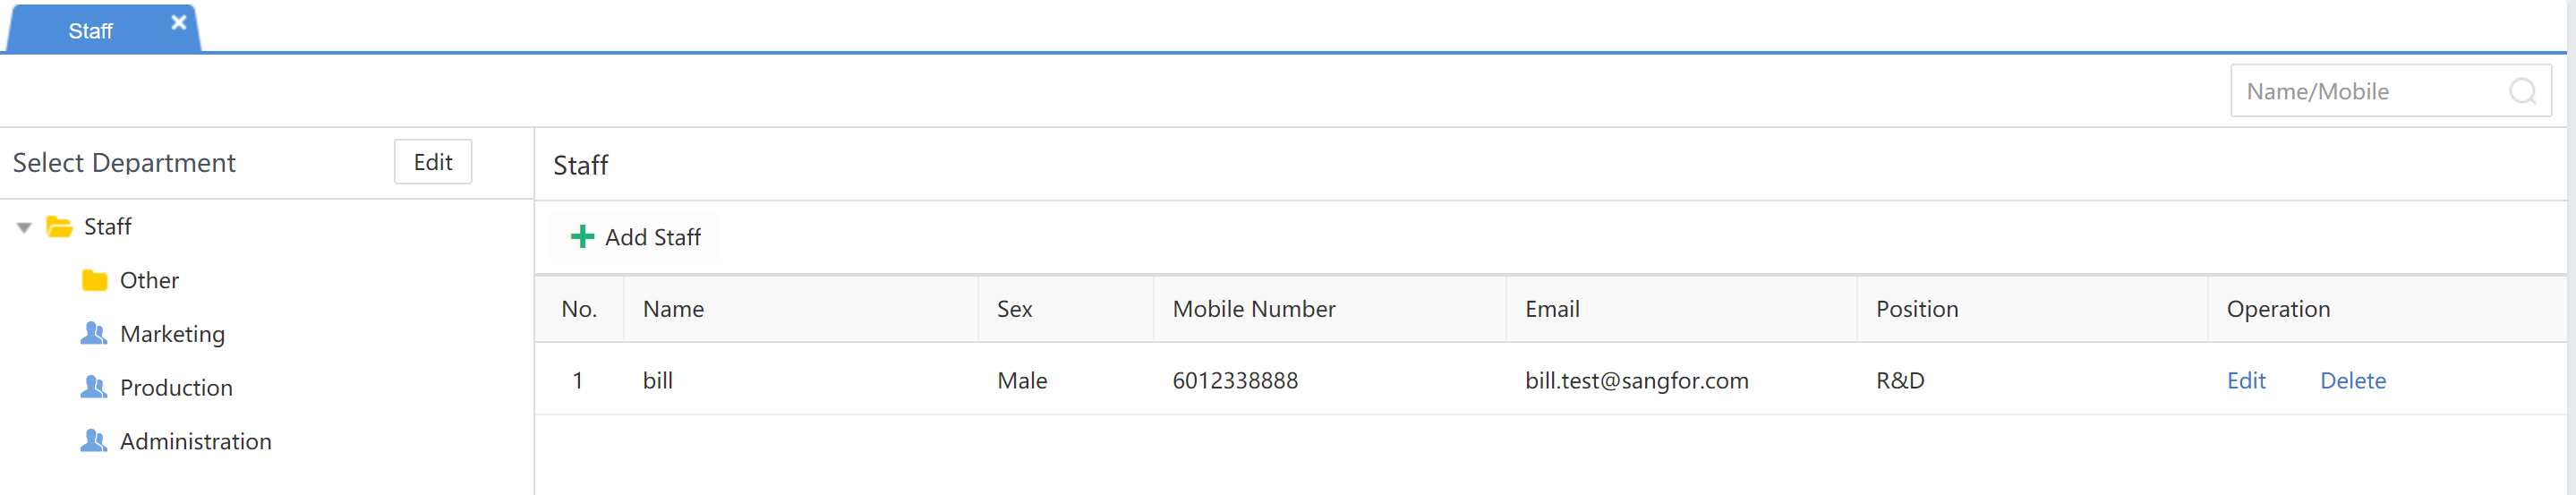
Staff
Navigate to Assets>Assets>Settings > Owners. You can view the staff information such as Owner, Gender, Mobile Number, Email, and Job Title.
Advanced
The following figure shows the basic settings of some assets.
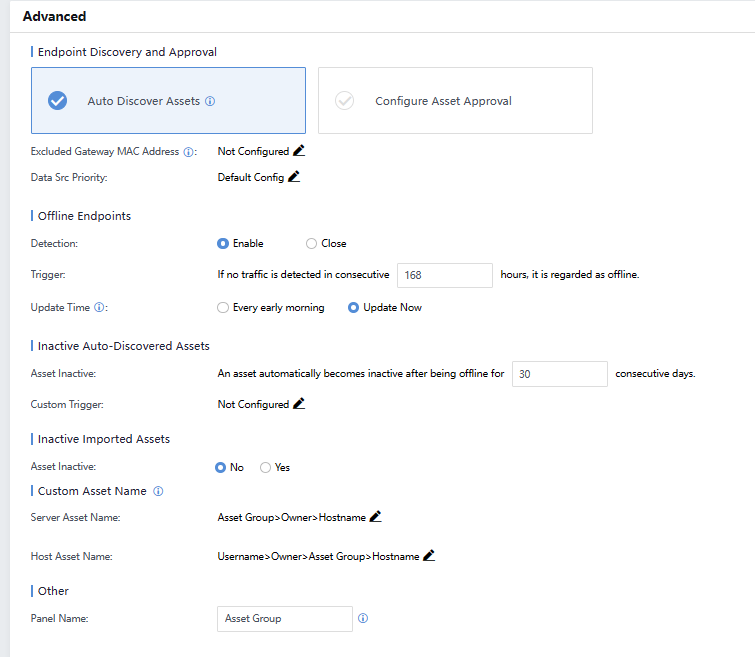
Endpoint Discovery and Approval: Cyber Command can automatically discover assets. If you tick Auto Discover Assets, adding asset information requires the administrator’s approval.
Excluded Gateway MAC Address: Exclude the useless MAC addresses to avoid interruption.
Data Src Priority:Set the priority to obtain the asset data.
OfflineEndpoints:Assets without traffic for a certain period will be automatically offline.
Update Time: Cyber Command will update asset information at a specific time. If you choose UpdateNow, it may cause performance issues. Updating Every early morningis recommended.
Inactive Auto-Discovered Assets:Assets will become inactive after being offline for a certain period.
Inactive Imported Assets:Default imported assets set to inactive or active.
Custom Asset Name:When an asset name is added to the platform if no asset name is configured, the default asset name will be displayed based on the priority in the Server Asset Name and Host Asset Name.
Third-Party Data Sources
Third–Party Data Sources support syncing the domain user and displaying the domain username in the Security Incidents and Security Alerts.
Navigate to Assets > Assets > Settings > Third-Party Data Sources and click the Add Device in the upper right corner to add the domain controller.
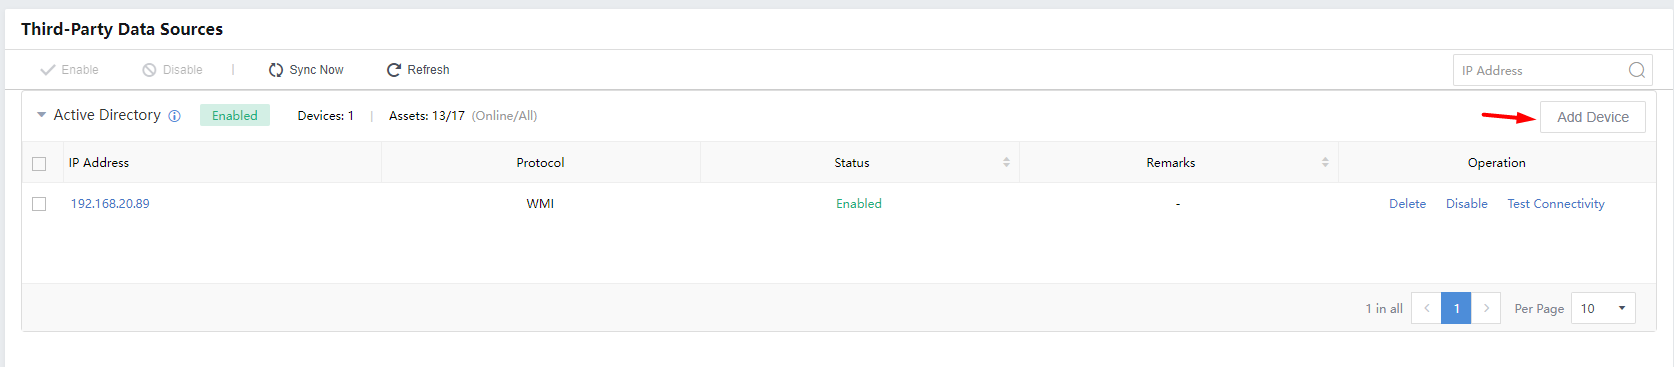
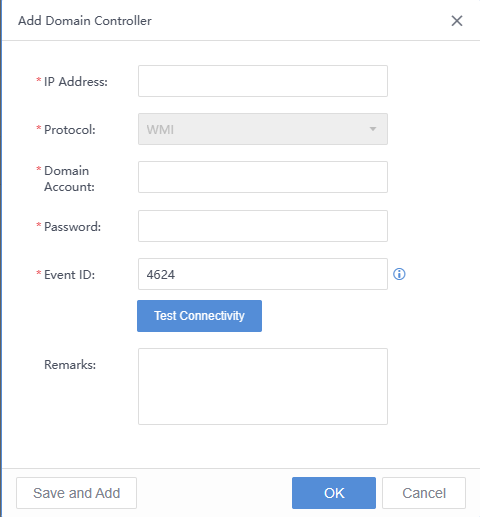
IP address:IP address of the AD domain.
Protocol:WMI is the default protocol.
Domain Account:Administrator of the AD domain account.
Password:Password of the AD domain account.
Event ID:Separate multiple event IDs with a comma. Event ID 4624 is specified by default.
Remarks:Remarks of the AD domain.
Weaknesses
The server weakness refers to the vulnerability in the server. Since all threats could cause harm to the server by attacking certain vulnerabilities of the server, the identification and processing of server weaknesses are essential to prevent the threats effectively.
Overview
You can filter the time range by selecting the Last 30 days, Last 7 days, or Last 24 hours.
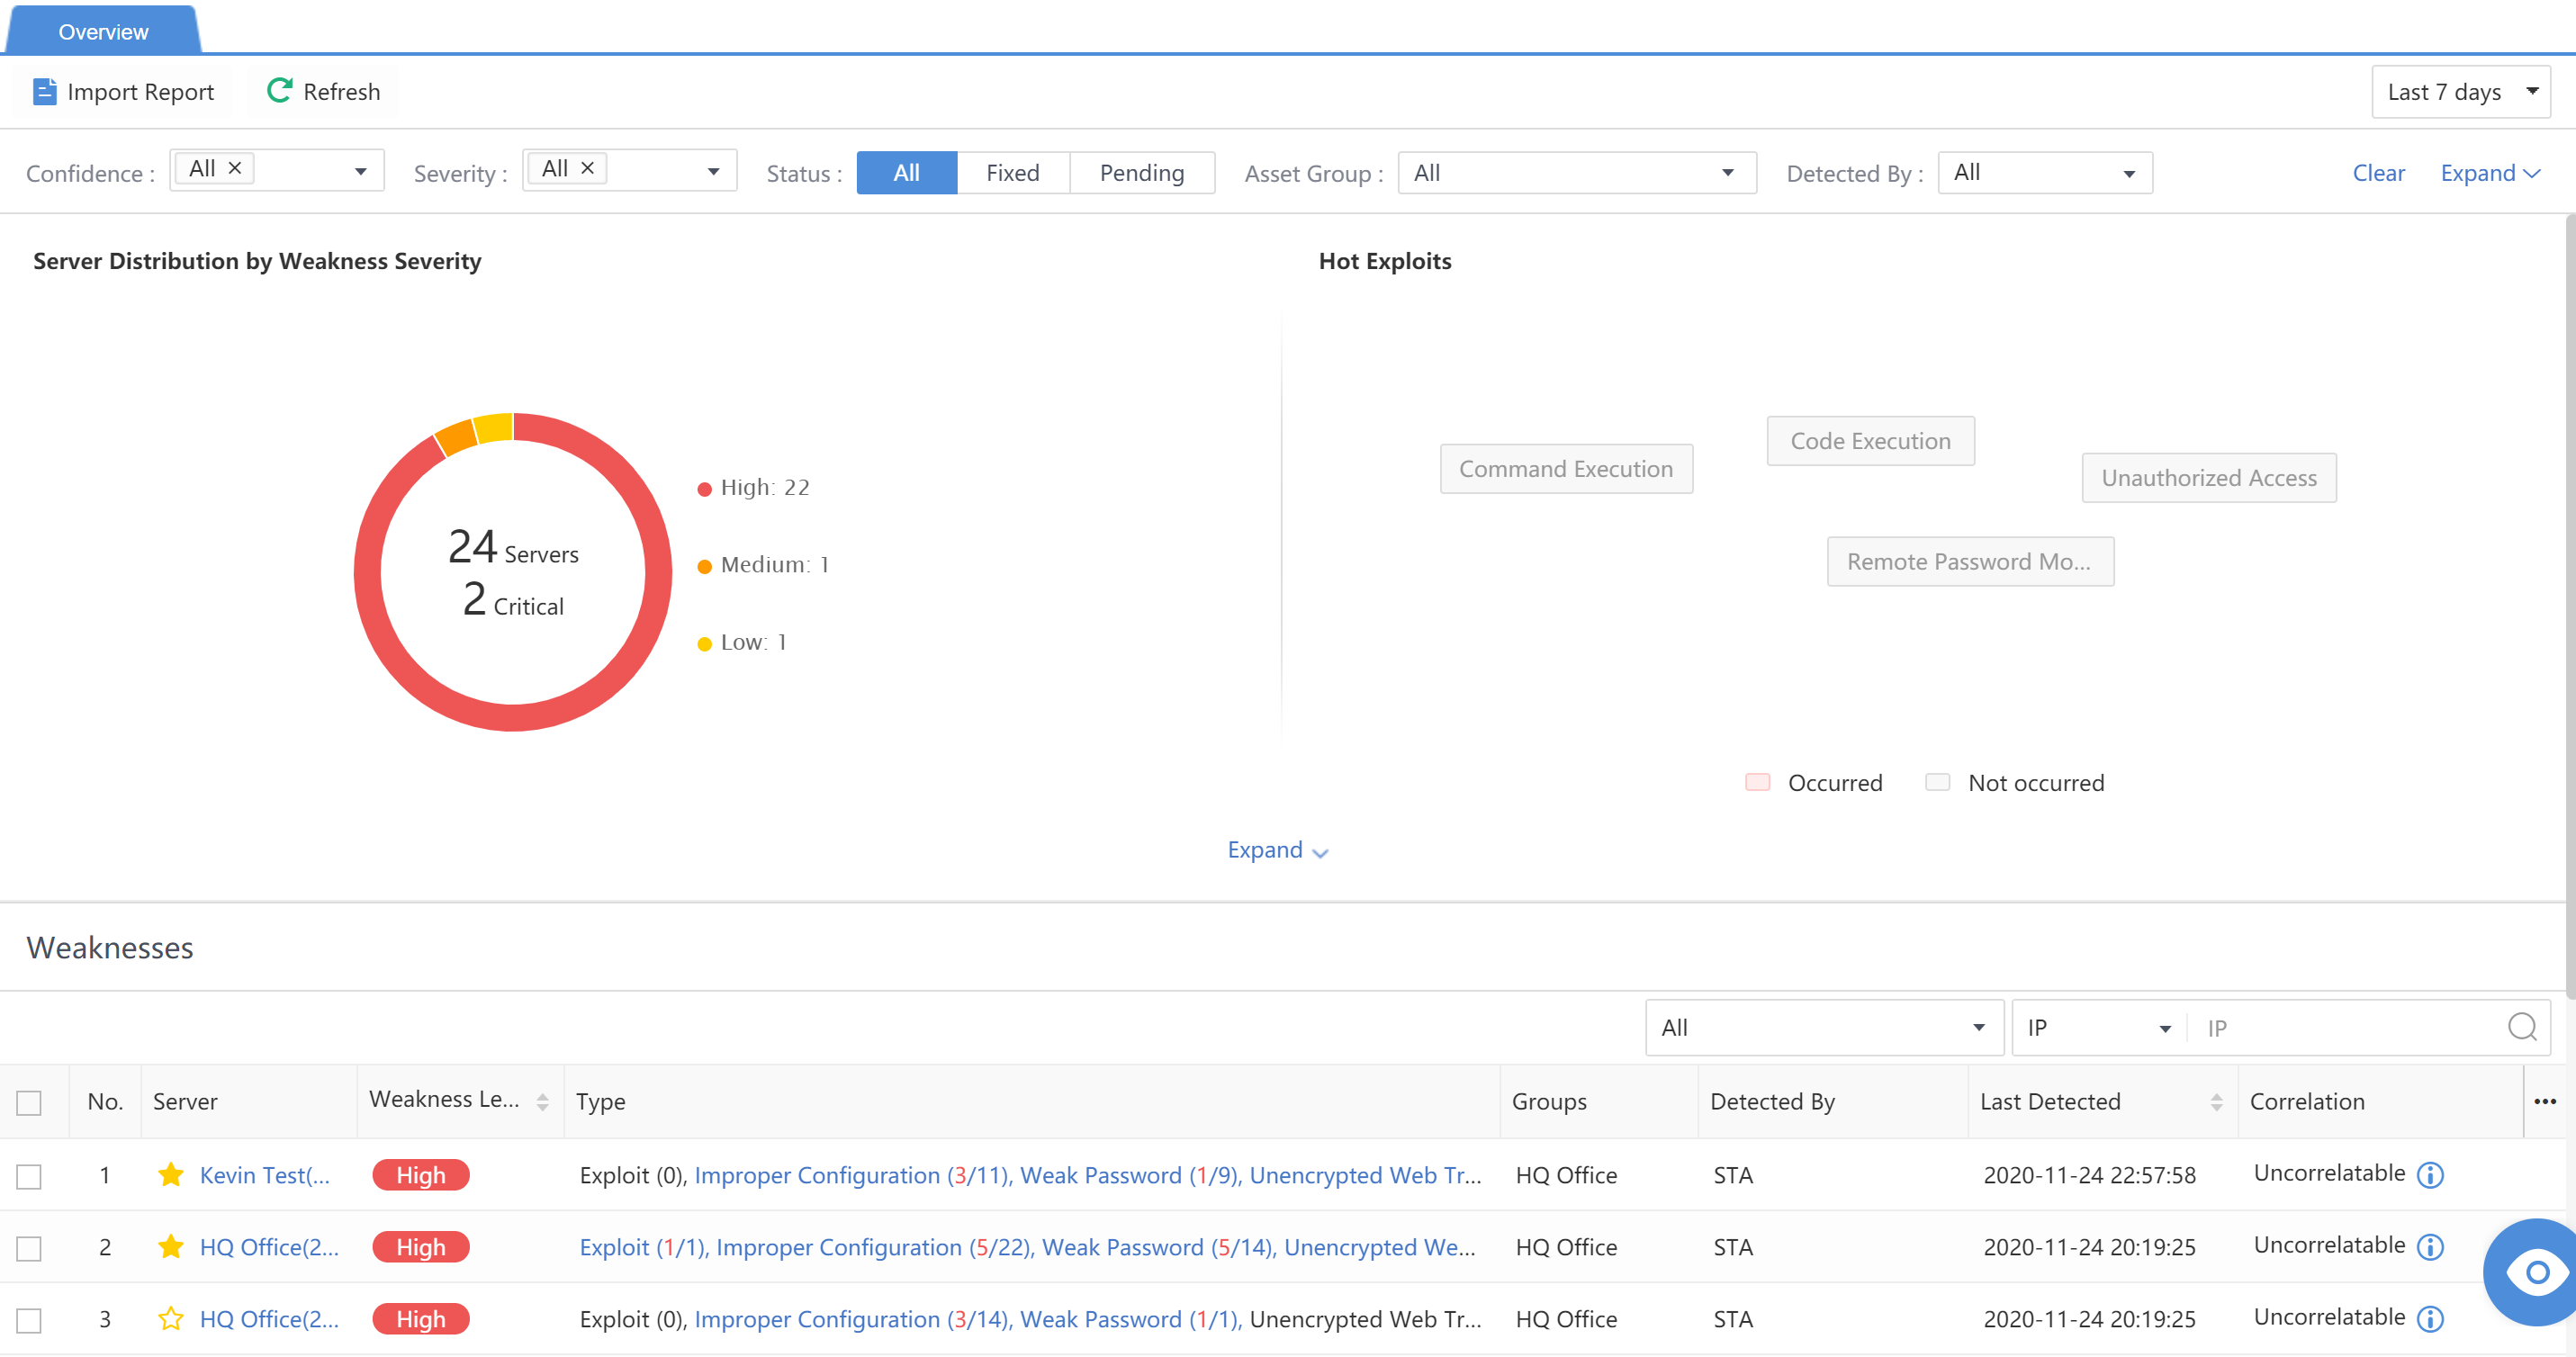
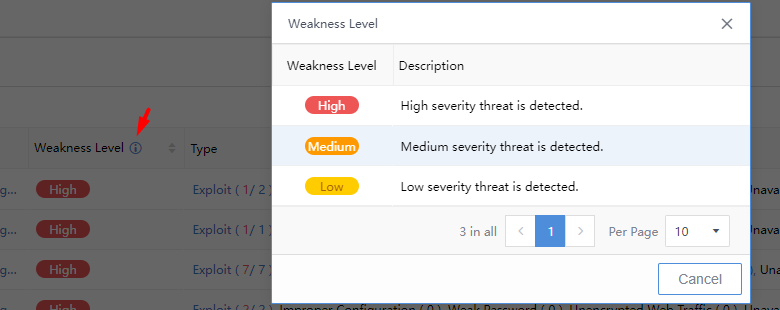
Weakness Level:Display the weakness level as High, Medium, or Low. Click to view the definition and description, as shown below:

HotExploits:Refer to common vulnerabilities. The vulnerabilities in red exist in the network.
-
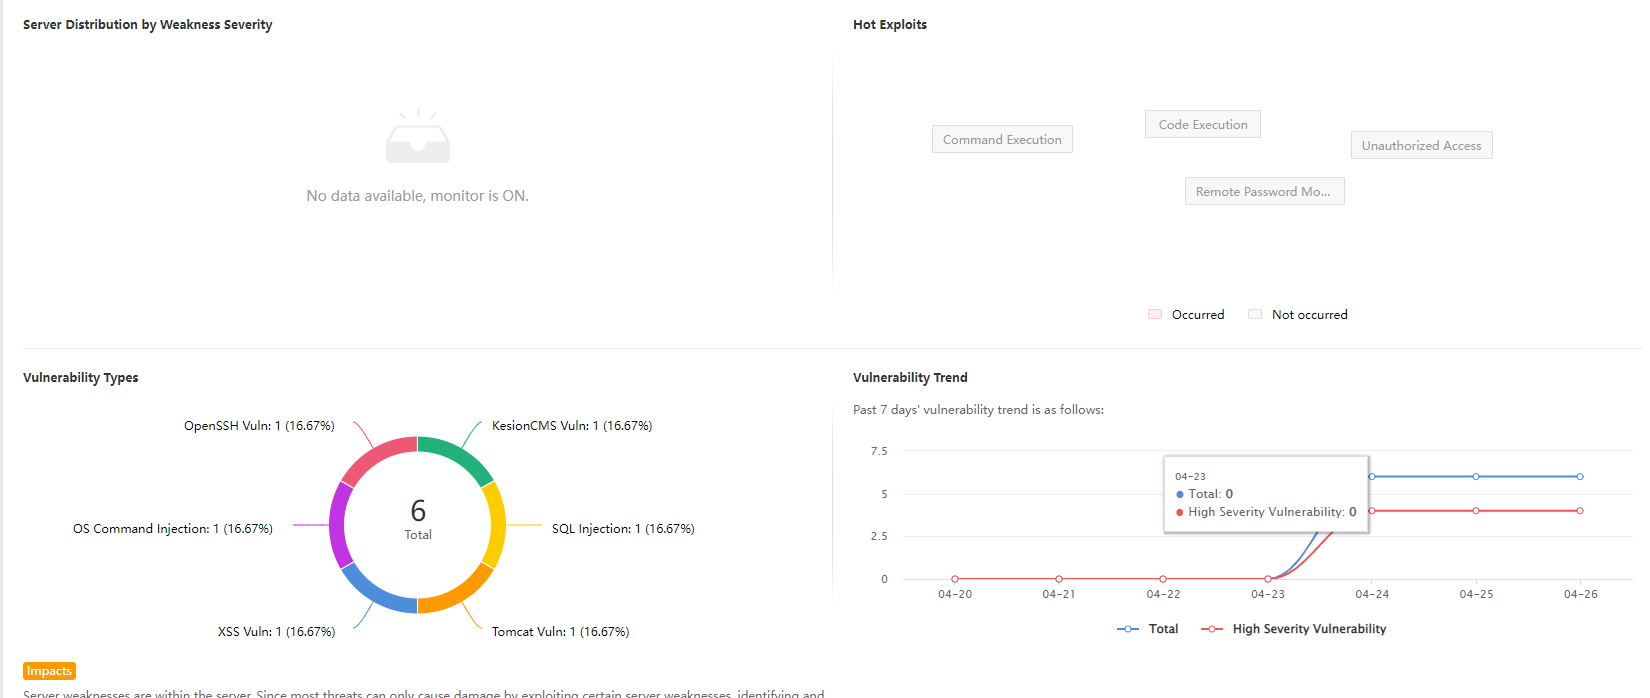
Vulnerability Types:Count and display the types and quantity of discovered vulnerability types.
-
Vulnerability Trend:Display the trend of the total number of discovered vulnerabilities and the number of high-severity vulnerabilities in a timeline.
Select the type of weaknesses from the Type drop-down list, including Exploit,Improper Configuration,Weak Password,Unencrypted Web Traffic, and Unavailability.
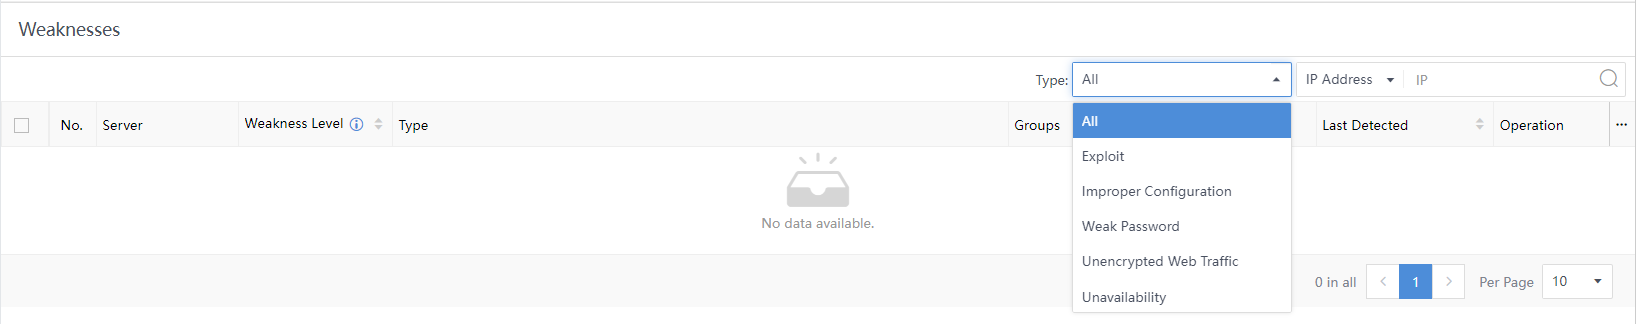
Last Detected: Refer to the time the weakness in the business system was last detected.
Click the Asset Name to view the weakness details of this IP address in the Last 30 days, Last 7 days, or Last 24 hours.
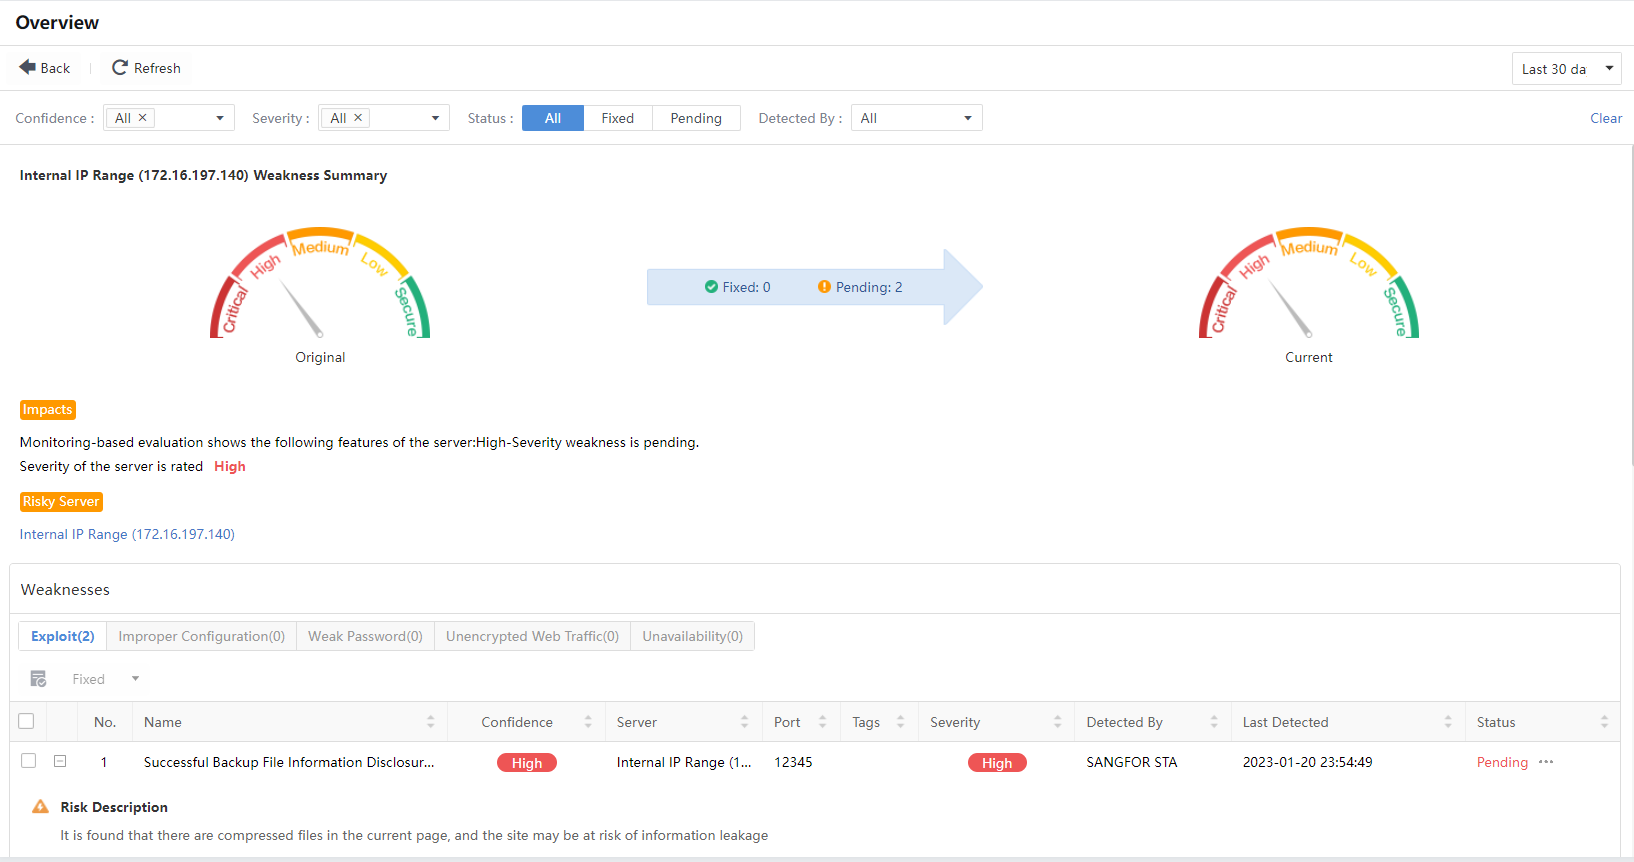
You can view the severity of vulnerability in the host, as well as security recommendations and descriptions.
The weaknesses details are divided into five types: Exploit,Improper Configuration,Weak Password,Unencrypted Web Traffic, and Unavailability.
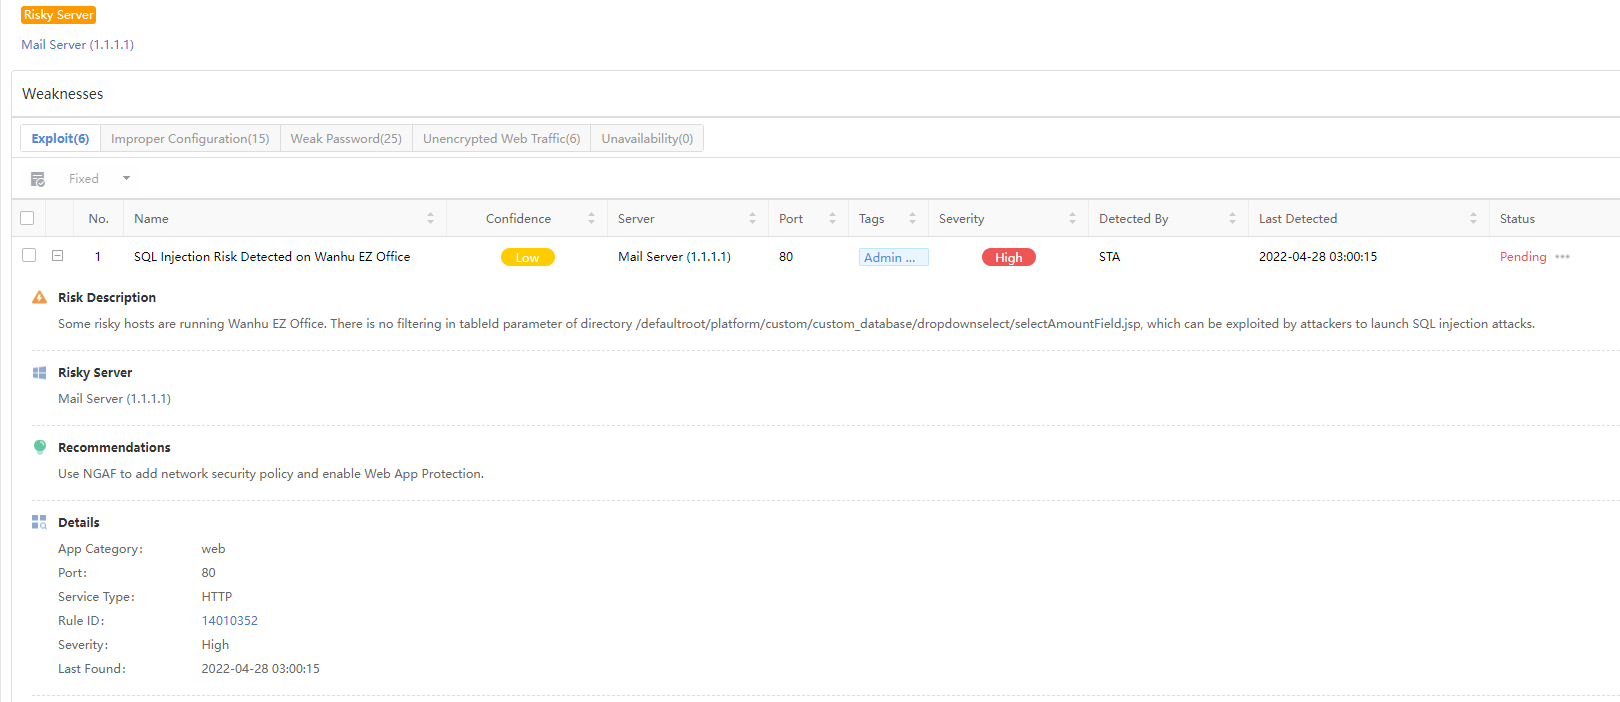
Name:Refer to the name and CVE information of the vulnerability.
Server:Refer to the IP address information of the server.
Port:Refer to the port with the vulnerability.
Tags:Refer to the tag information of the vulnerability.
Severity:Refer to the severity of the vulnerability.
Last Detected: Refer to the time when this vulnerability was discovered.
Status:Refer to whether the vulnerability is fixed, and this status shall be manually marked.
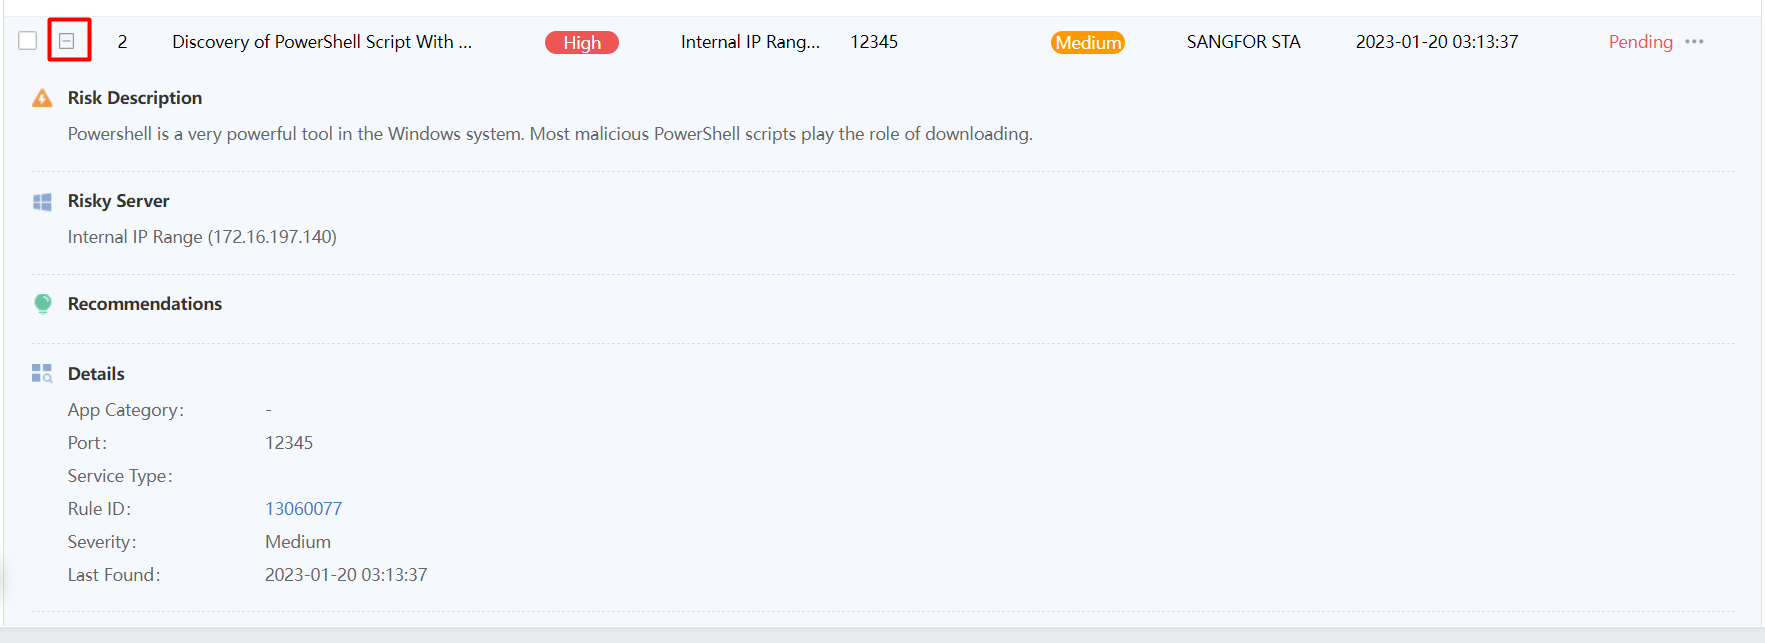
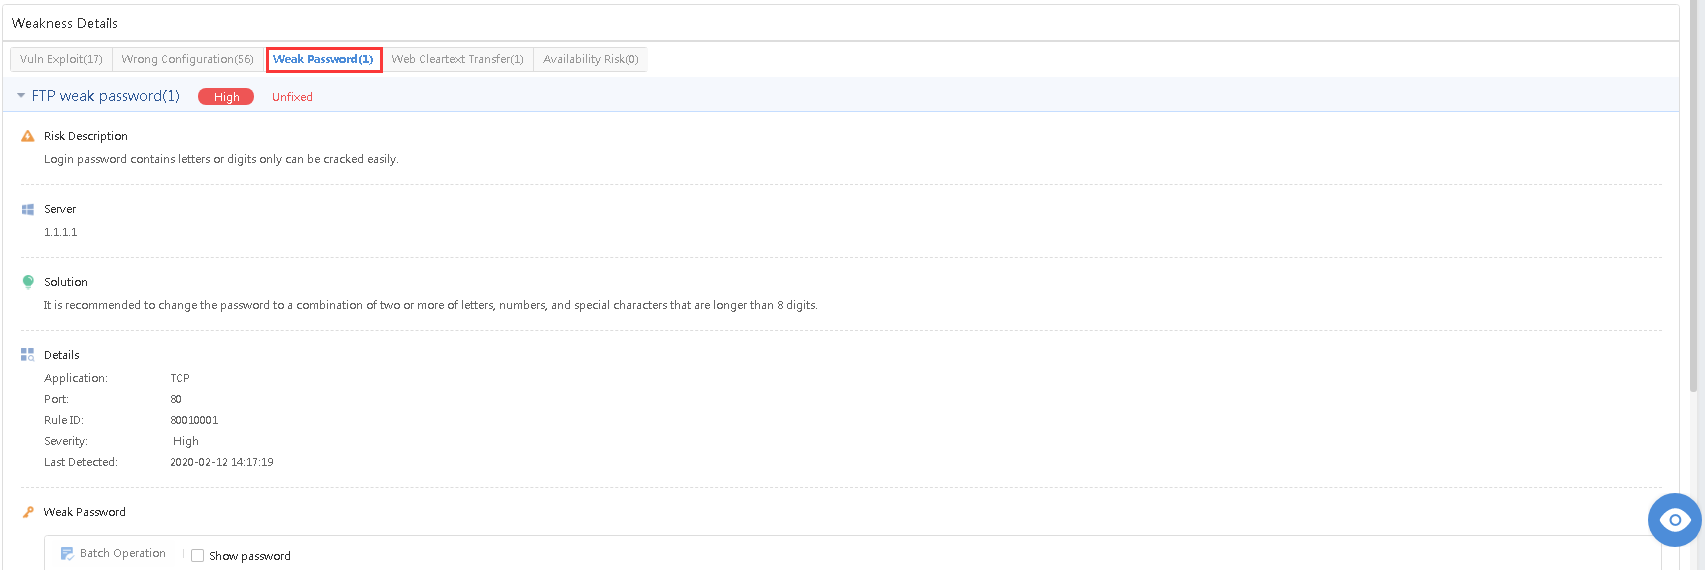
Click +on the left side of the vulnerability to unfold the detailed description of this vulnerability, including Risk Description, Risky Server, Recommendations, Details, and Vulnerability Proof.
Click +on the left side of the vulnerability to unfold the detailed description of this vulnerability, including Risk Description, Server, Solution, Details,and Vulnerability Proof.
Click Weak Password to view Risk Description, Risky Server, Recommendations,Details, and Weak Accounts.
Click Unencrypted Web Traffic to view URL,Confidence,Data Packet Proof,Last Detected,Status,and Operation.
Vulnerabilities
Administrators can view Vulnerabilities by Severity,Top 5 Vulnerable Asset Group, and vulnerability detection list from the vulnerability perspective. You can search for the vulnerability by Vulnerability name or CVE through the search bar.
The administrator can specify the time range (Last 24 hours,Last 7 days,Last 30 days,or Custom). Meanwhile, you can further filter by keywords such as Confidence, Severity, Status, etc., as shown below.
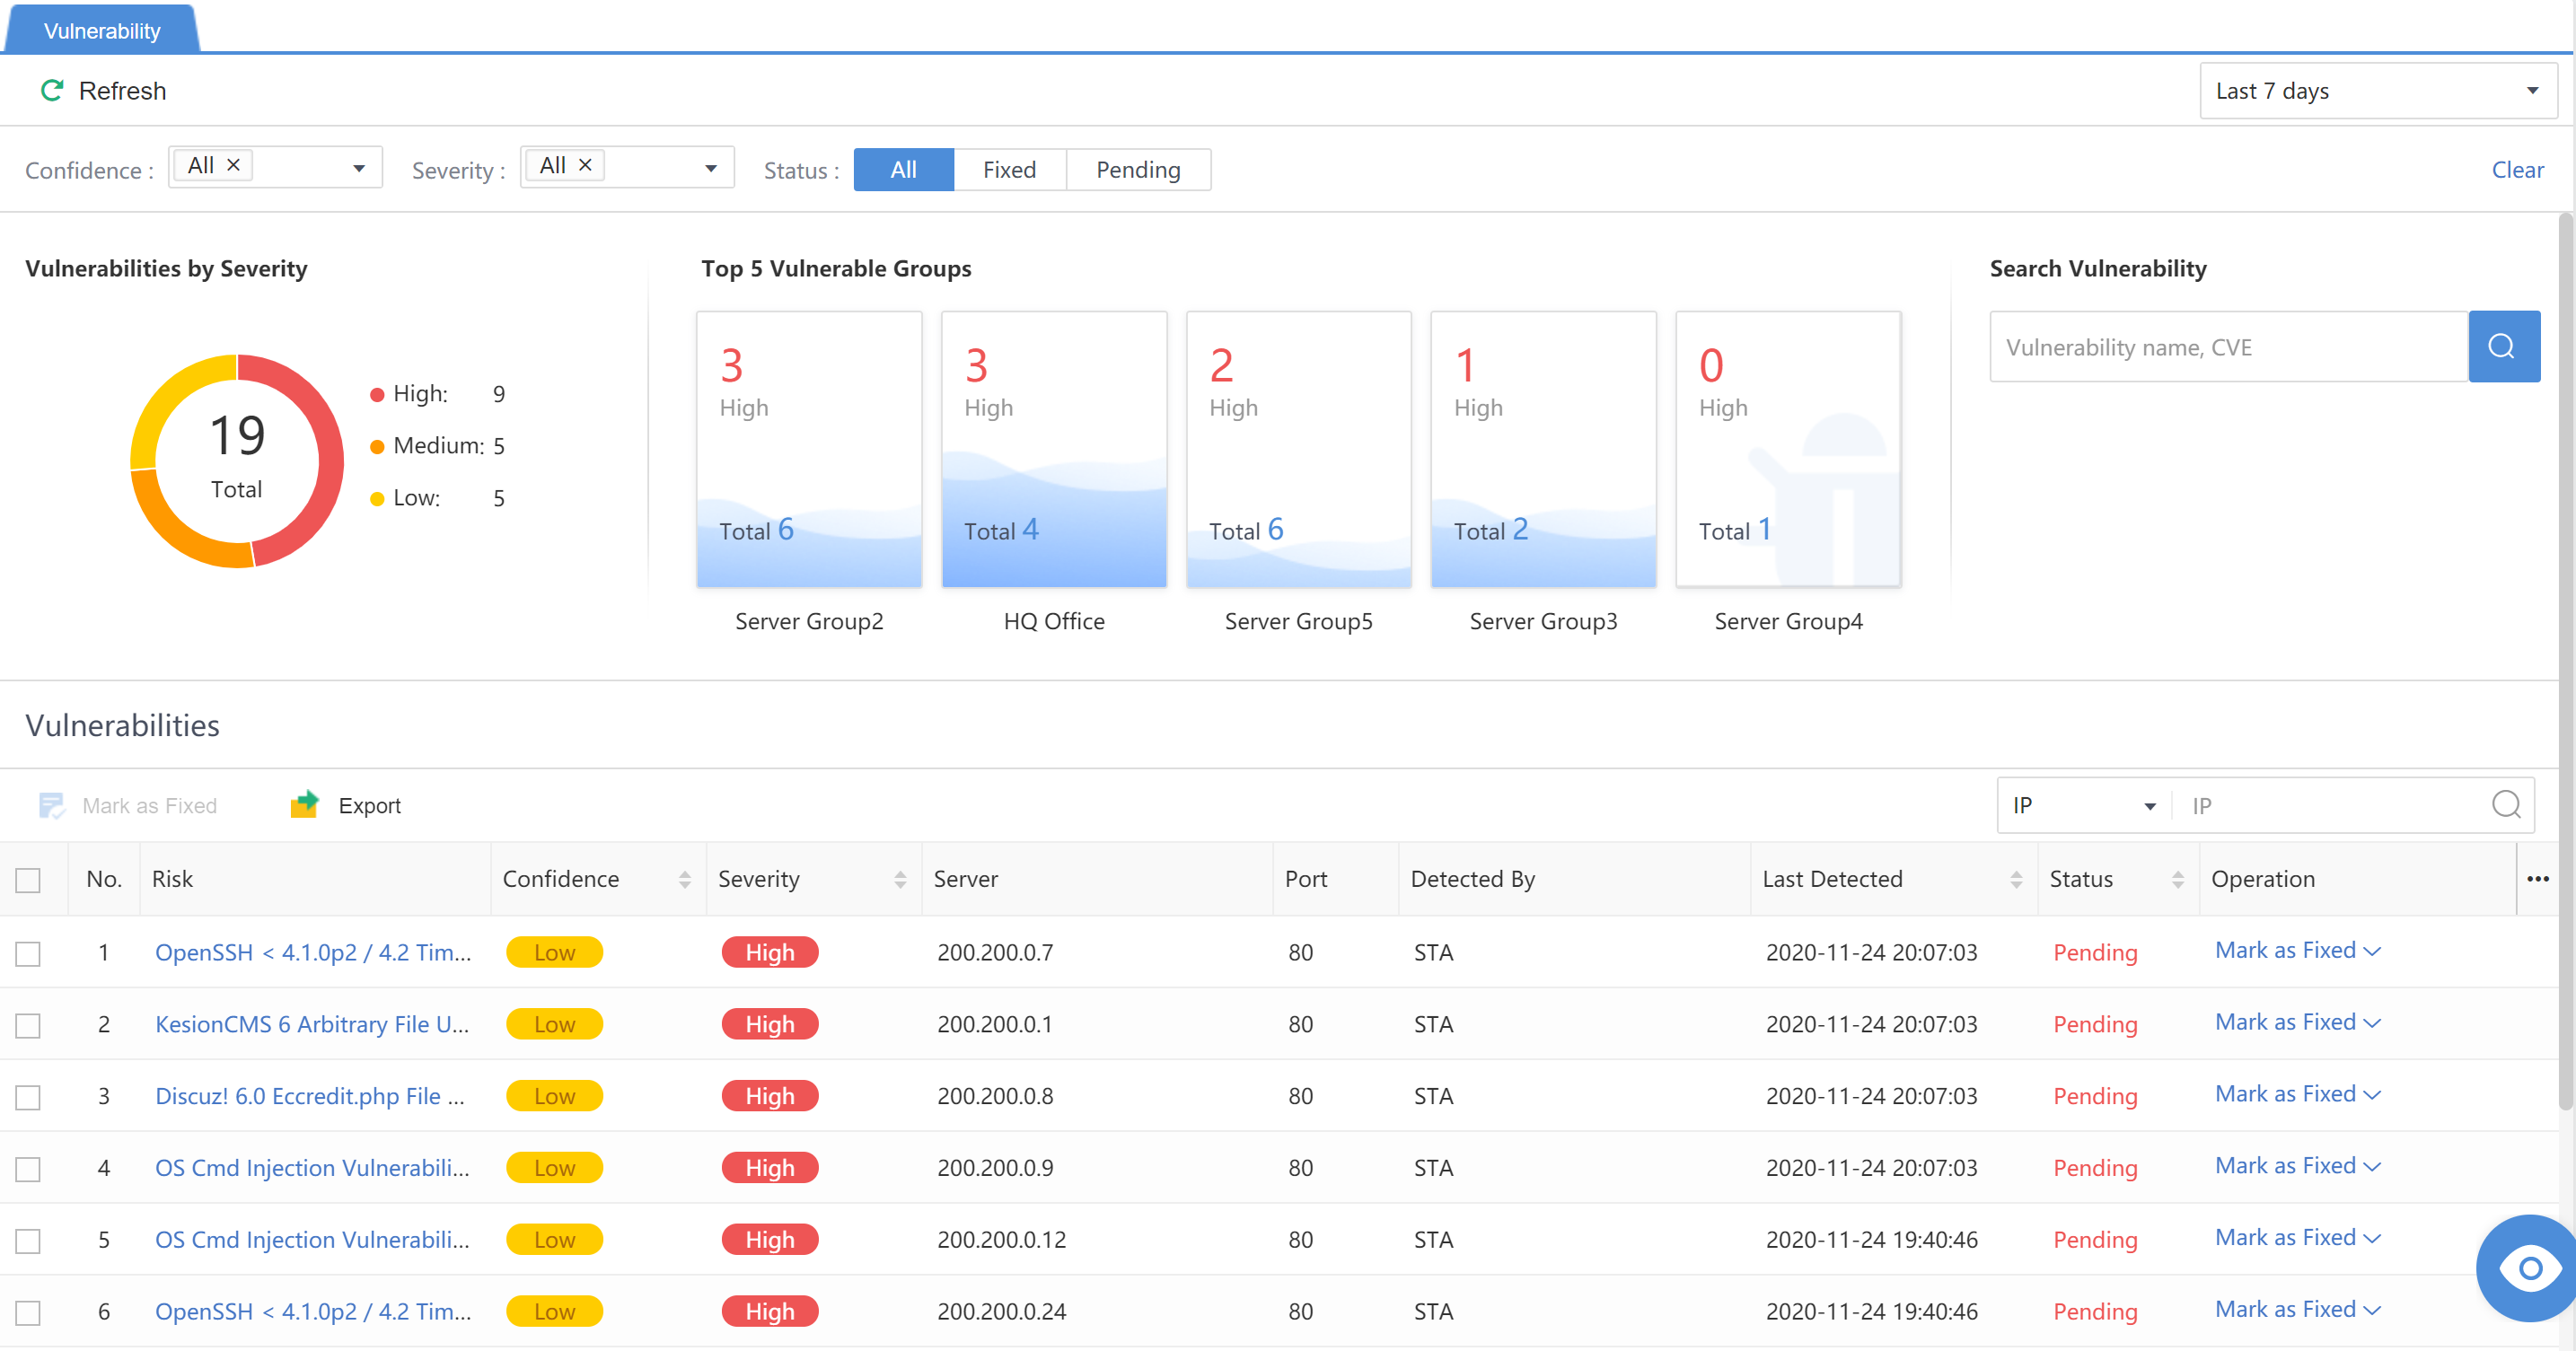
Vulnerabilities by Severity: Statistically display the distribution of High, Medium, and Low-risk vulnerabilities found.
Top 5 Vulnerable Asset Group: Show the Top 5 groups with the most vulnerabilities and emphasize the number of high-risk vulnerabilities.
Search Vulnerability: The administrator can enter the vulnerability name or CVE to query the vulnerability detection results.
Vulnerabilities: You can filter by IP, Name, or CVE ID. The administrator can click the specific risk name to view the vulnerability details. The vulnerability can be marked in the Operation column, as shown in the figure below.
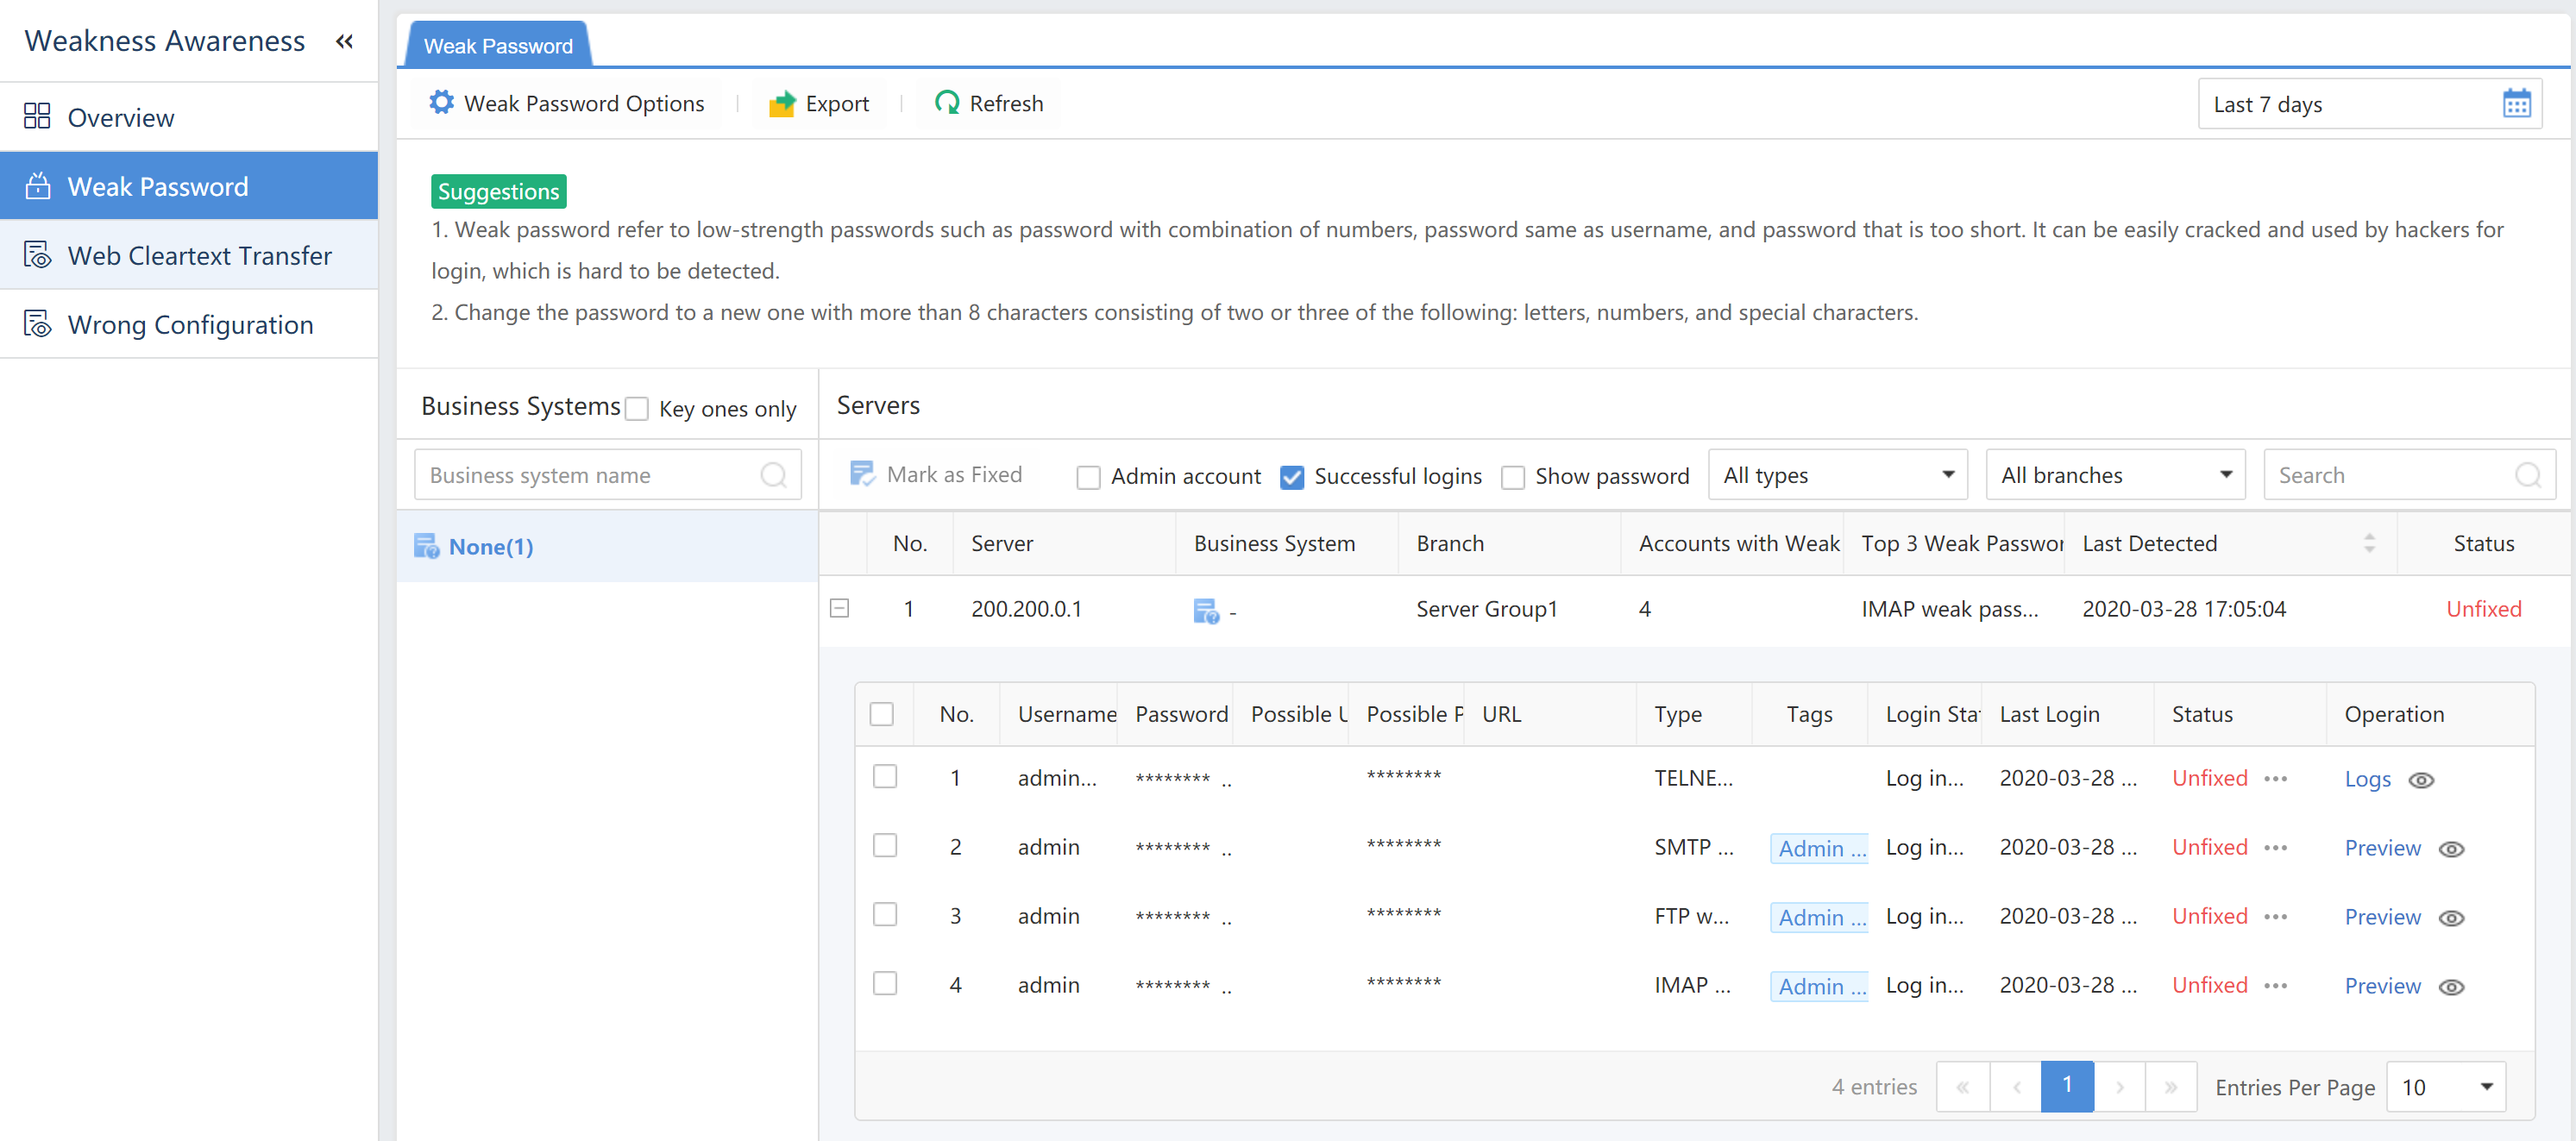
Weak Password
A weak password refers to a low-strength password, such as a simple combination of numerals, the same as the account, or a short length. A weak password can be easily cracked and used by hackers. Therefore, legitimate accounts and passwords can be used for login control and have higher confidentiality.
Filter the weak password by selecting the period, Criticality, Account Type, and Login Status.
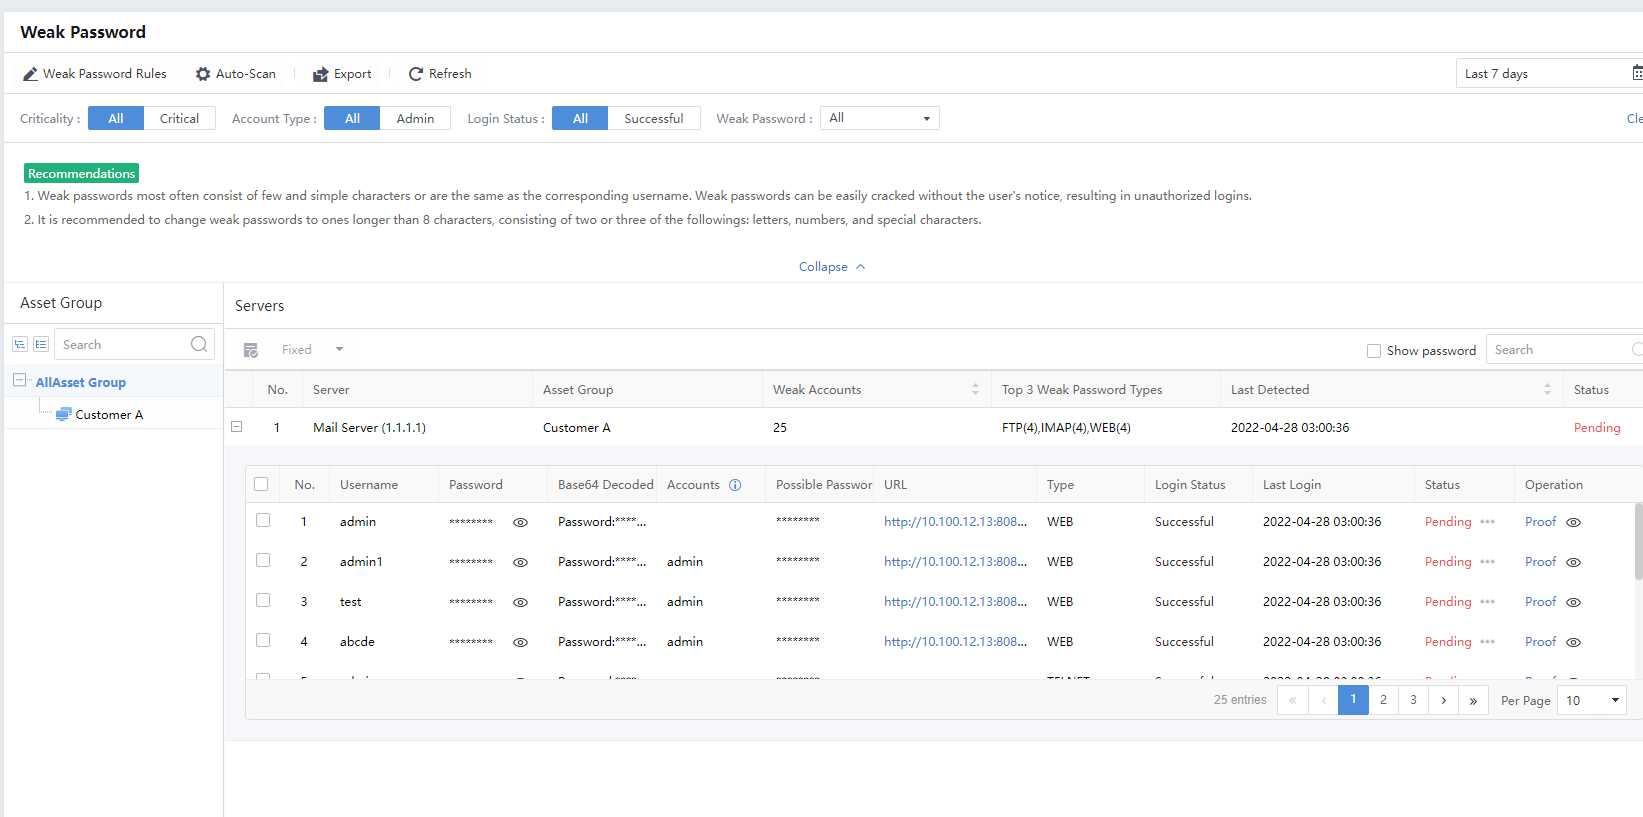
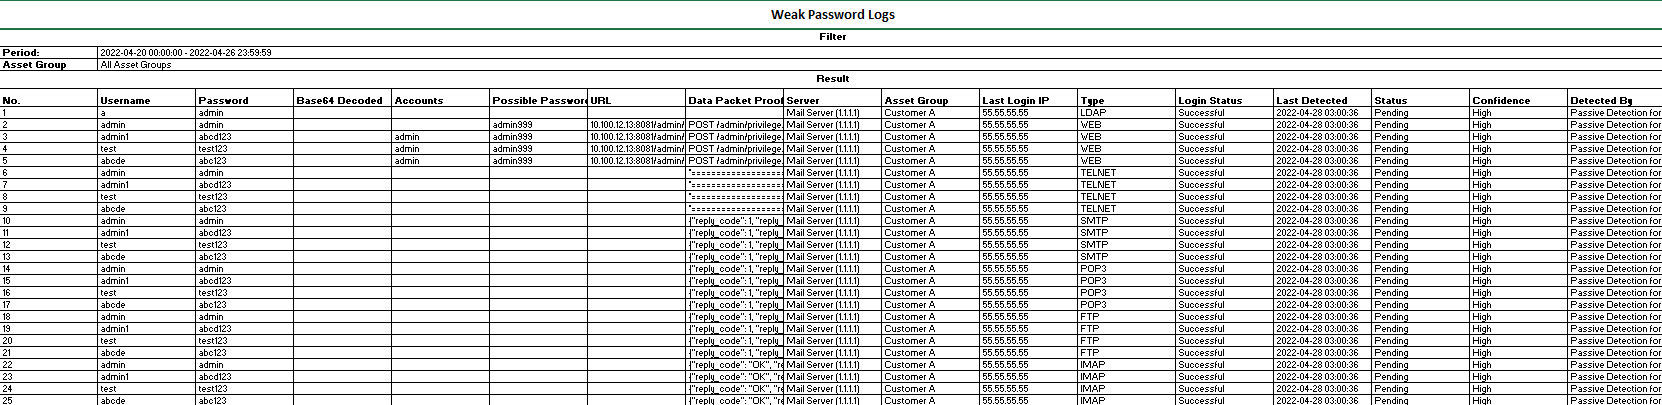
Click Export to export the weak password logs as a compressed package. Enter the Admin Password and Unzip Password to proceed.
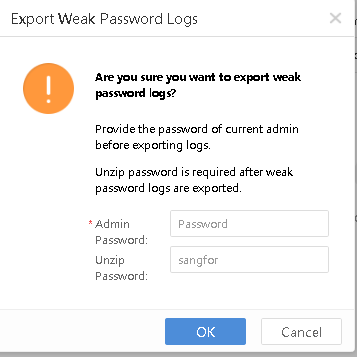
Export to obtain the compressed package with the unzipped password, i.e., sangfor.
When it is required to view a successfully logged-in account, check Successful logins .
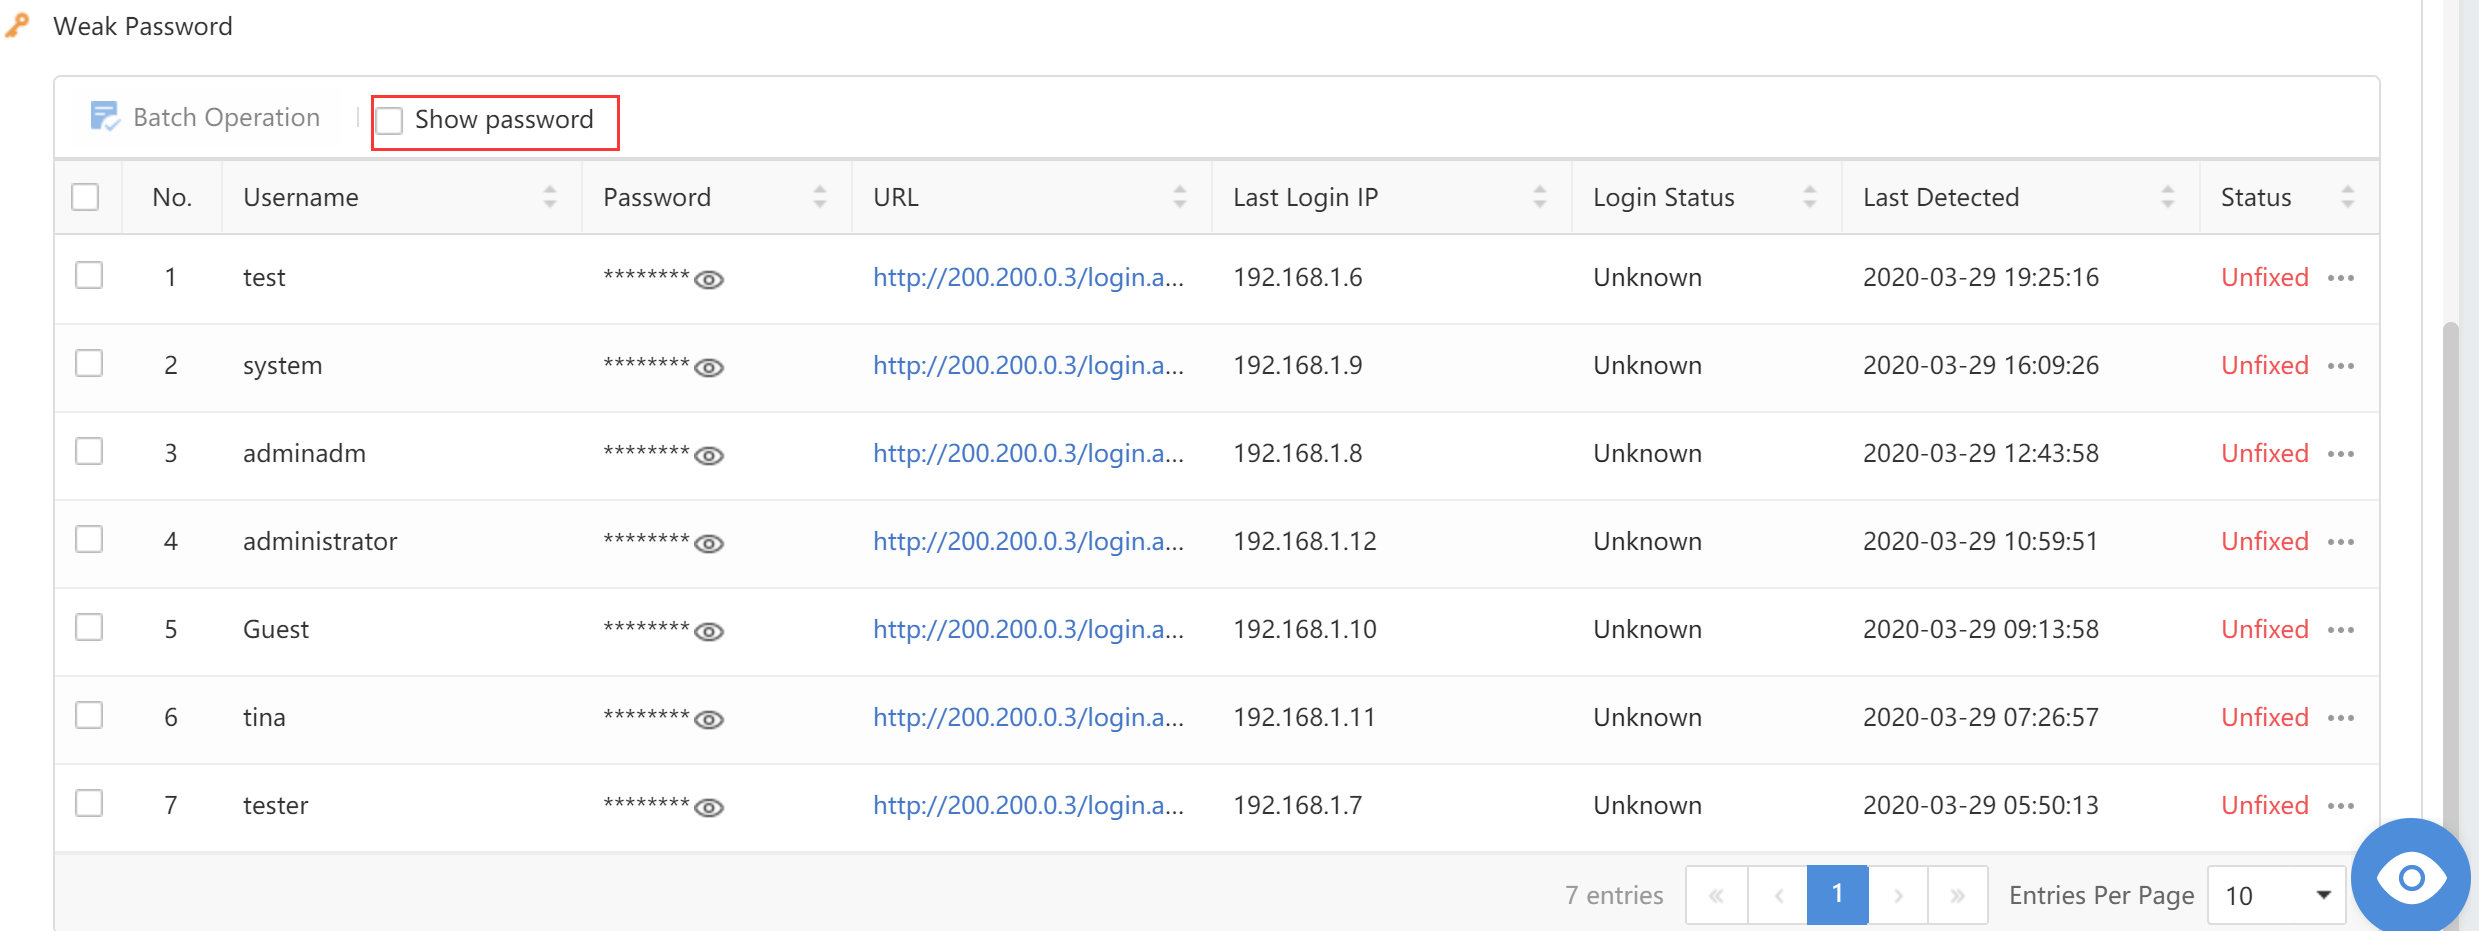
To view the password on the platform, checkthe Show password checkbox . You will see the following dialog box pop up:
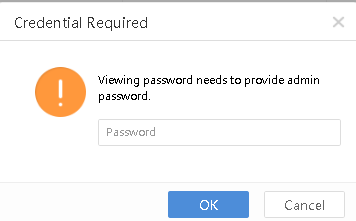
Enter the admin password to view the account password.
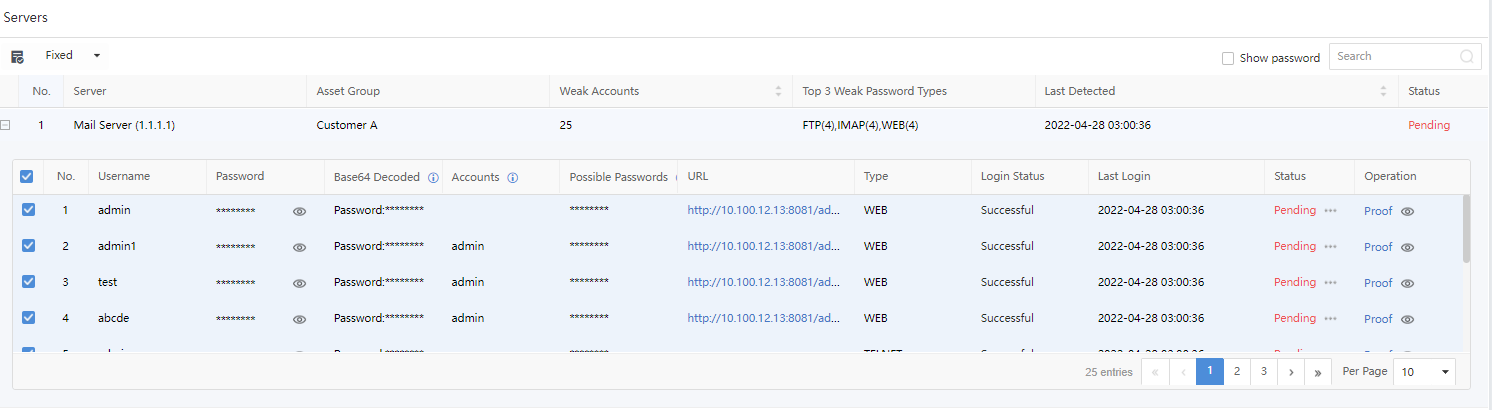
Username:Refer to the account with a weak password.
Password:Refer to the weak password of an account.
Base64 Decoded: Refer to the password in Base64 Decoded.
Accounts: Refer to the password’s account.
Possible Passwords:Refer to the possibility of the password.
URL:Refer to the URL with a weak password if the platform is a web application.
Type:Refer to types of weak passwords, including WEB, FTP, and LDAP.
Login Status:Refer to whether the platform is successfully logged in. The status includes Succeeded, Failed, and Unknown.
Last Login:Refer to the last time logging in by using the account.
Status:Refer to whether the weak password is fixed. If yes, manually mark the status as Fixed.
Operation:Click Proof to view the proof.
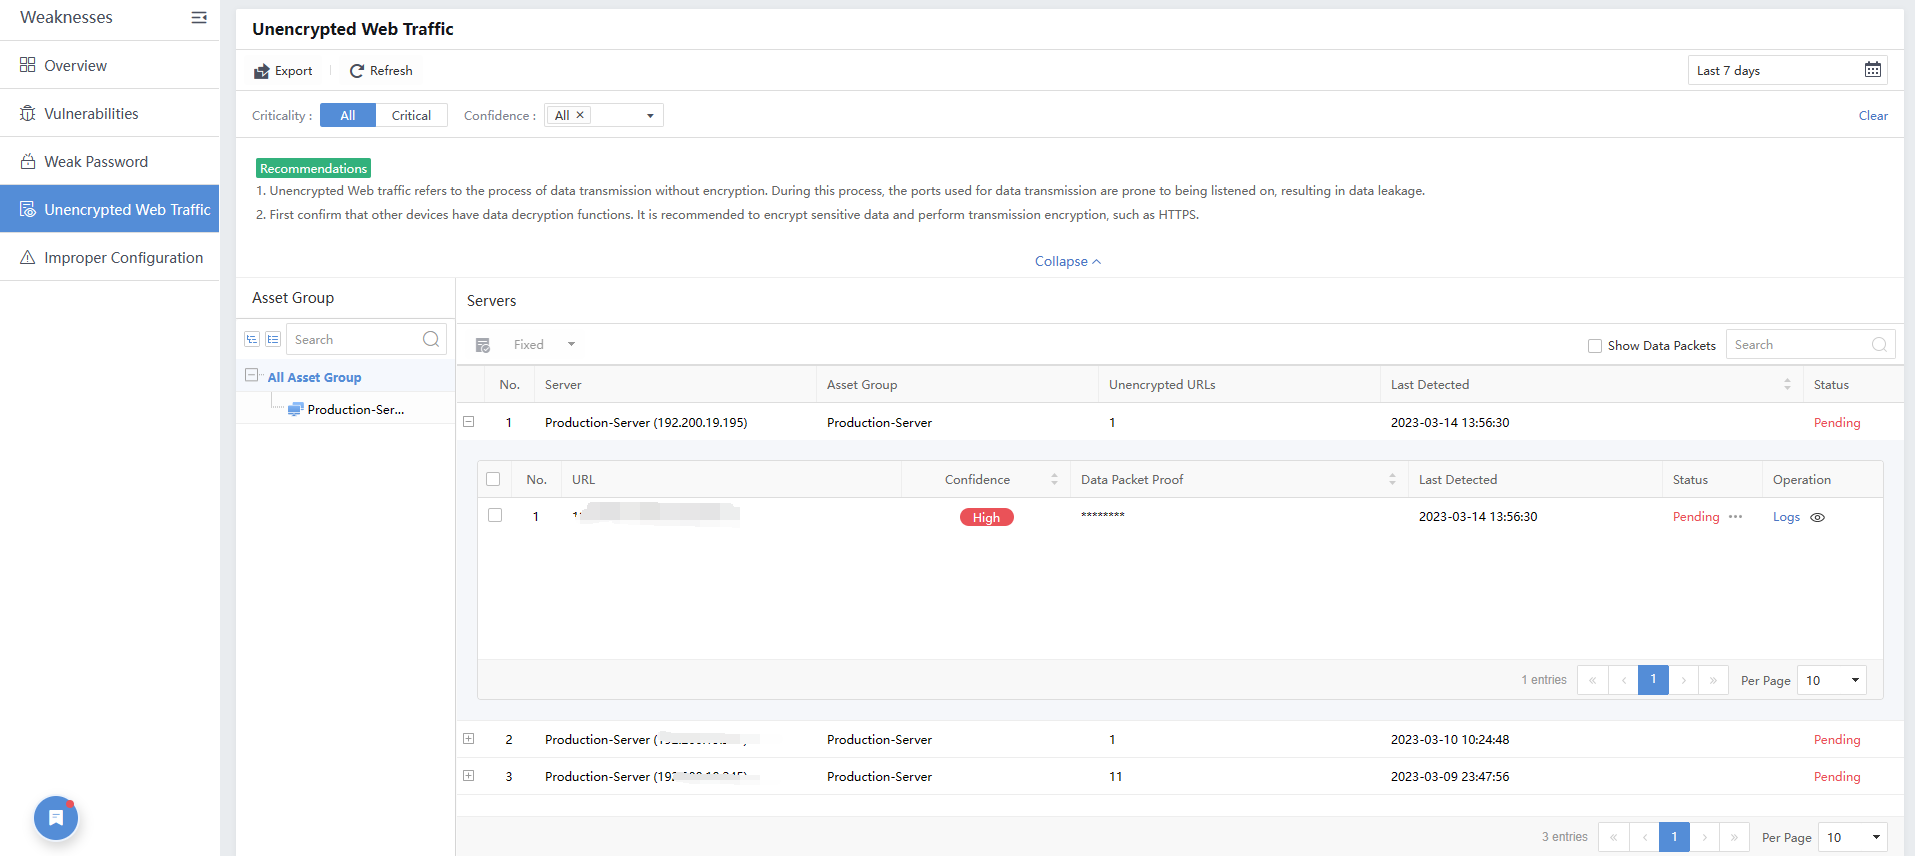
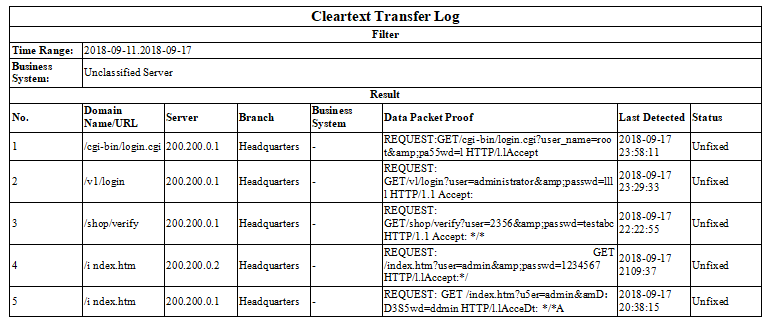
Unencrypted Web Traffic
Unencrypted web traffic is a data transfer process without encryption. It is easy to get monitored to cause a data breach.
Filter the unencrypted web traffic by selecting the period, Criticality,or Confidence.
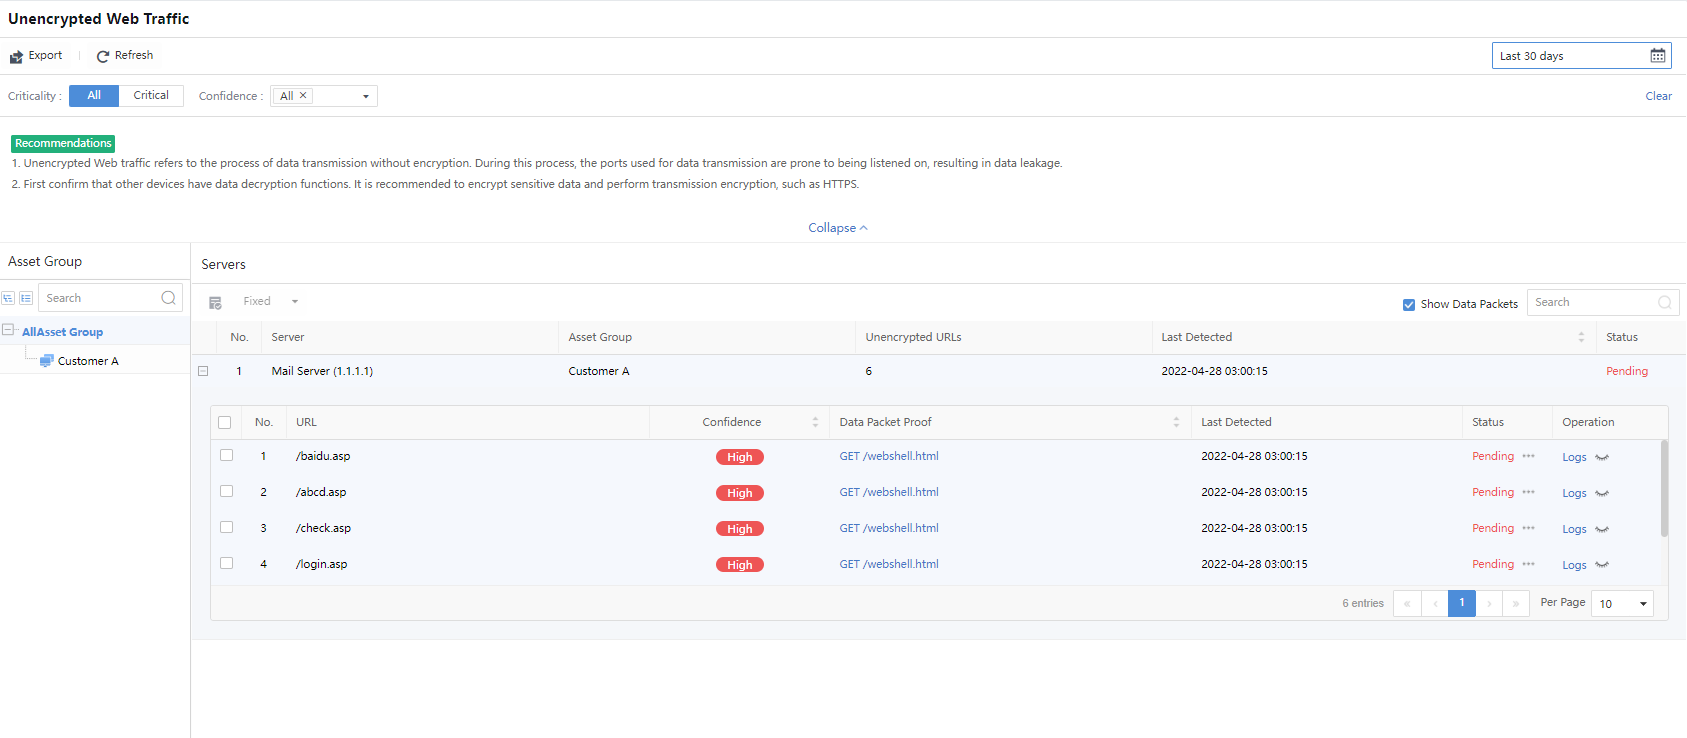
Server:Refer to the IP address information of the server with unencrypted web traffic.
Asset Group:Refer to the group to which the server belongs.
Unencrypted URLs:Show the number of unencrypted URLs.
Last Detected:Refer to the last occurrence time of unencrypted web traffic.
Status:Refer to whether the weak password is fixed. If yes, manually mark the status as Fixed.
Operation:Click View Log to redirect to Detection > Logs, and then the system automatically filters corresponding logs.
Click Export to export the information as a compressed package.
Improper Configuration
A risky port is when the service has opened to the Internet for remote login or remote file transfer. If a weak password exists for the service corresponding to the open port, it is easy for criminals to blast and log in to control the server directly, causing data loss or server damage. After the criminals control the server, they can penetrate other internal network hosts.
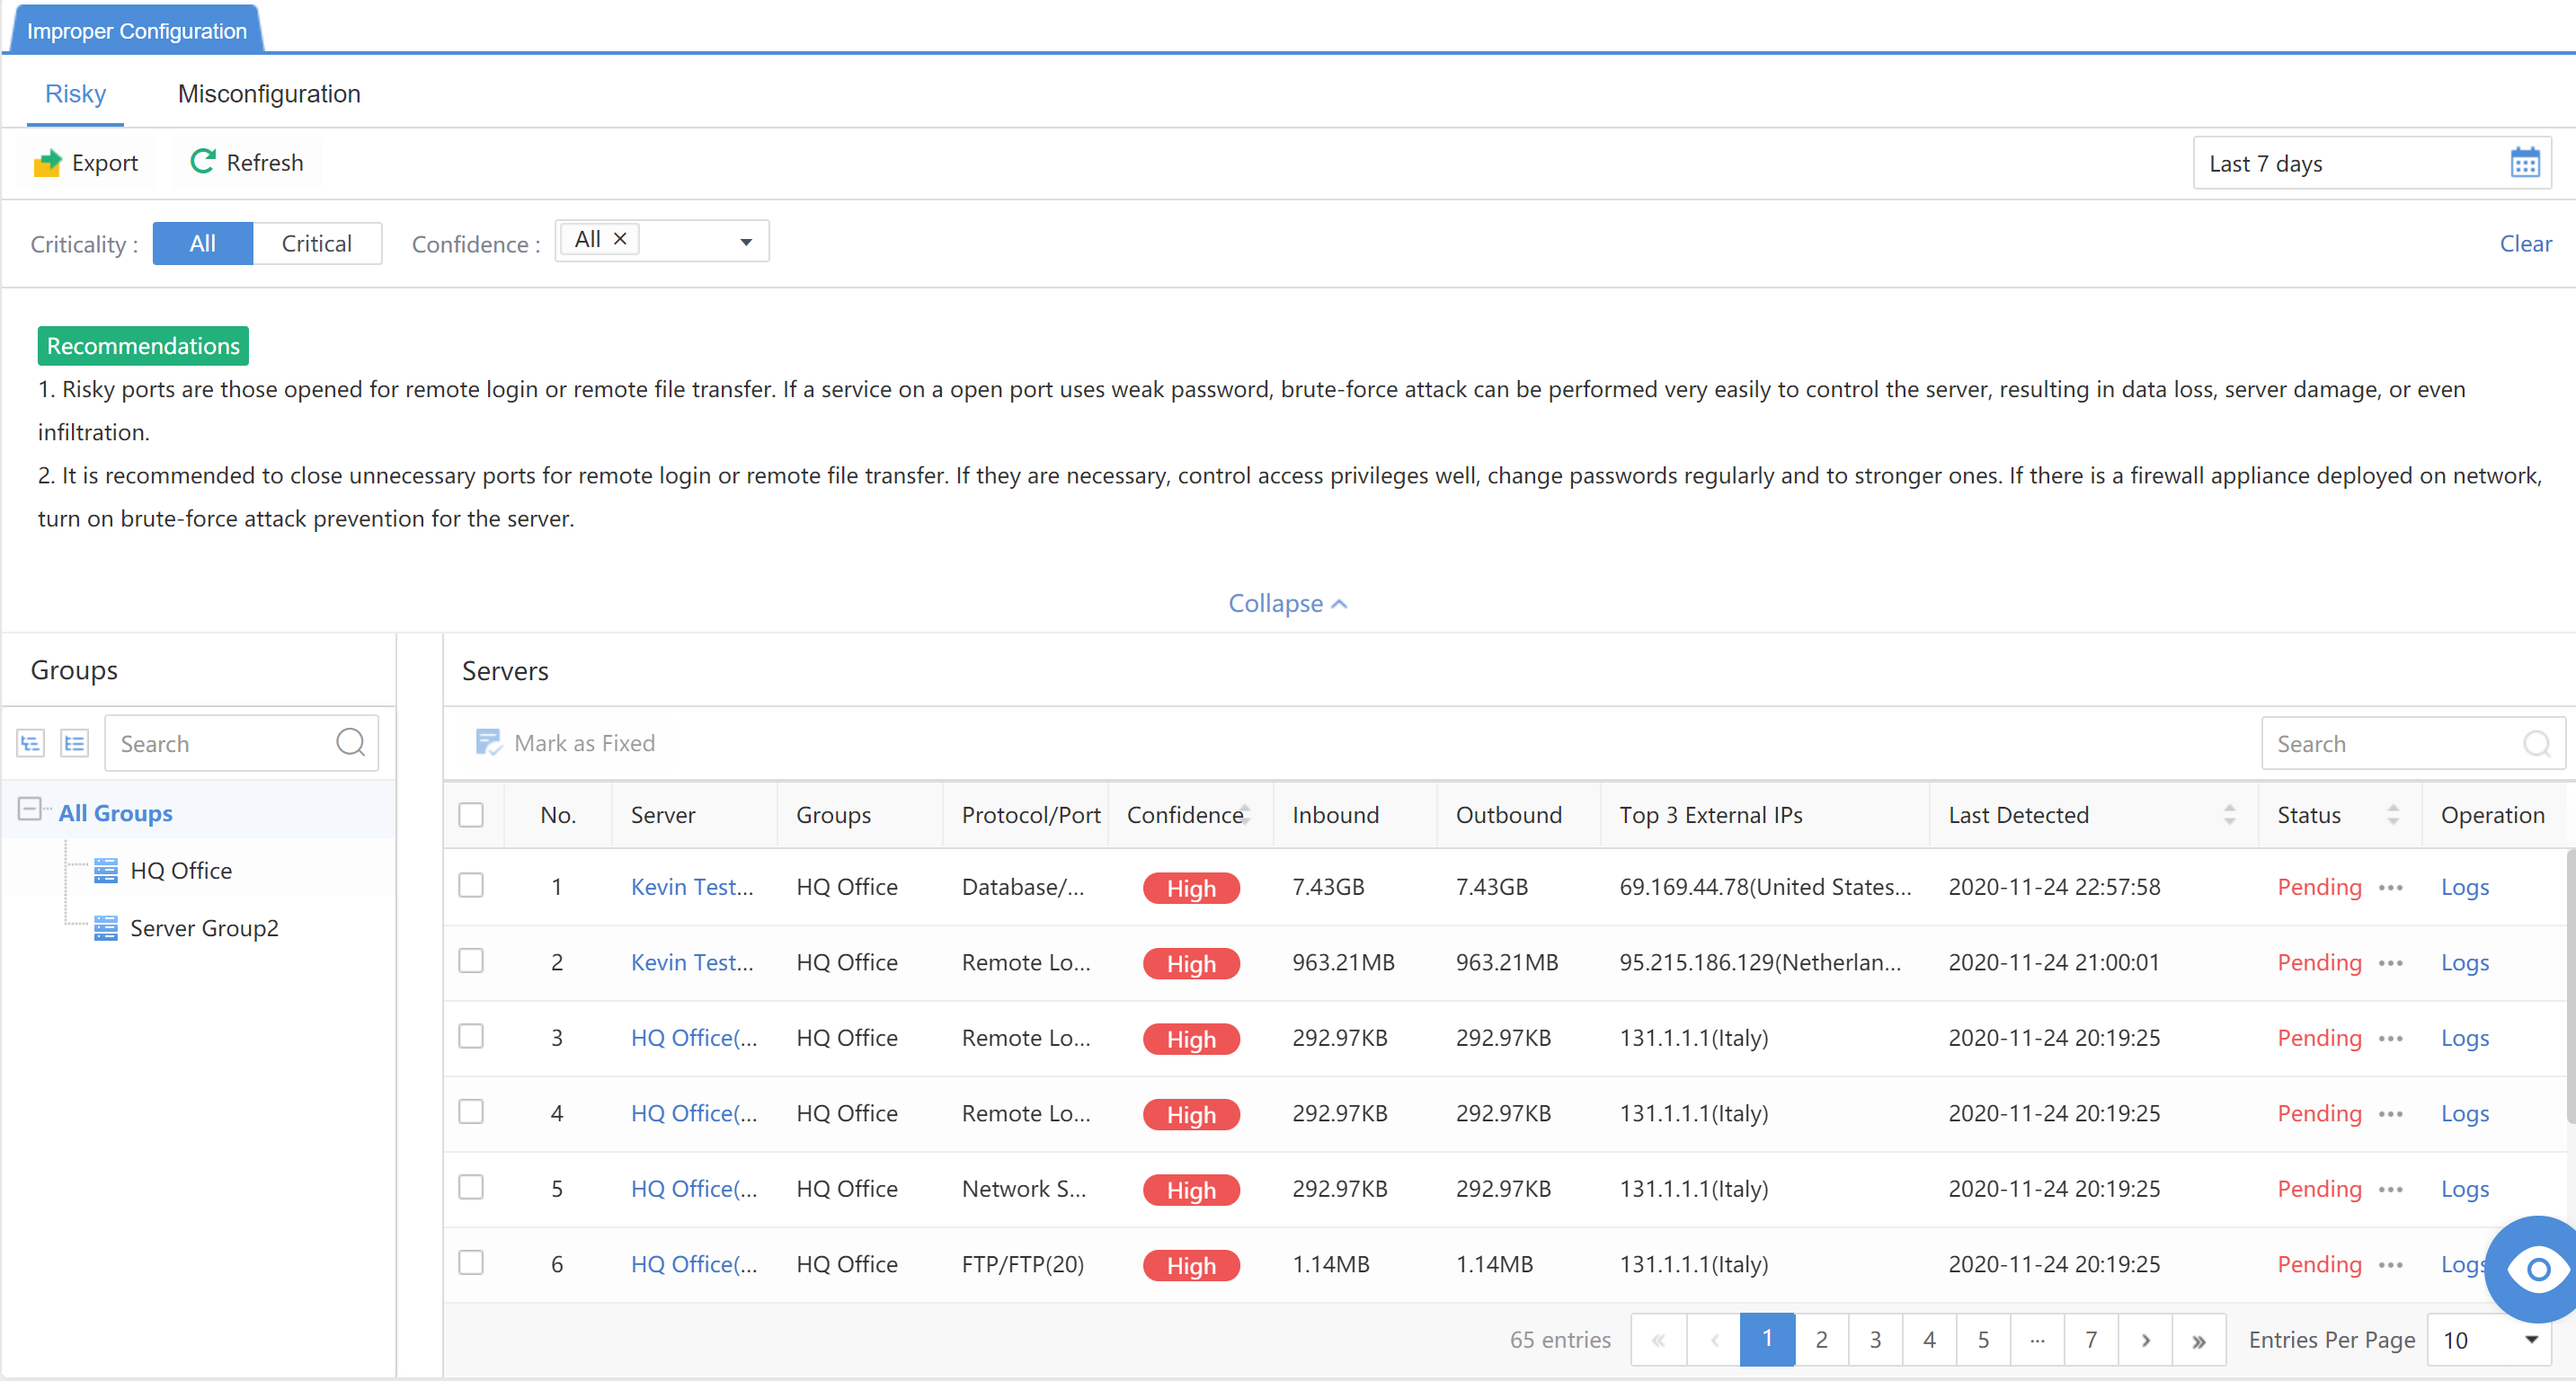
Server:The IP address of the server is at risk of configuration.
Asset Group: All groups of the server.
Protocol/Port:The detected risky port.
Confidence:The degree of confidence of the risky port.
Inbound:The amount of detected inbound traffic.
Outbound:The amount of detected outbound traffic.
Top 3 External IPs:The internet IP accesses up to 3 risky port IPs.
Last Detected:The last detected time.
Status:Fixed, Fixing, Whitelist, or Suspend.
Operation:Click Logs to view the log.
Reports
The reports are divided into Security Risk Reports and Notification. The security risk reports show LAN’s security situations, and notification sends risky hosts or security incidents to the administrator in time.
Security Risk Reports
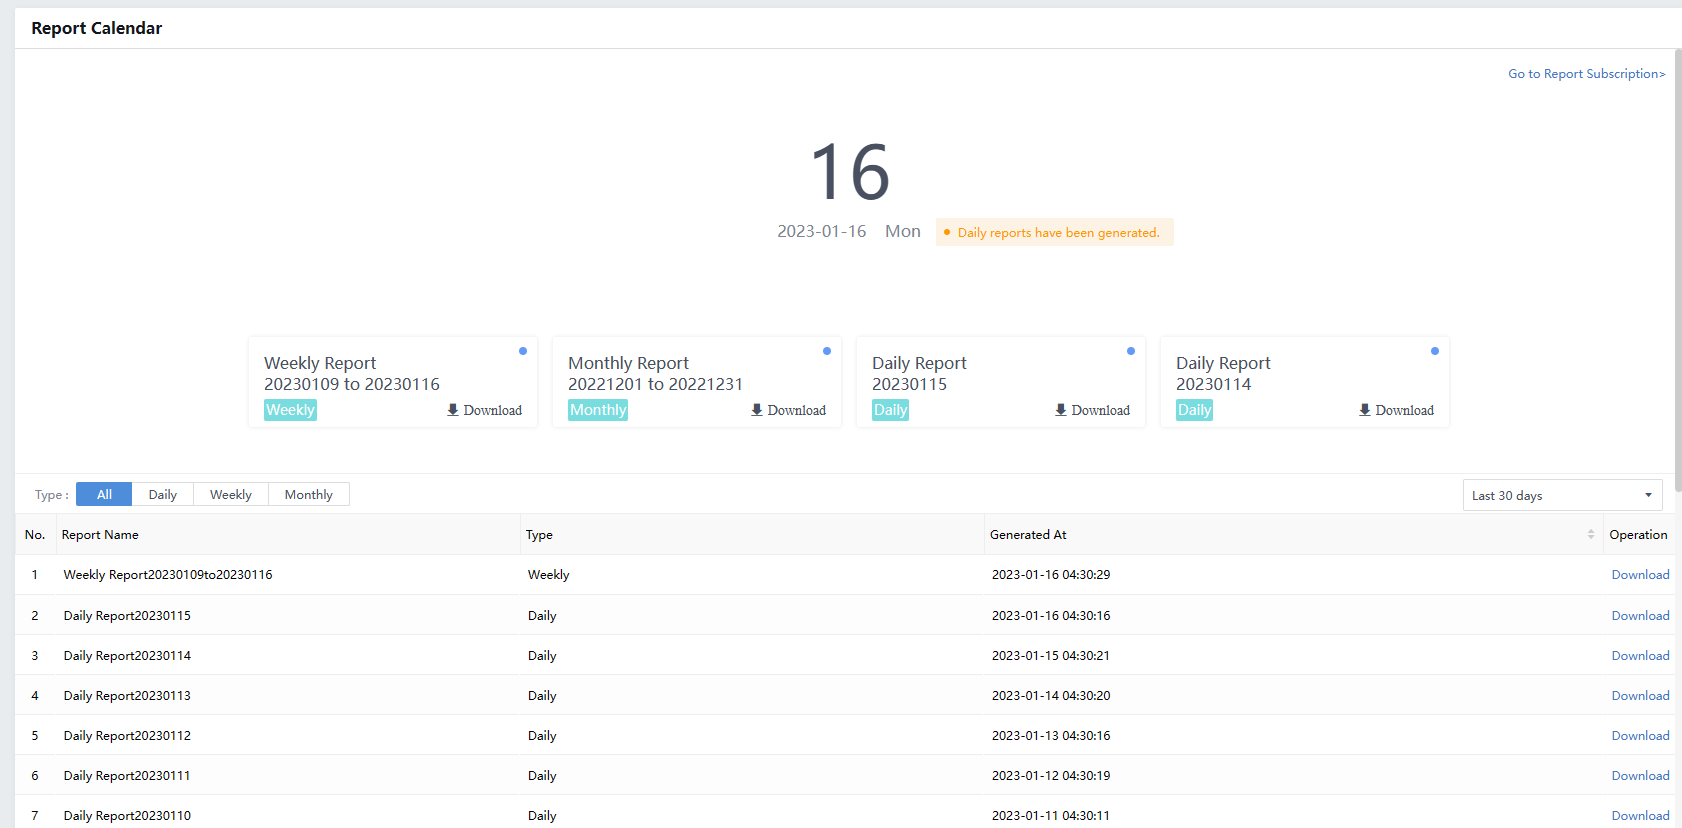
Report Calendar
Report Calendar generates reports based on a daily, weekly, and monthly basis.
The weekly report is generated every Monday for the previous week, and the monthly report is generated on the first day of each month.
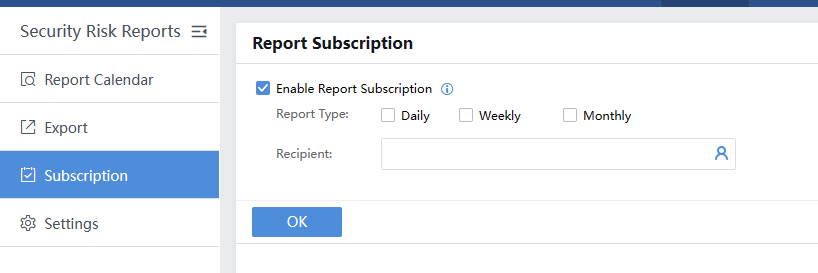
Subscription
You can subscribe to the daily, weekly, and monthly reports and send them to the recipient. Tick the Enable Report Subscription checkbox and choose the Report Type. Then, select the Recipient.
Export
Manually export Overall Security,Endpoint Security and Threat Response reports.
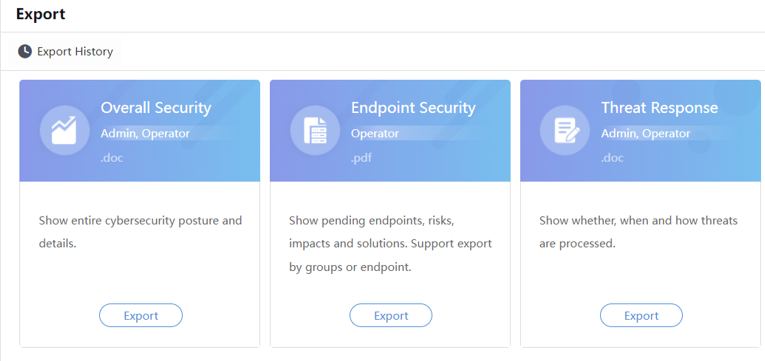
The Overall Security report applies to the administrator. It displays overall security statistics and situations in summary. Exporting reports per site (branch) is supported. The format of the report is doc.
The Endpoint Security report applies to the O&M personnel. It displays all risky hosts and detailed risk situations that need to be processed. It provides explanations and solutions for reference. Exporting reports per site (branch) and host is supported. The format of the report is pdf.
The Threat Response report applies to the administrator and operator. It shows whether, when, and how the threats proceeded. The format of the report is doc.
Click Export in the Overall Security section, then select the required details, as shown below:
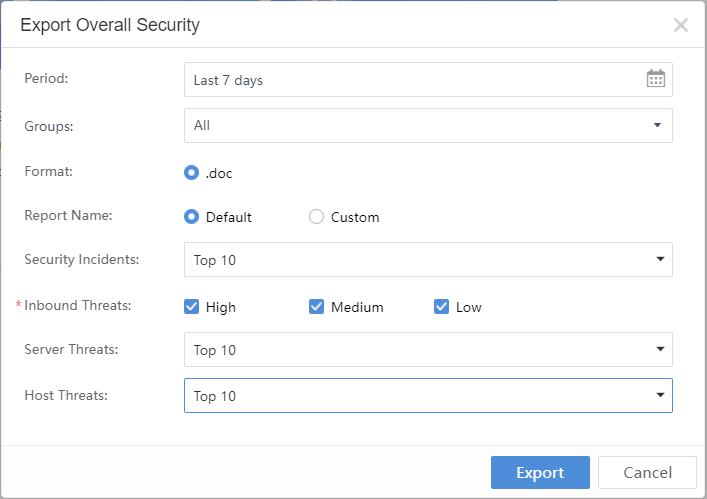
Period: Refer to the time range for report data statistics.
Groups:Include All, Specified IP Groups, and Specified IP Ranges.
Format: The format of the report is .doc.
Report Name: Use Default or Custom.
Security Incidents: Select Top 5, Top 10, Top 20, Top 50, or All.
Click Export in the Endpoint Security section and select the required details, as shown below:

Period:Refer to the time range for report data statistics.
Asset Group:Include All, Specified IP Groups, and Specified IP Ranges.
Format:The format of the report is .pdf.
Report Name:Use Default or Custom.
Items: By default, the content is the Latent Threat.The optional content includes Weakness.
Click Export in the Threat Response section and select the required details, as shown below:
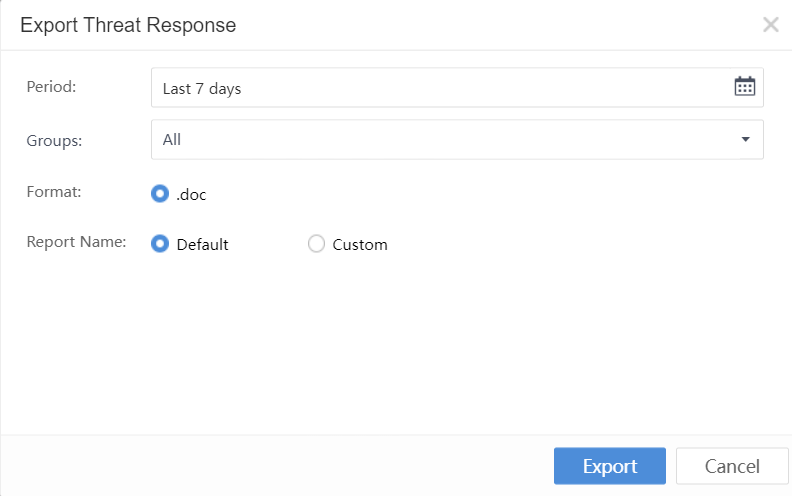
Period:Refer to the time range for report data statistics.
Asset Group:Include Specified IP Groups, Specified IP Ranges, and All.
Format:The format of the report is .doc.
Report Name:Use Default or Custom.
Notification
The notification module can meet the needs of customers who need to subscribe to and regularly push notifications so that operation and maintenance personnel can better understand the platform’s security status.
New Subscription
Navigate to Reports > Notification > Subscriptions. Click New to add a new subscription, as shown below:
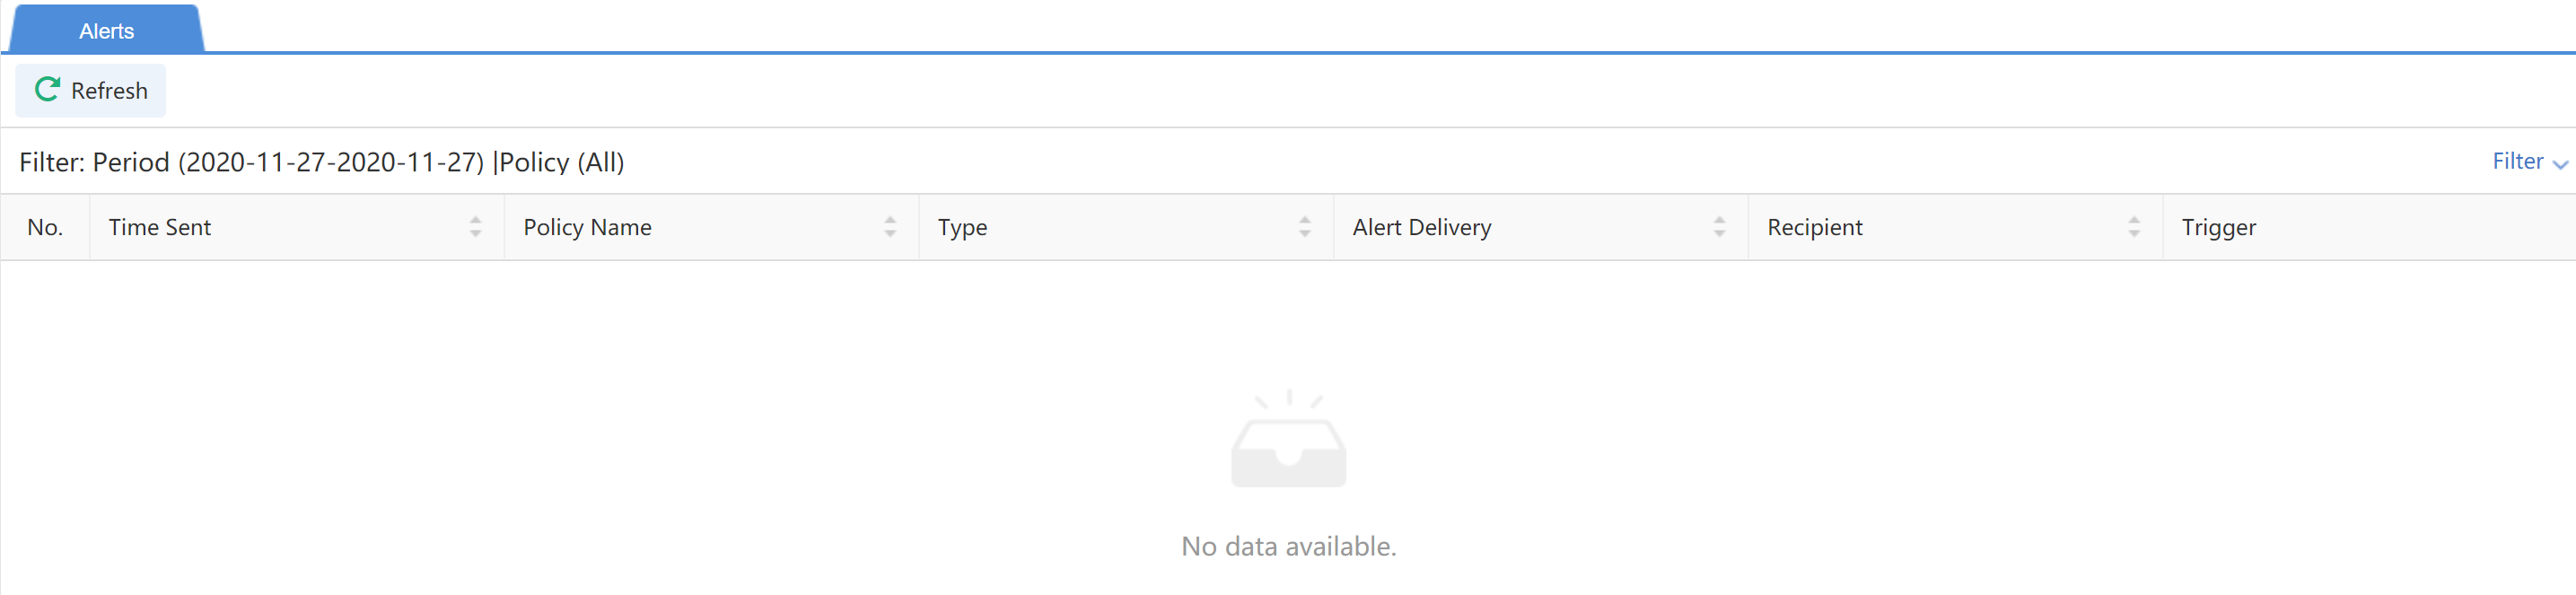
Alerts
You can view the historical notification records under Reports > Notification > Notifications,as shown below:
Security Incident Database
Share the threat intelligence database with the professional security organization to expand security detection and analysis scope and depth. Then, adopt specific prevention measures. Navigate to More > Toolkit > Security Incident Database.
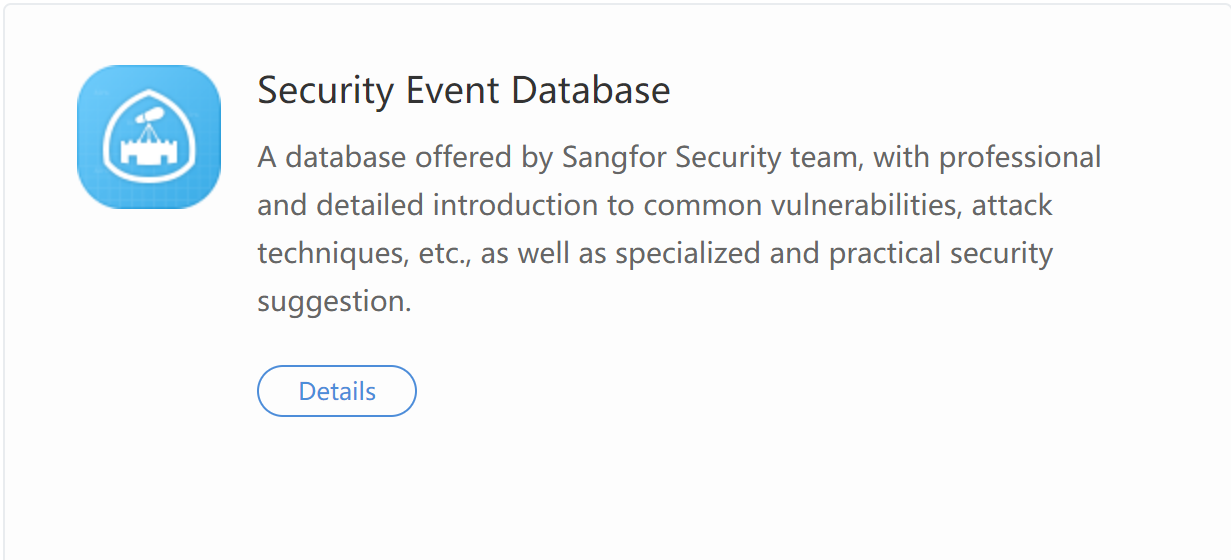
Click Details,and it will redirect to Sangfor Security, as shown below:

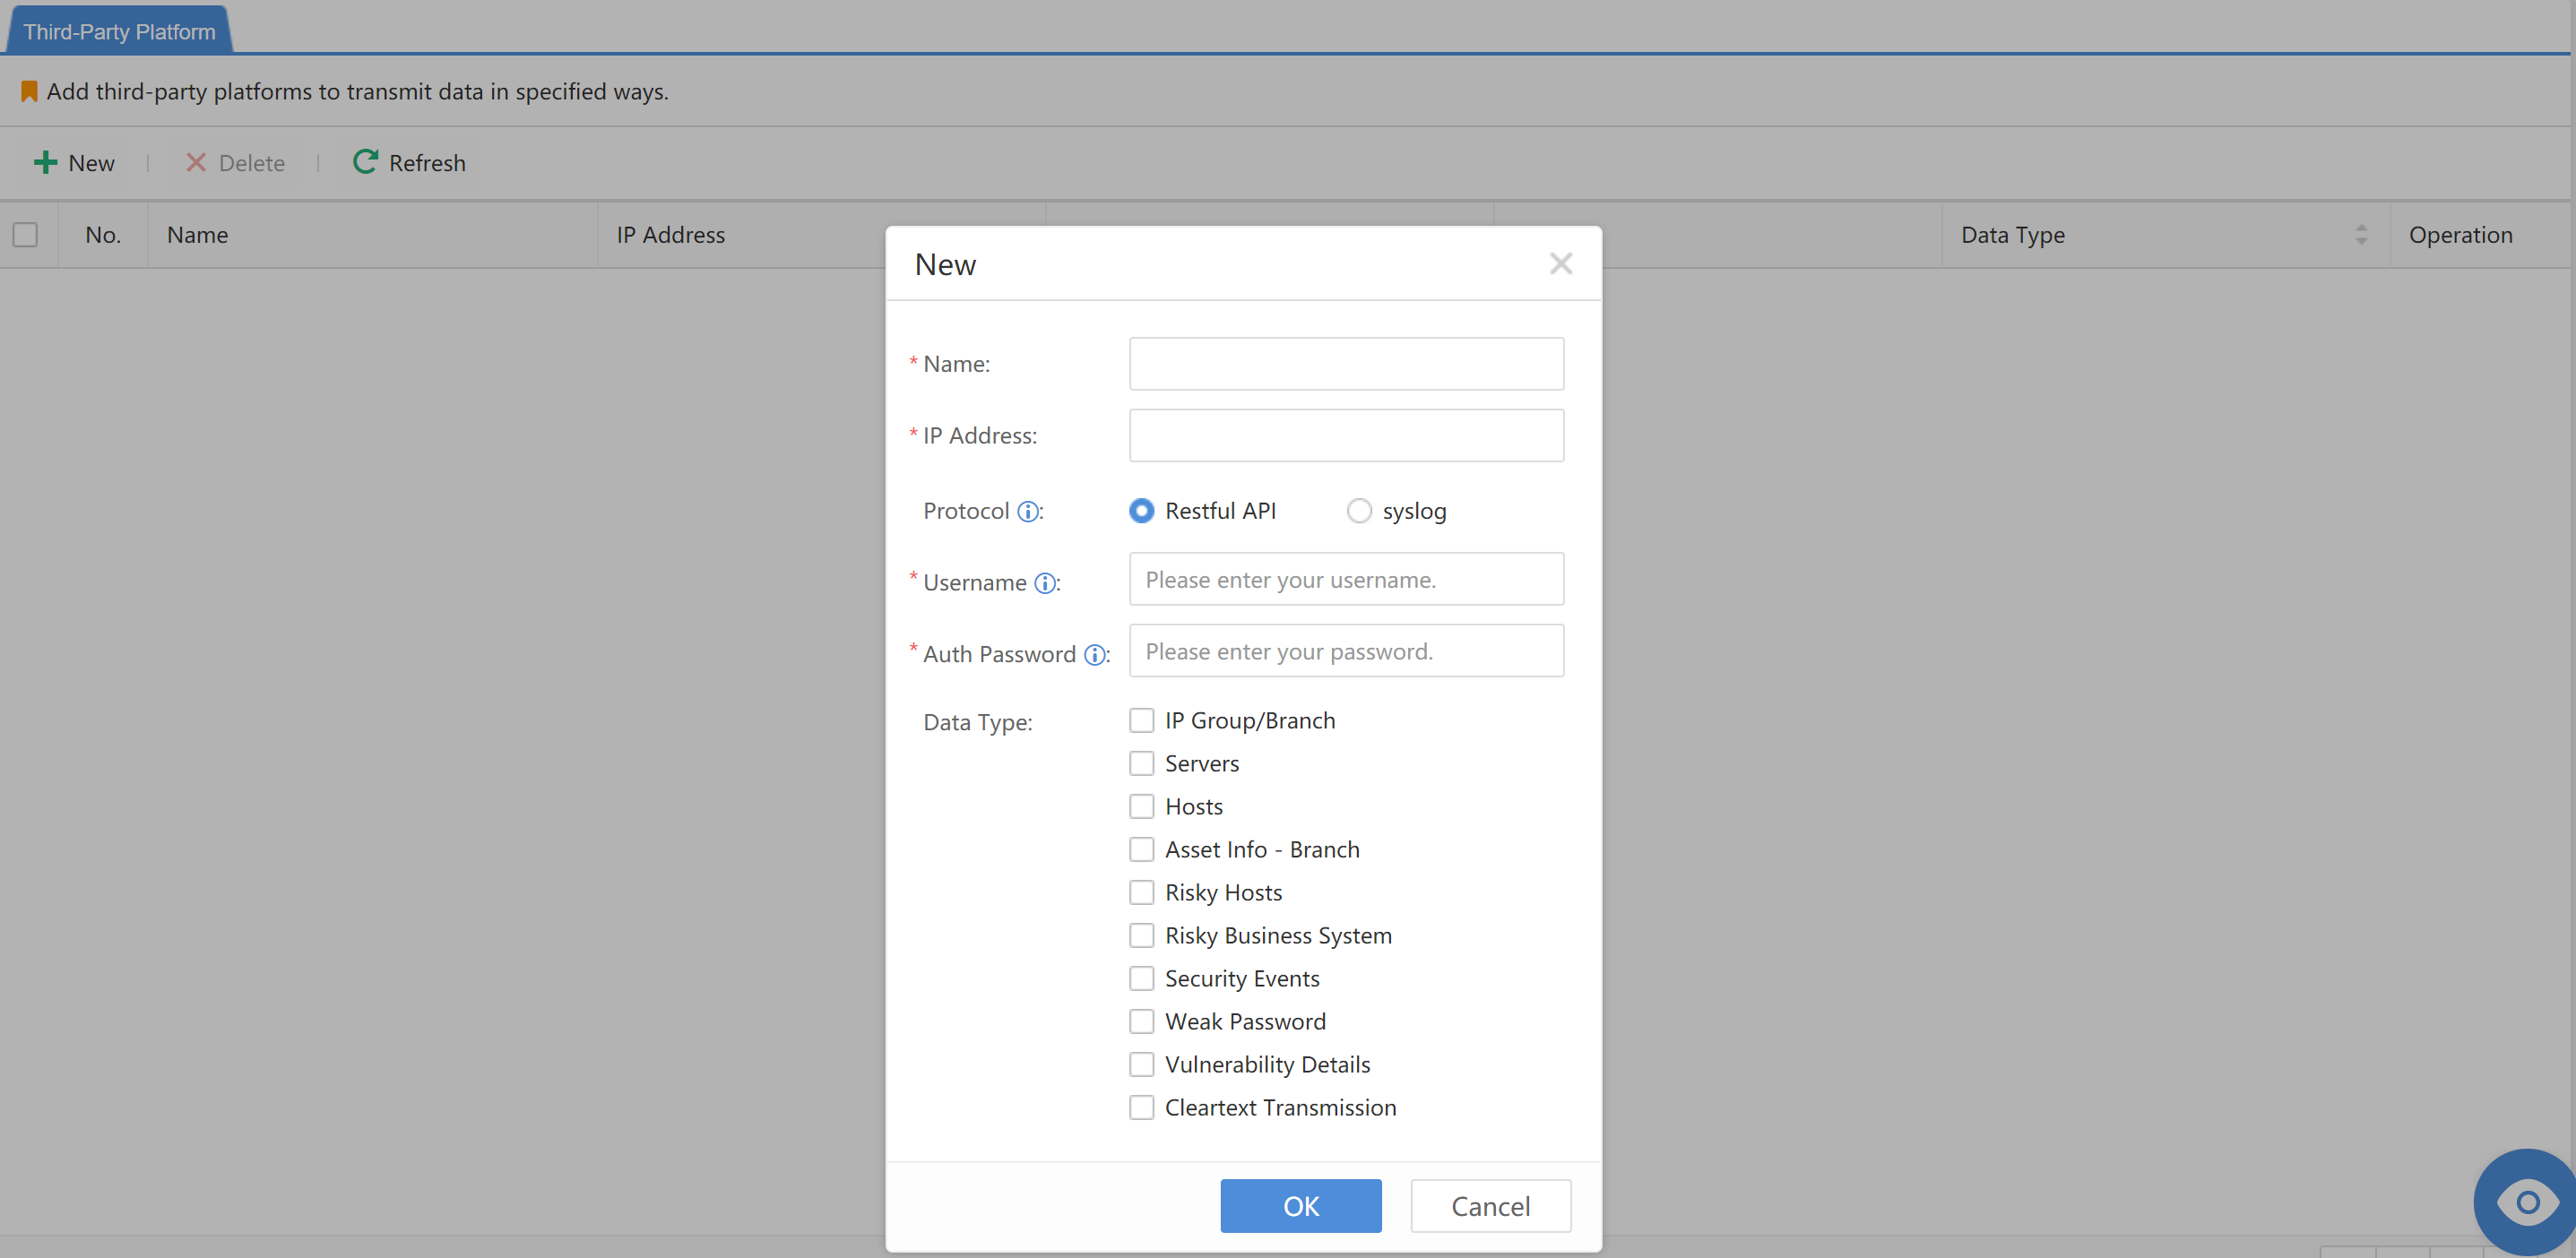
Data Sharing
Data sharing can realize the opening and sharing of data resources with third-party platforms through the RESTful API/syslog interface, unlocking greater data value. Navigate to More > Compliance and Sharing > Data Sharing, then click Details.
On the Third-Party Platforms page, click Add and fill in all the required information.
Navigation
On the Navigation page, all functions are clear and can be directly accessed with one click.
Other Settings
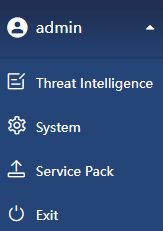
Click the login username at the upper right of the interface to finish the basic configuration of the system and other operations, includingThreat Intelligence, System, Service Pack, and Exit.
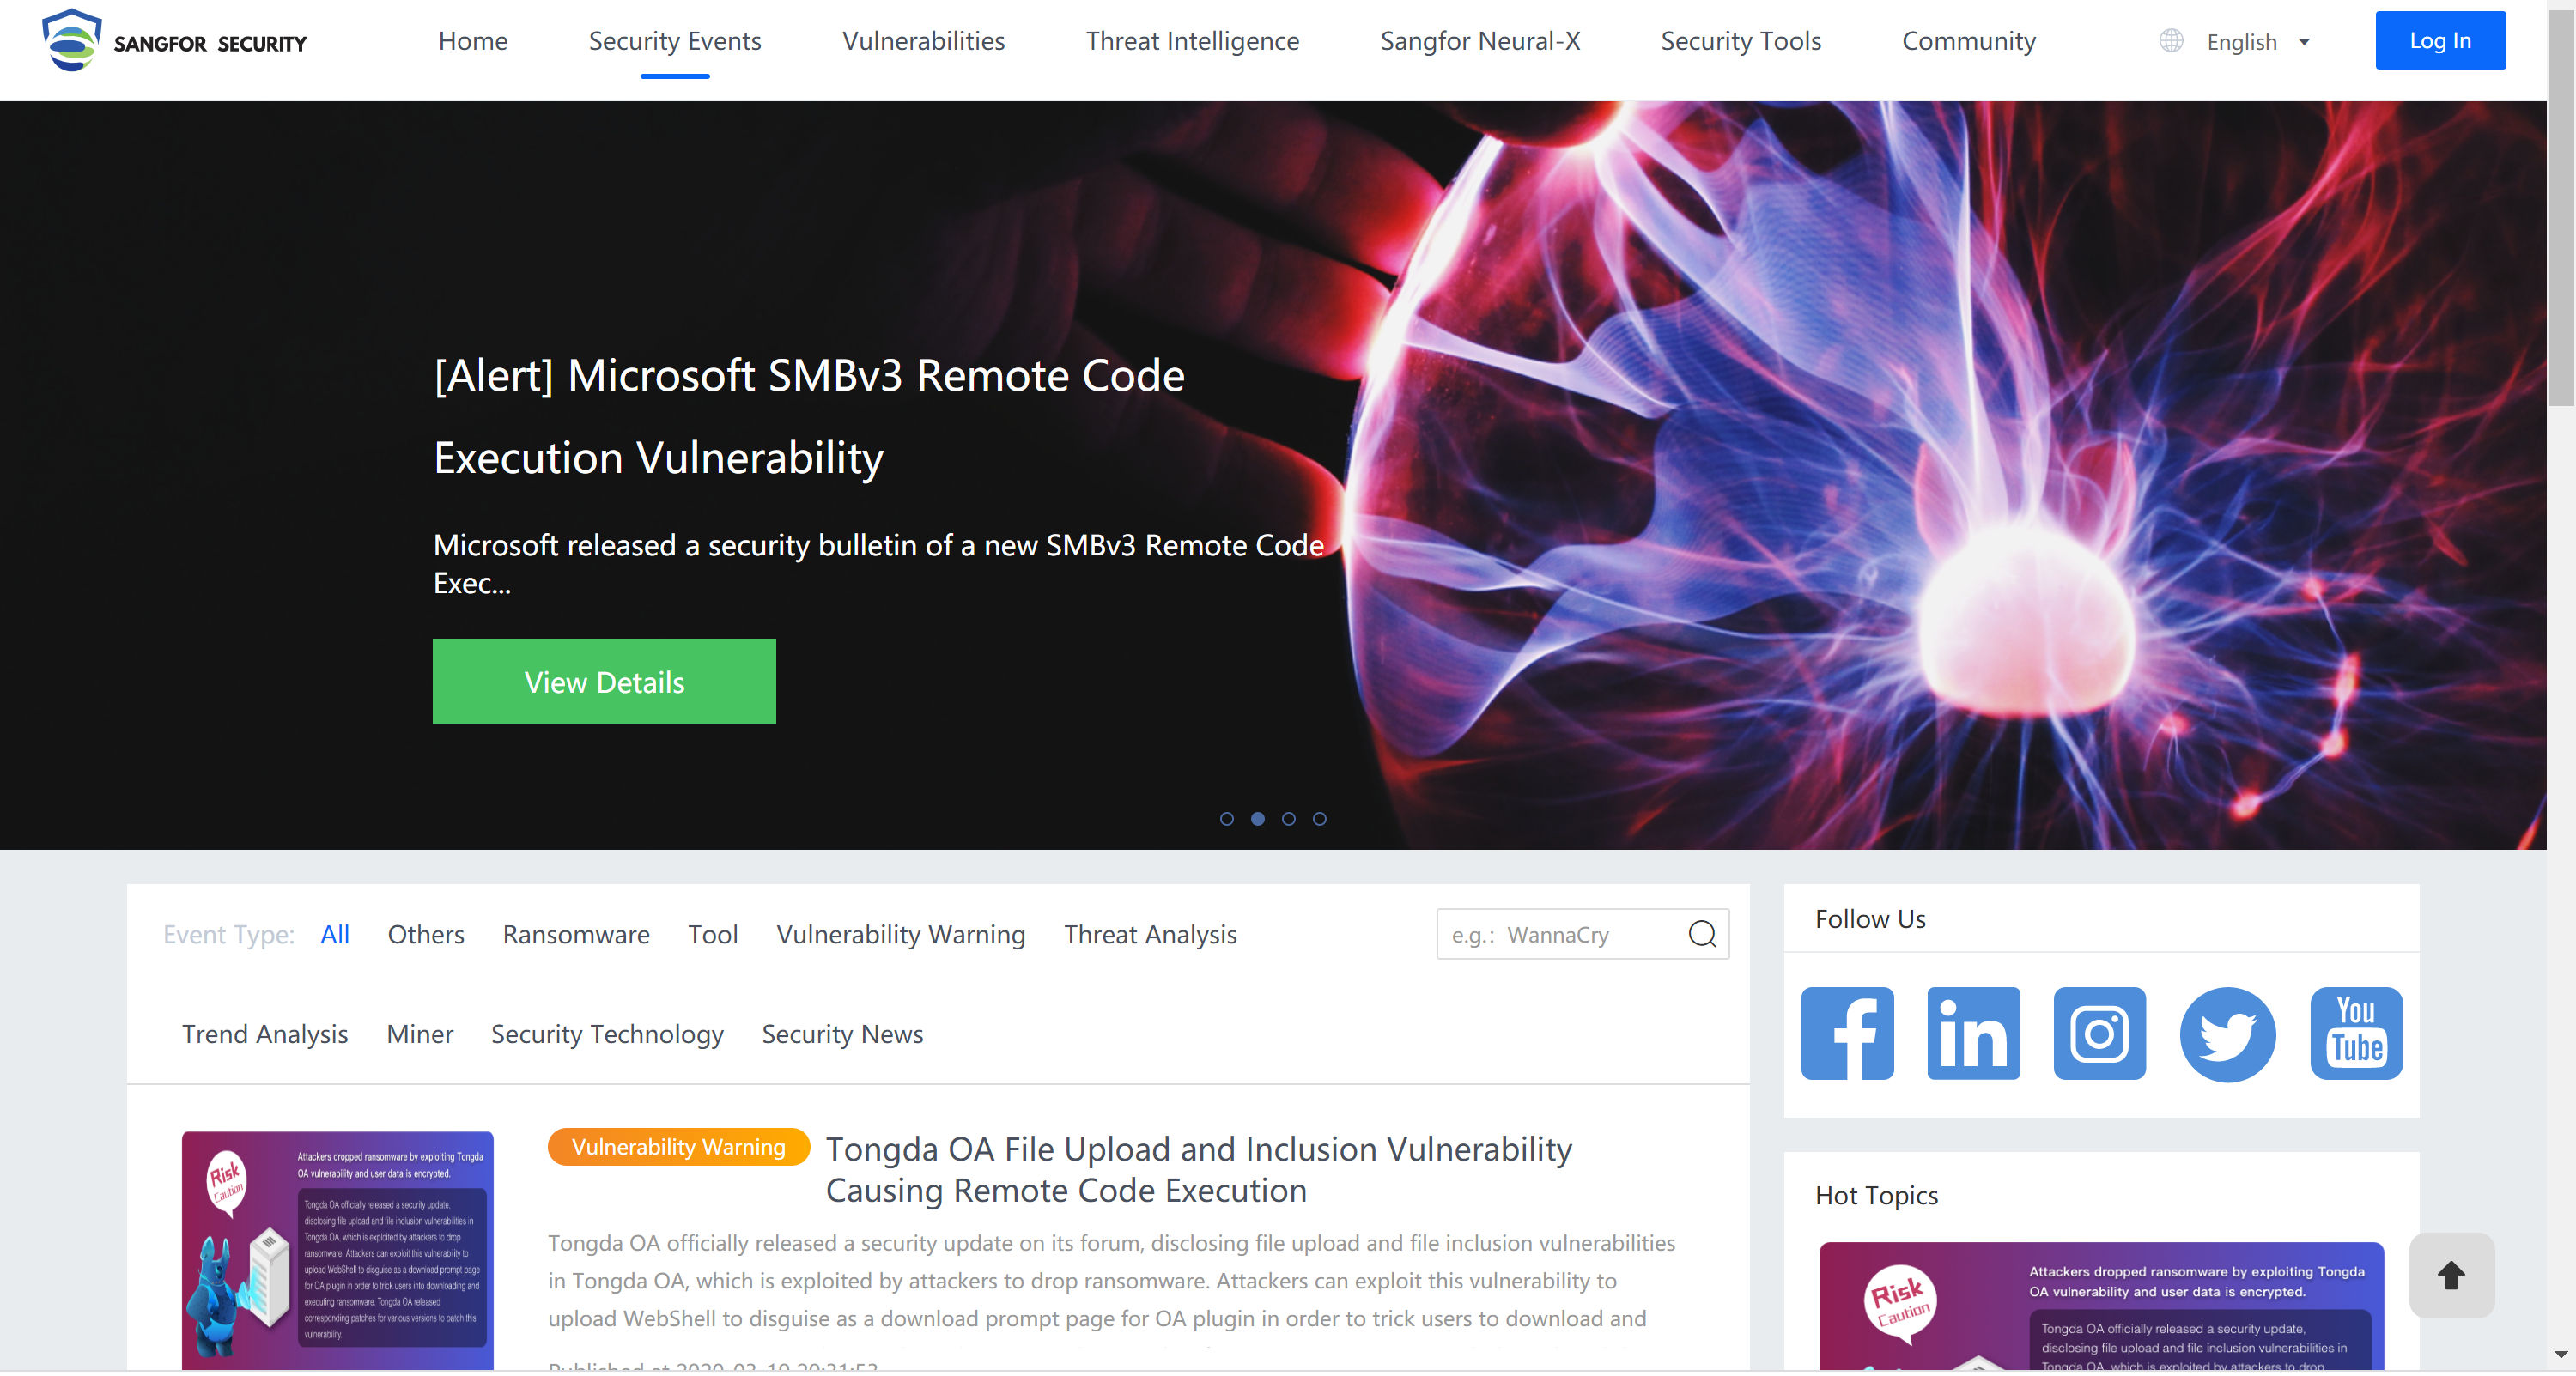
Threat Intelligence
The Threat Intelligence of Sangfor Security Center updates current security events in real-time and provides a detailed analysis process and solutions for the security events. Address: https://sec.sangfor.com.cn/wiki-safe-events?lang=EN-US
System
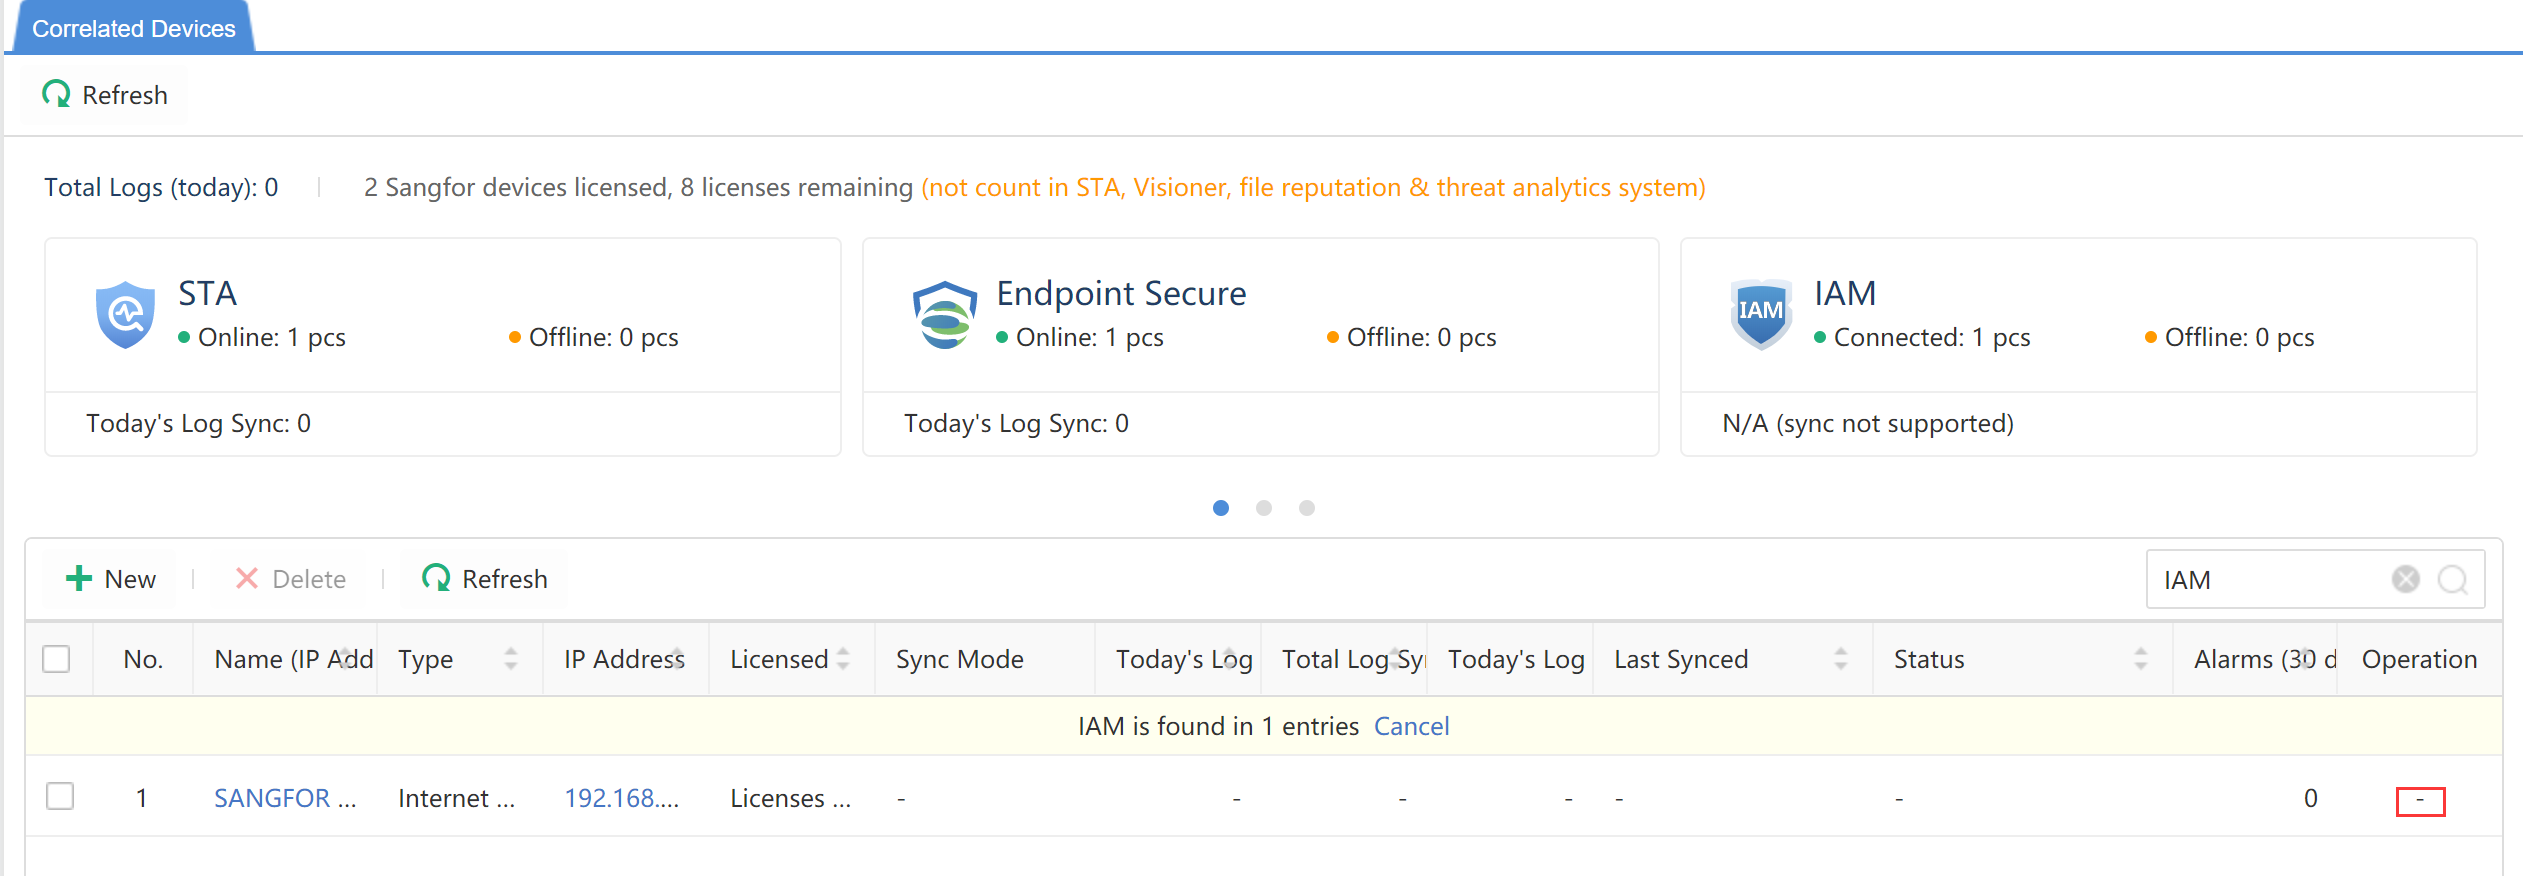
Devices
Sensor Devices
Check the situations of accessed devices, as shown below.
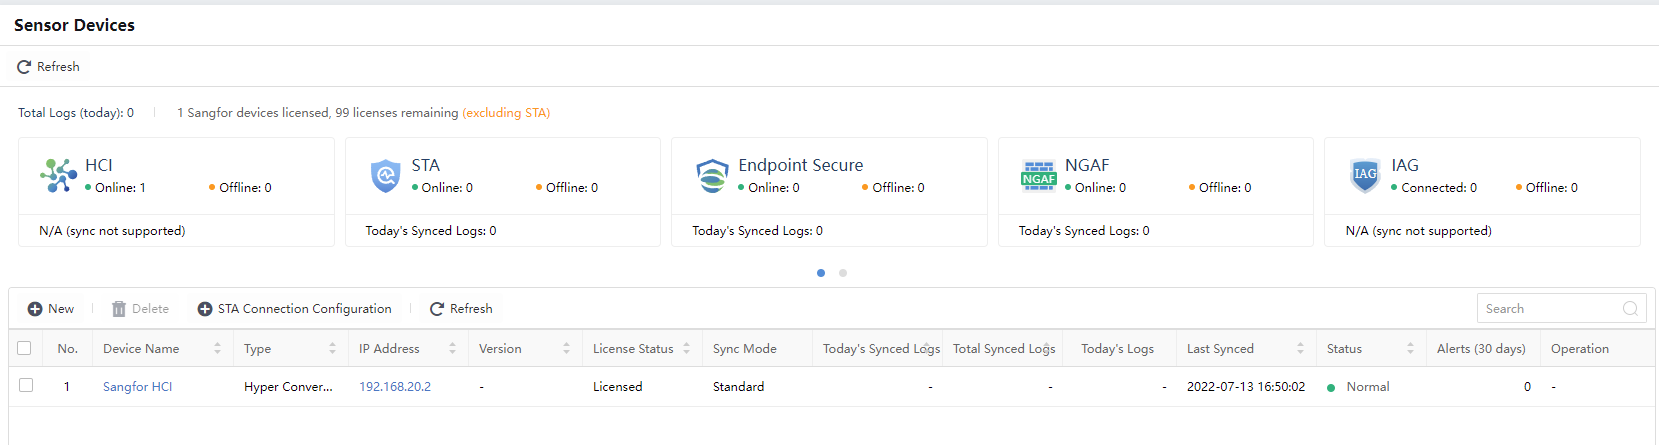
Device name:Refer to the accessed device name.
Type:The type of accessed devices, including STA, NGAF, and Endpoint Secure.
Device Address: Refer to the IP address of the accessed device.
Version:Show the version of the device that is integrated.
License Status:Show the license status of the device.
Sync Mode:Define whether the device has access authorization.
Today’s Synced Logs:View the amount of log data uploaded by this accessed device. The units are B, KB, and MB.
Total Synced Logs:View the total amount of log data uploaded by this accessed device. The units are B, KB, and MB.
Today’s Logs:View the number of logs uploaded by this accessed device. The unit is pcs.
Last Synced:View the last log upload time of this accessed device.
Status:Show whether the accessed device is online or offline. IAG and SSL VPN statuses are displayed with dashes (–).
Alerts (30days):Show the alert of the integrated device.
Operation:The Details of the device are available if supported. It shows dashes (–) if not supported.
- Click New to add the accessed device, as shown below:
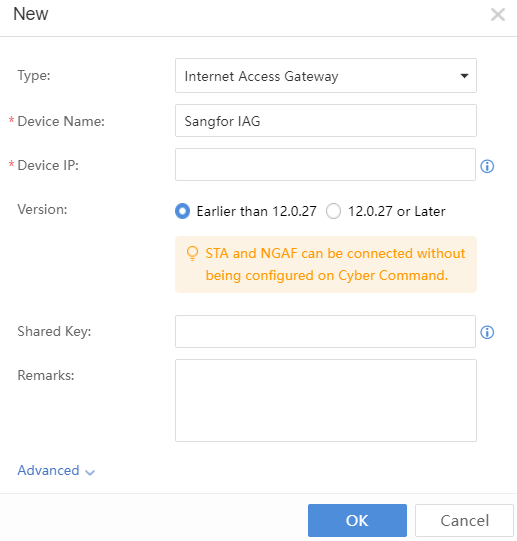
The Cyber Command is docked with other Sangfor devices, covering Internet Access Gateway (IAG), Endpoint Secure (ES), SSL VPN,Network Controller,Hyper-Converged Infrastructure (HCI),and SaaS Endpoint Secure.
Internet Access Gateway configuration:A shared password with the same IAG configuration is needed.
Endpoint Secure configuration:An authentication account and an authentication password, the same as Endpoint Secure.
SSL VPN:Only access to the device IP address of SSL.
Since STA and Network Secure(NGAF) only need to be configured on STA and NGAF pages, they are not added here.
For more information, refer to the latest Configuration Guide released in the knowledge base.
https://knowledgebase.sangfor.com/
Response Apps
The System > Devices > Response Apps page is mainly used to integrate response functions. You can configure the applications and devices that need to be connected and maintain and manage the devices that need to be integrated.
Cyber Command has some built-in applications that are associated with the current version. To add other applications, you can import additional docking applications using the import application function. The developers of currently docked applications can submit docking requirements and related interface documentation to the vendor. The package will be developed by the vendor and imported into the Cyber Command, as shown in the figure below.
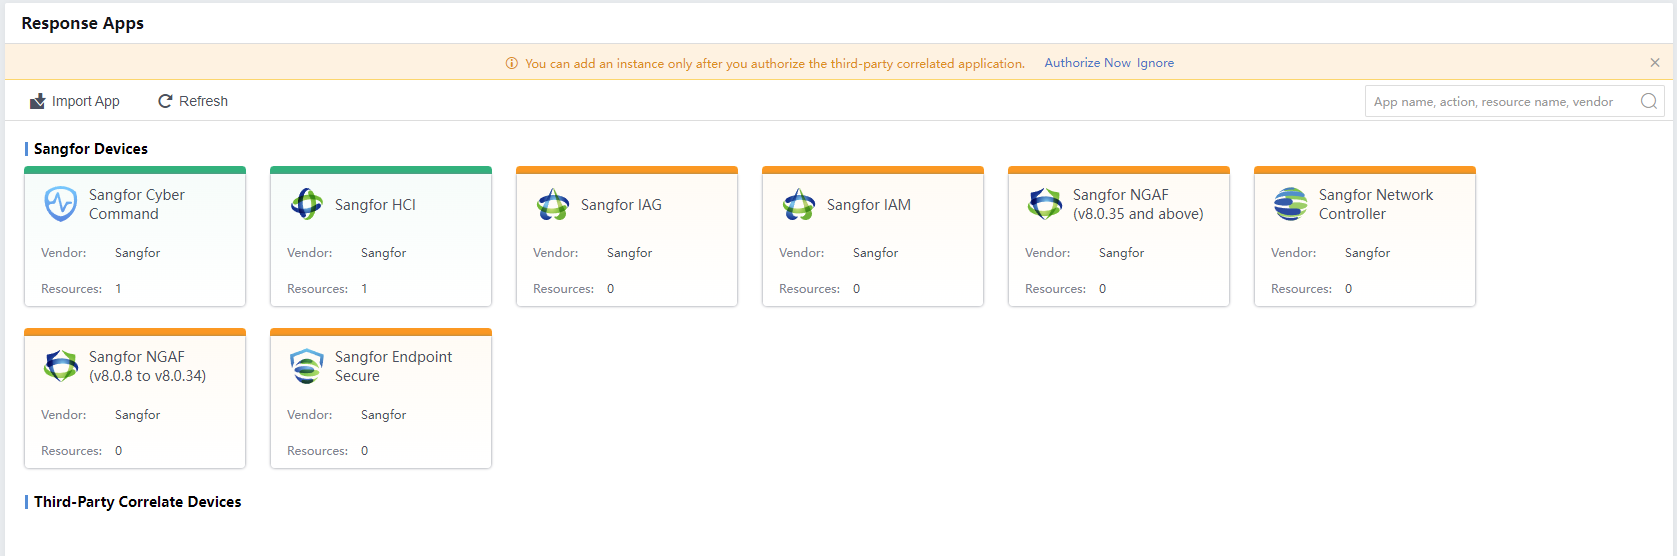
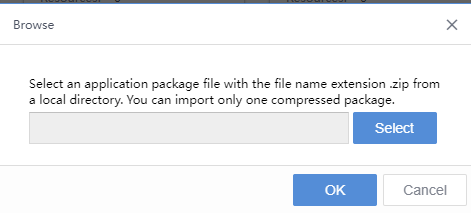
Click Import App to import the application package in .zip format. The compressed package can support multiple applications, and multiple applications that need to be docked can be imported at once. In addition, the applications updated by subsequent manufacturers can also be imported after obtaining the compressed package, as shown in the following figure.
Click the application icon to view the App Details page on the right. After entering the specific application, you can view the details of the application, including supported device versions, application updates, supported actions, and adding resources corresponding to the application. The application needs to add specific docking device resources to take effect, and the parameters for adding resources to different applications are different.
You must acquire the Access SN for Third-Party Correlated Application license to activate the Third-Party Correlate Devices feature.

Sangfor Cyber Command
For version 12.0.27 and above, the standard API interface is already available. The figure below shows the required details.
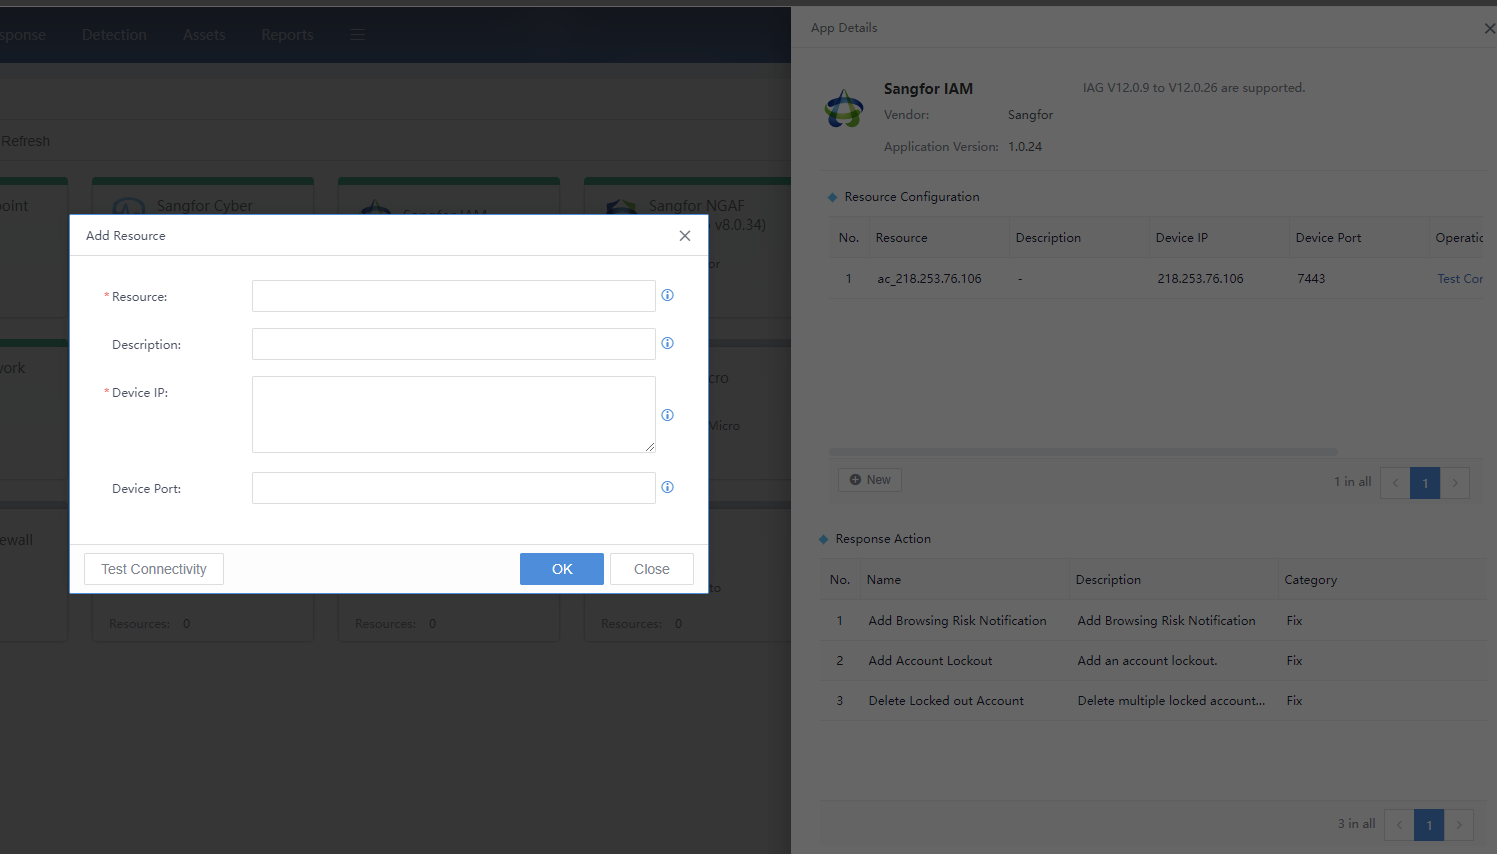
Resource:Fill in the device name that is easy to remember. The application supports multiple docking devices.
Description: Describe the specific scope or functional properties.
Request address:The address of the connected device, which can be an IP or a domain name, ensures that the network can be communicated.
Device port:The specific port opened or mapped by the docking device.
Sangfor IAG
For versions below 12.0.27, the non-public interface is used. The figure below shows the required details.
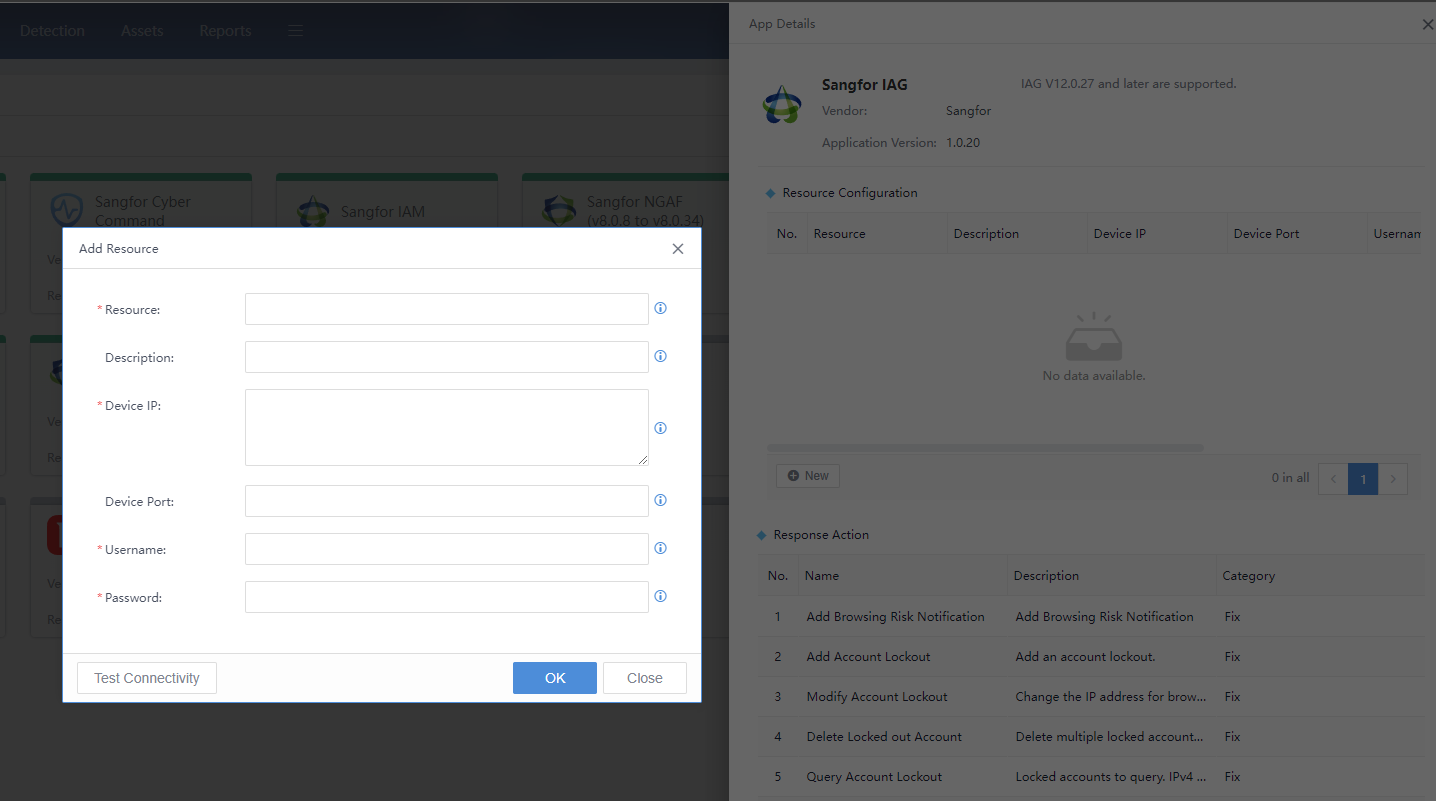
Resource:Fill in the device name that is easy to remember. The application supports multiple docking devices.
Description:Describe the specific scope or functional properties.
Device IP:The address of the connected device, which can be an IP or a domain name. Ensure that the network can be communicated.
Device Port:The specific port opened or mapped by the docking device.
Username:Username of IAG.
Password:Password of IAG.
- Sangfor NGAF (v8.0.35 and above)
For Sangfor NGAF 8.0.35 and above, the standard external interface is used. The figure below shows the required configuration.
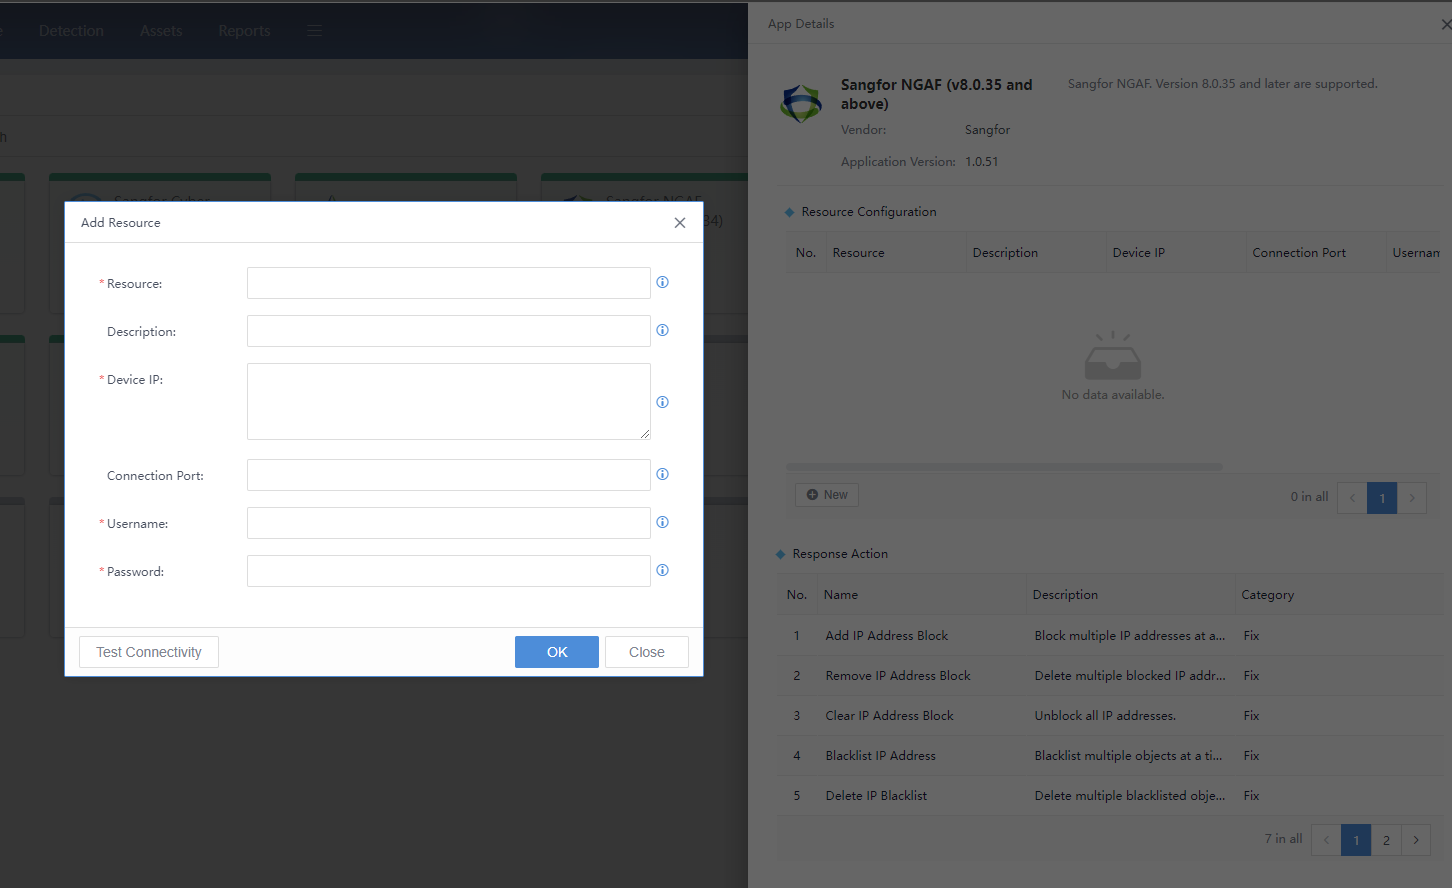
Resource:Fill in the device name that is easy to remember. The application supports multiple docking devices.
Description:Describe the specific scope or functional properties.
Device IP:The address of the connected device, which can be an IP or a domain name. Ensure that the network can be communicated.
Device Port:The specific port opened or mapped by the docking device. The default is port 443.
Username:The username for integration.
Password:Password for integration.
- Sangfor NGAF (v8.0.8 to v8.0.34)
For Sangfor’s NGAF version 8.0.8 to 8.0.35 (not included) using the old version’s interface, the figure below shows the required configuration.
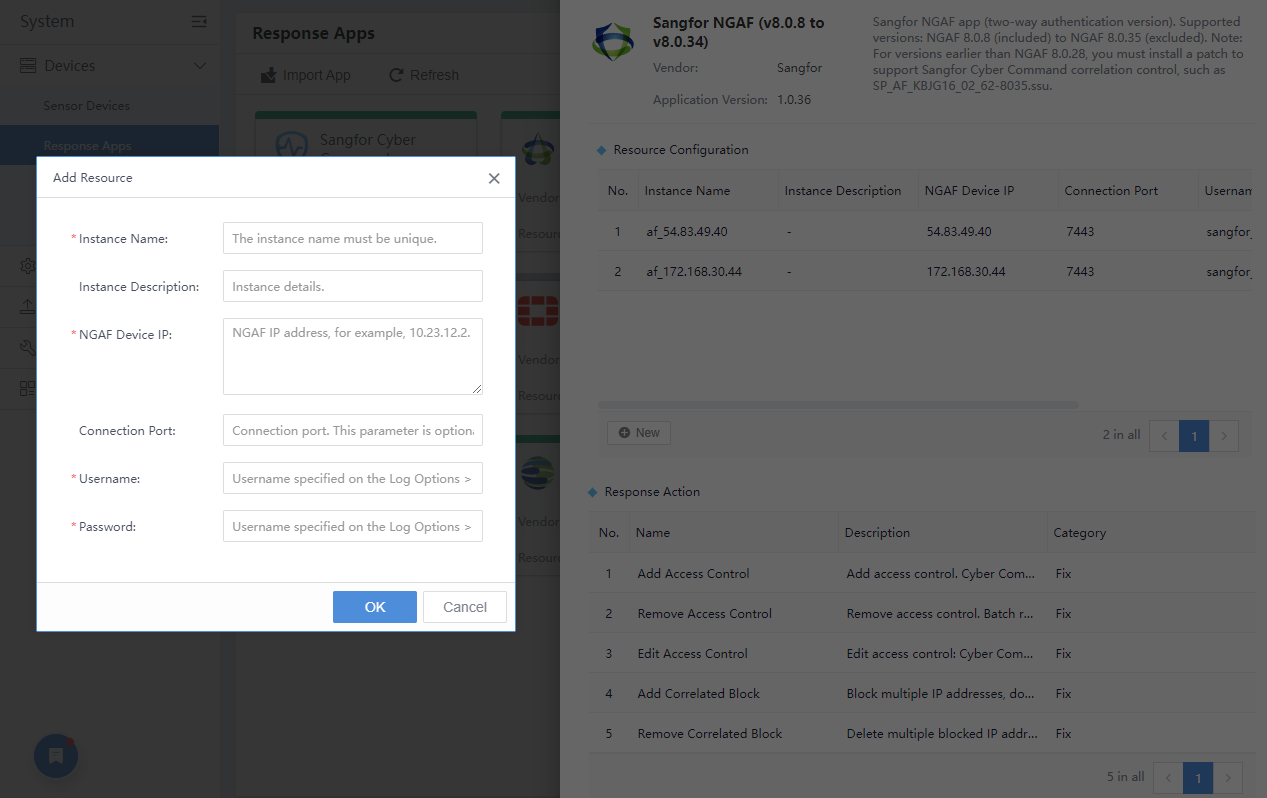
Resource:Fill in the device name that is easy to remember. The application supports multiple docking devices.
Description: Describe the specific scope or functional properties.
Device IP: The address of the connected device, which can be an IP or a domain name. Ensure that the network can be communicated.
Device Port:The specific port opened or mapped by the docking device. The default port is 443.
Username:Theusername for integration.
Password: Password for integration.
- Sangfor Endpoint Secure
For Sangfor Endpoint Secure version 3.2.33 and above, the figure below shows the required configuration.
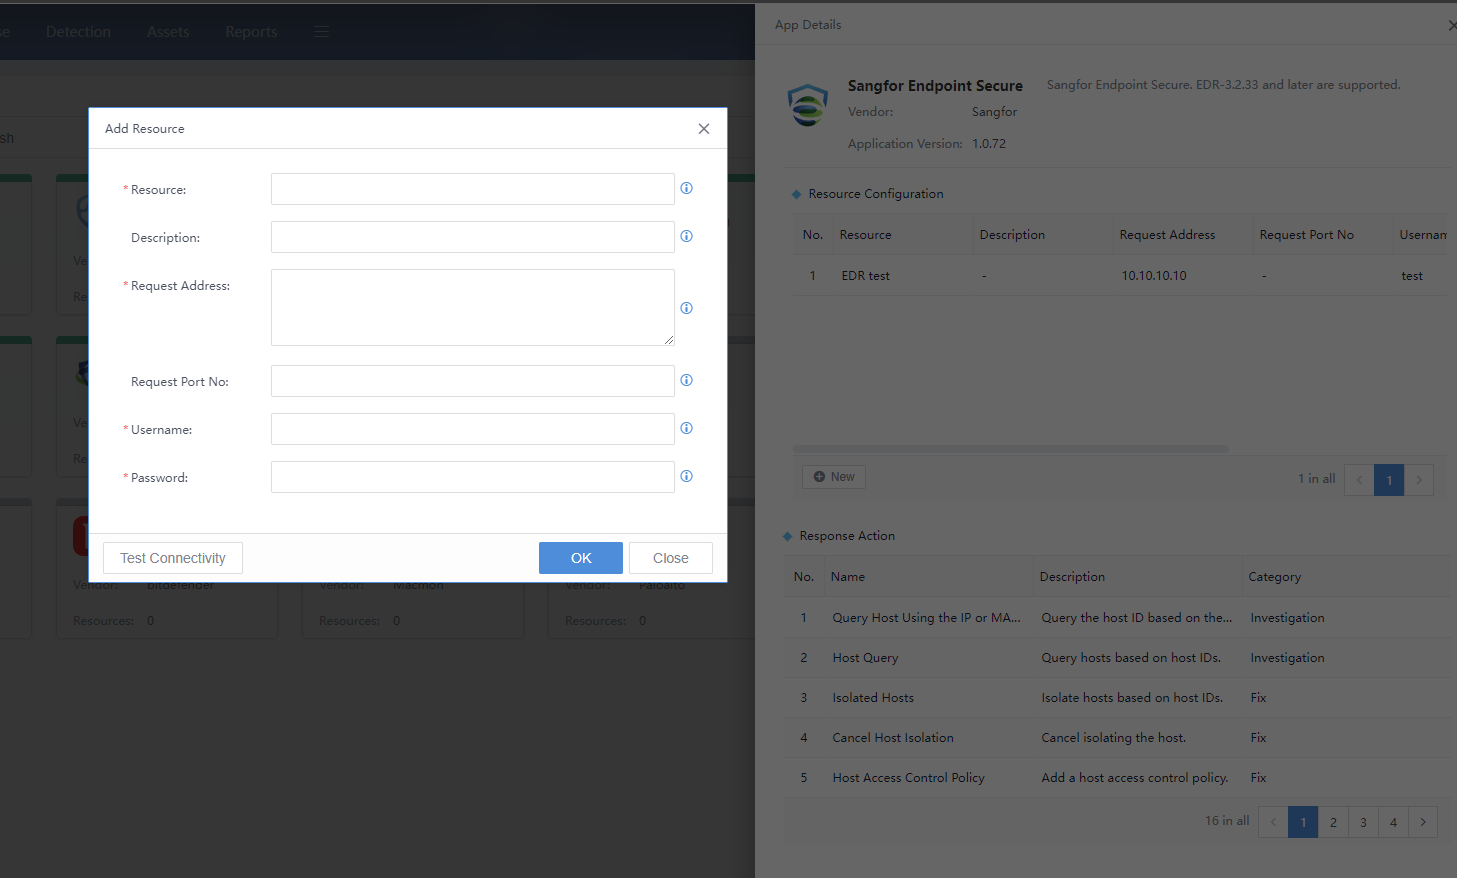
Resource:Fill in the device name that is easy to remember. The application supports multiple docking devices.
Description:Describe the specific scope or functional properties.
Device IP:The address of the connected device, which can be an IP or a domain name. Ensure that the network can be communicated.
Device Port:The docking device’s specific port or maps to the outside world. The default port is 443.
Username:The username for docking. Activate it on the HCI platform.
Password:Password for docking.
- Sangfor Network Controller
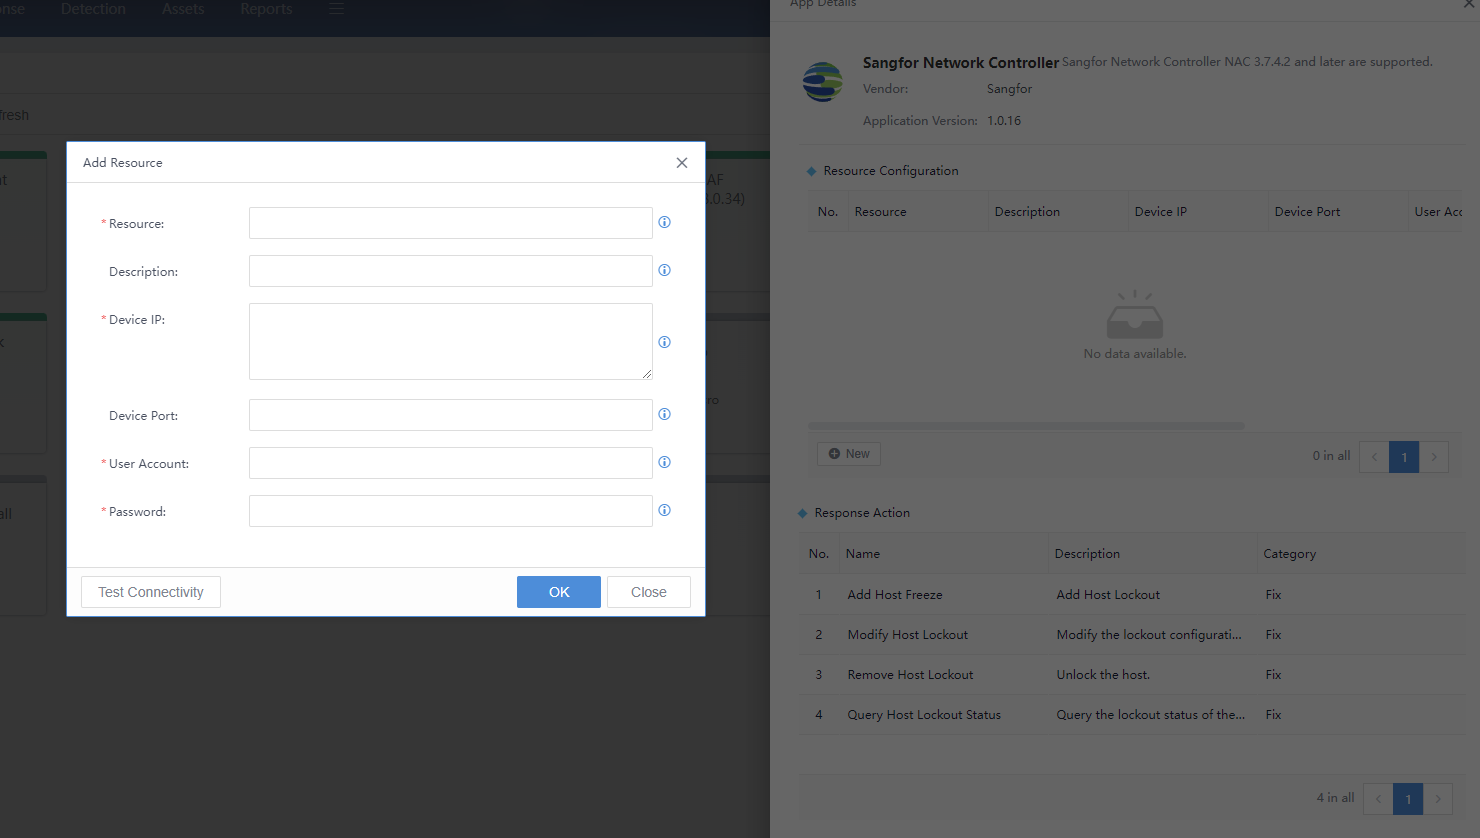
Resource: Fill in the device name that is easy to remember. The application supports multiple docking devices.
Description:Describe the specific scope or functional properties.
DeviceIP:The address of the connected device, which can be an IP or a domain name. Ensure that the network can be communicated.
Device Port:The specific port opened or mapped by the docking device. The default port is 443.
Username:The username for integration.
Password:Password for integration.
Device Monitoring
Monitor the running of the accessed device through the Simple Network Management Protocol (SNMP). This device’s protocol versions of the SNMP enabled include V1, V2, and V3.
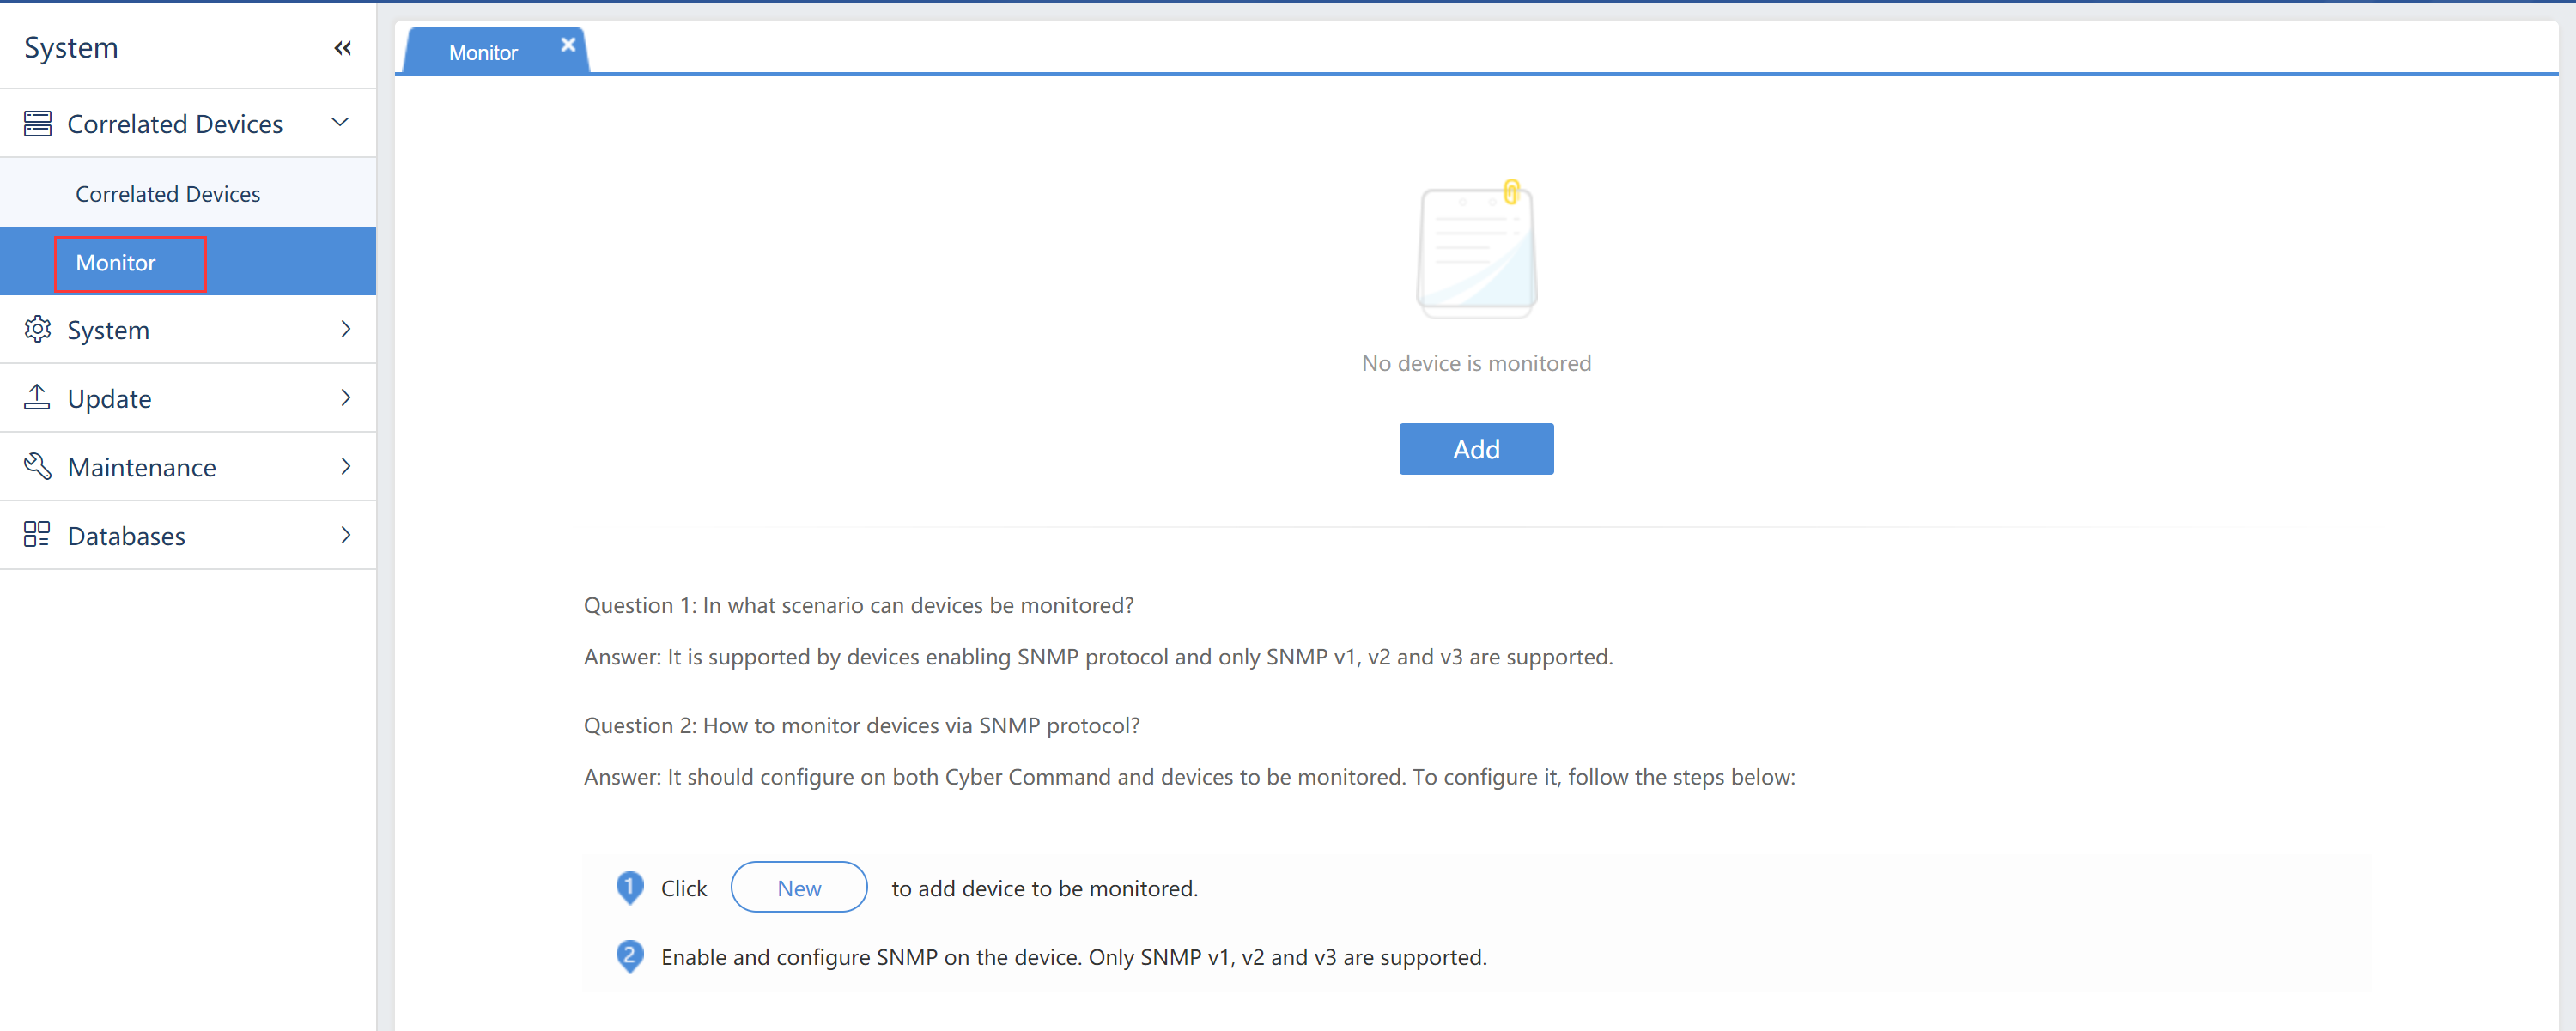
Click New to add a device that needs to be monitored.
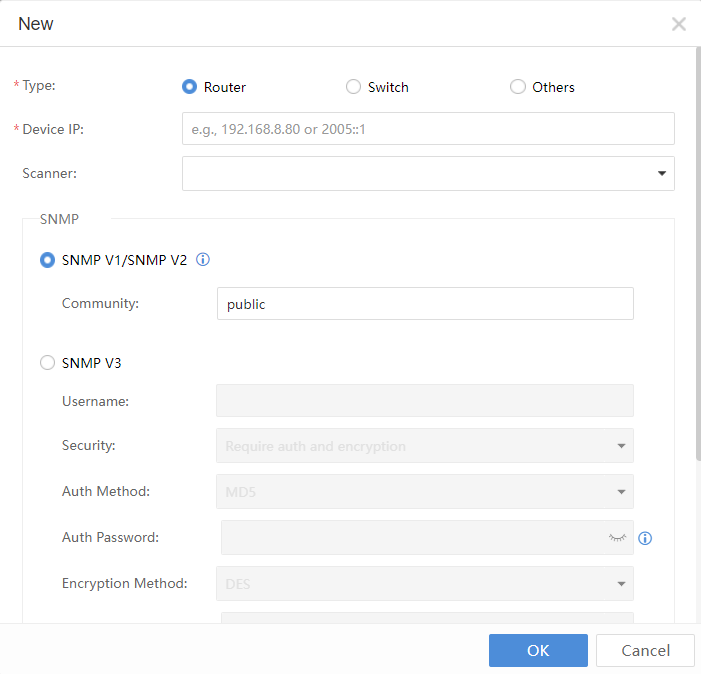
Device IP:Refer to the IP address of the accessed device.
SNMP V1/SNMP V2:Configure a group name set on the accessed device.
SNMP V3:Implement bidirectional authentication on V3 by configuring username, security level, authentication method, authentication password, encryption method, and encryption password information corresponding to the accessed device.
Click Advanced to obtain CPU free space, total memory size, remaining memory, outbound traffic of the networking interface, and inbound traffic through OID, which shall correspond to the accessed device.
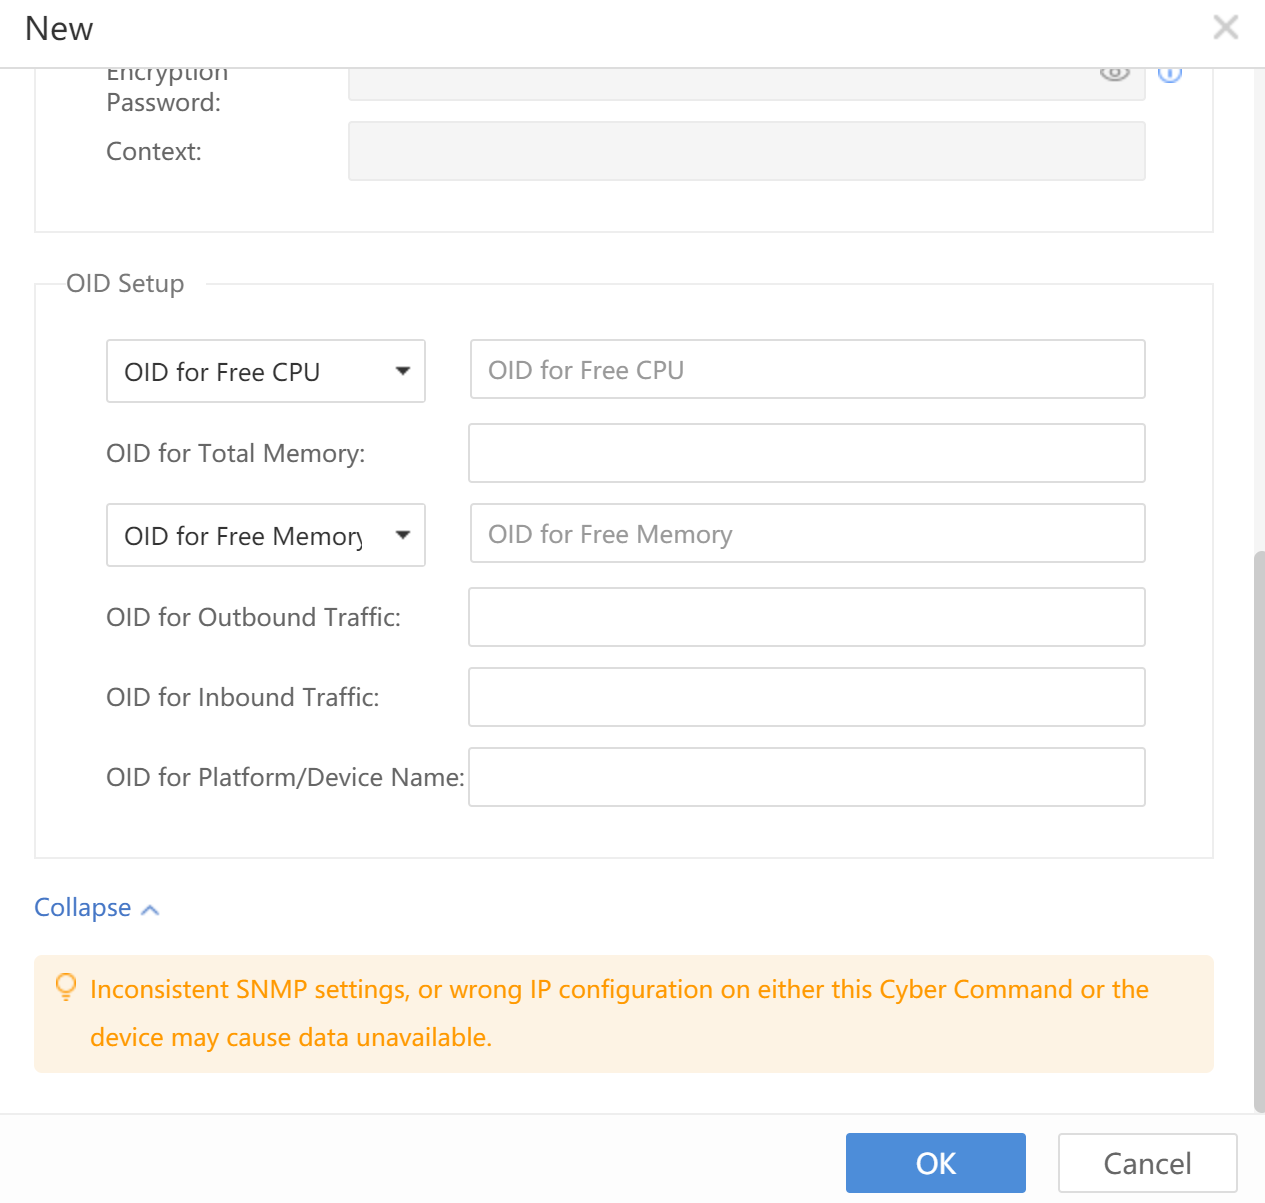
Note: The SNMP V1/SNMP V2 does not support obtaining the traffic information. Therefore, there will be no data in the related traffic display. If required to obtain the traffic information, please select SNMP V3.
Data Sharing
Third-Party Platforms
You can share data from Cyber Command to third-party platforms via API or syslog.
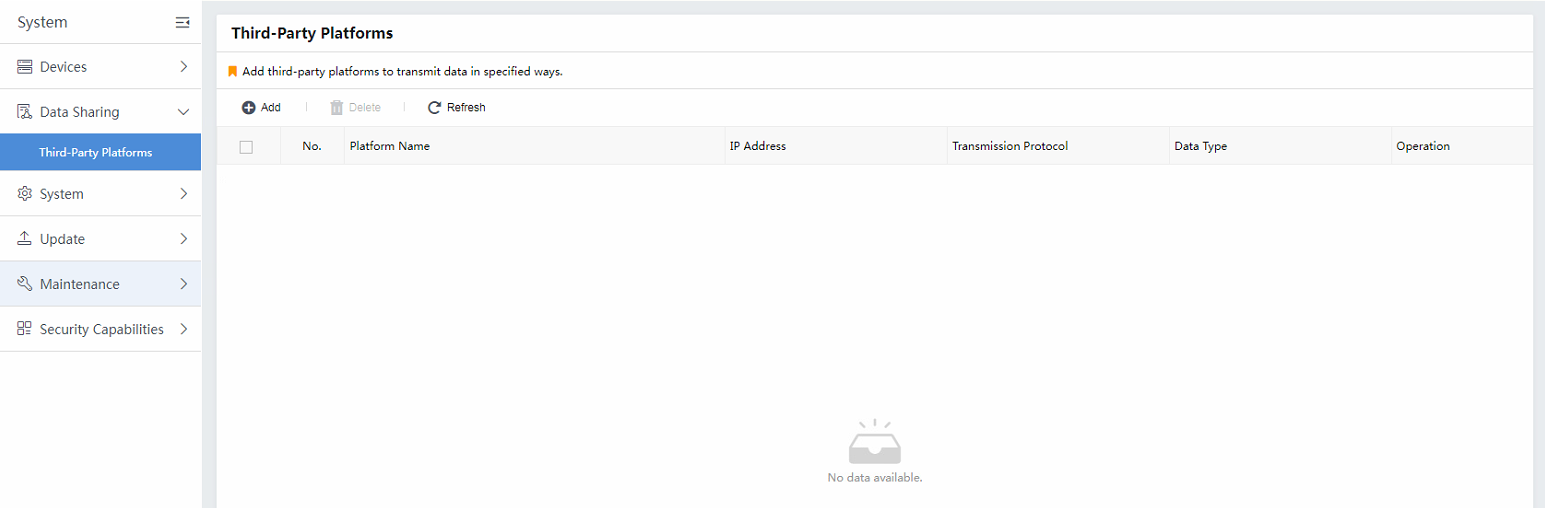
Click Add to add a new item for sharing.
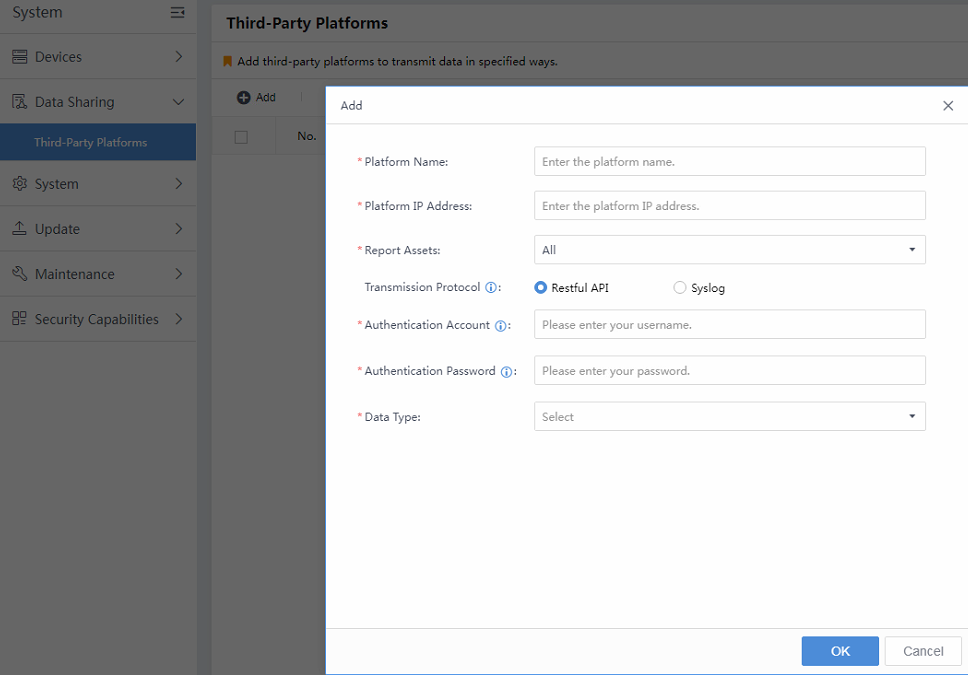
1. For Restful API Type
Platform Name: The target platform’s custom name.
Platform IP Address: Fill in the target IP address.
Report Assets: Select the specific asset group for sharing.
Transmission Protocol: Select either Restful API or Syslog. Here, for example, select the Restful API type.
Authentication Account: Fill in the API account created in the target platform.
Authentication Password:Fill in the API password created in the target platform.
Data Type: Pull down and select the data type you need to share.
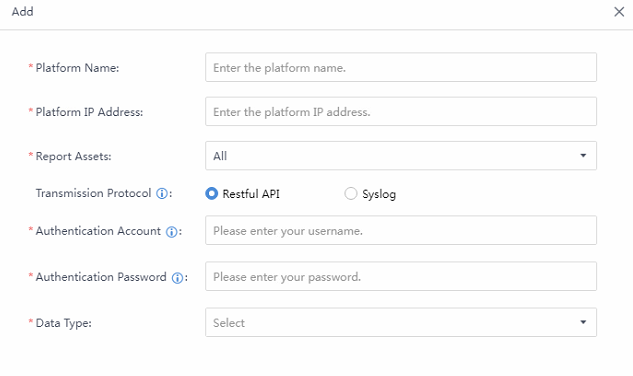
2. For Syslog Type
Platform Name: The target platform’s custom name.
Platform IP Address:Fill in the target IP address.
Report Assets:Select the specific asset group for sharing.
Transmission Protocol: Select either Restful API or Syslog. Here, for example, select the Syslog type.
Data Type:It contains Security Incidentand Security Alert. You can filter specific data by Threat Type, Severity, Confidence,Data Format, and Synchronization Time.
Port:By default, it is transmitted by UDP 514. You can modify it according to the syslog server’s settings.
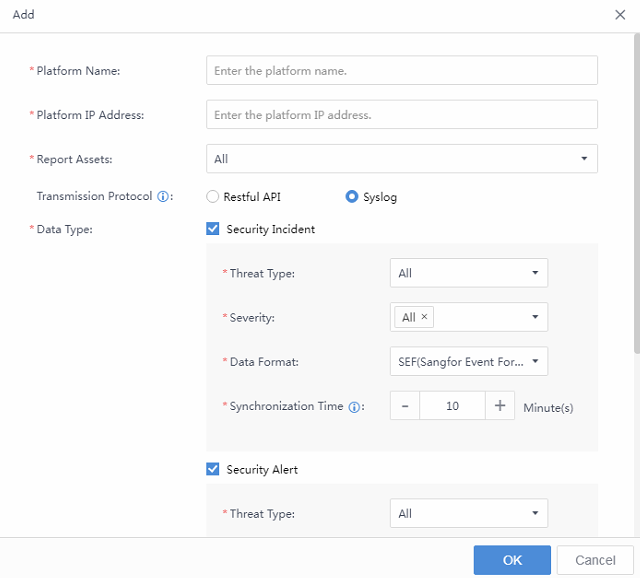
Caution: The data type to be shared differs depending on the transmission protocol you select. For example, third-party platforms will not receive security alerts when using the Restful API protocol. Please pay attention.
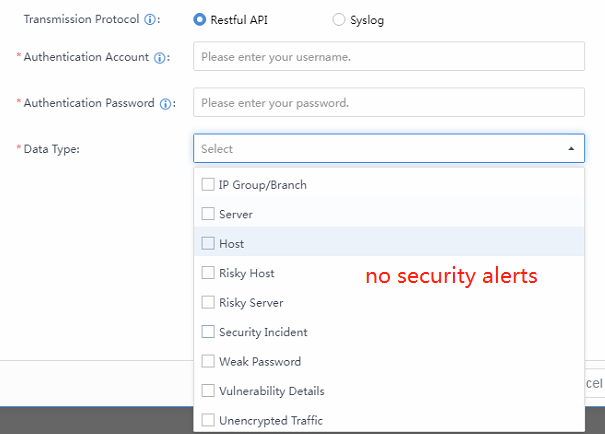
System
Admin Account
Add a new account, change the account password, and assign permissions to the account. The admin account has the highest permissions.
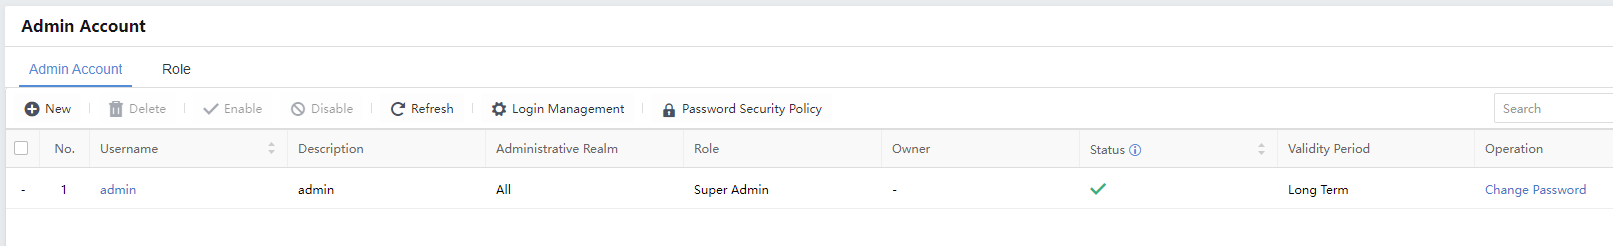
Click New to add an account.
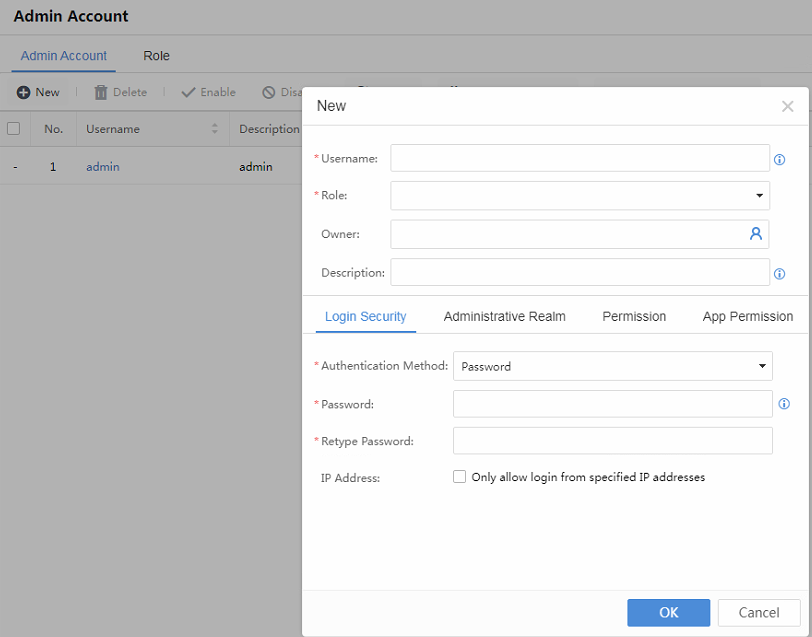
Username:Create a username for the login account.
Role:Select the role of the administrator.
Owner:The administrator’s owner.
Description:Describe this account.
Password:Refer to the password for logging in using the username.
Retype Password:Confirm the password.
Administrative Realm:It is used in a multi-branch scenario. Recommended administrators for different branches can view the information of corresponding branches only.
Permission:Refer to Administration and View, and there is permission for editing in Administration.
App Permission:It is used to bond specific accounts with specific correlation App.
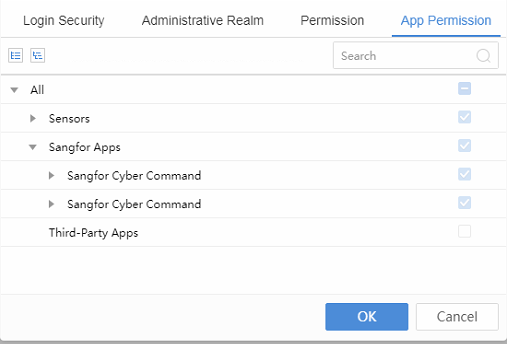
For the created account, click the specific username to change the account permission.
Click Change Password to change the account password.
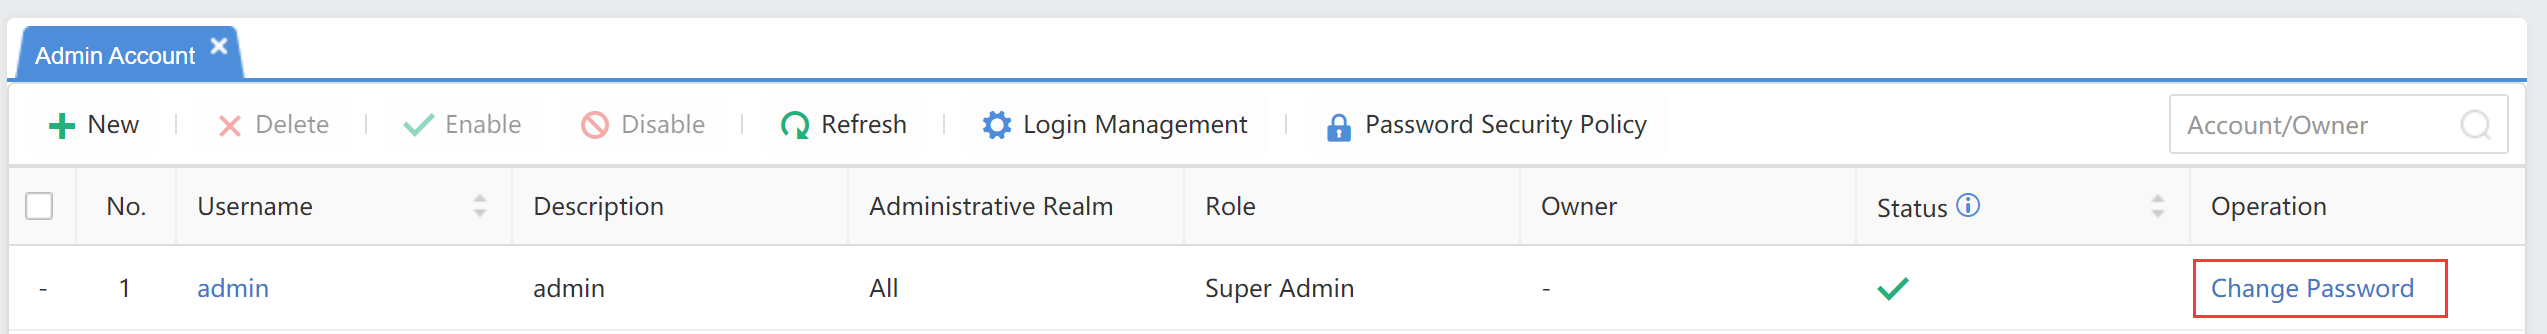
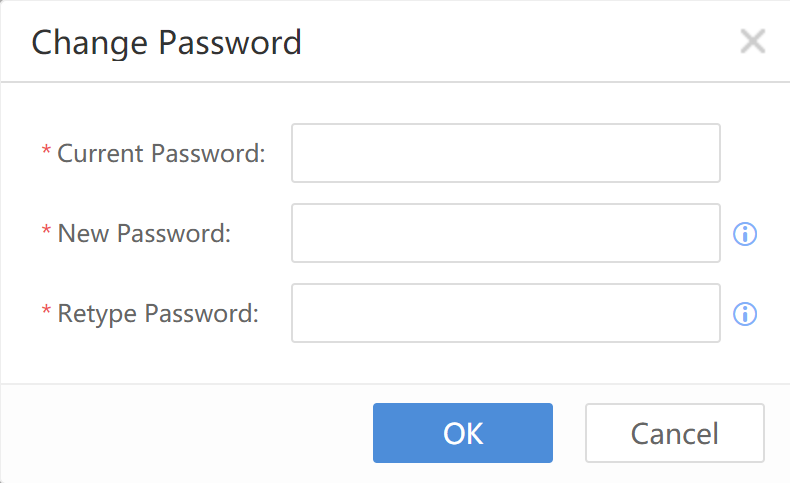
Change Password:When changing the password of the currently logged-in account, enter the existing password. When changing the account password created by the currently logged-in account, directly change the new password.
Note:
The password cannot contain the username.
It must be 8 to 64 characters.
Cannot contain Chinese characters, spaces, or full-length characters.
It must contain irregular characters that consist of any three of the following: uppercase letters, lowercase letters, digits, and special characters.
It cannot contain sensitive characters.
Cyber Command supports adding Google Authenticator as the OTP account to do two-factor authentication.
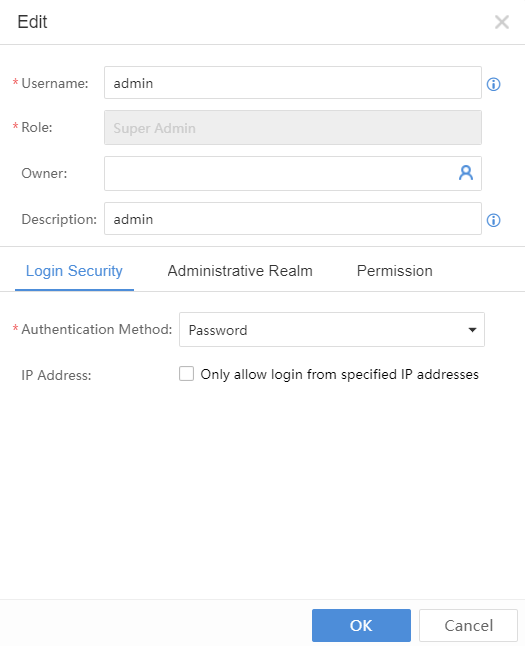
Click the Authentication Method dropdown list and select Password+OTP, the dialog box below will appear.
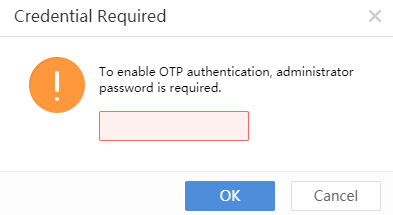
After entering the account password, click the Set up TOP authentication. It will show the QR verification code. Follow the instructions stated below and use the Google Authenticator to scan the verification code.
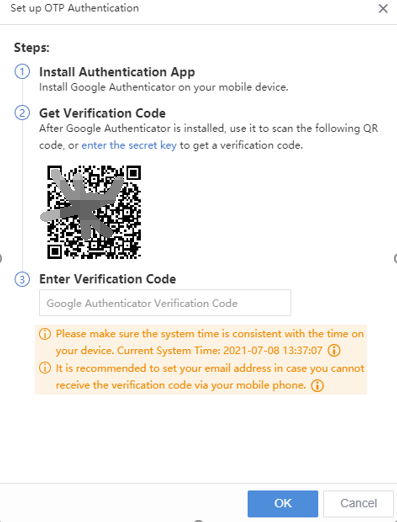
Once logging in from the web console, a dialog box will pop up where you will need to enter the verification code.
You are required to key in the verification code generated in your Google Authenticator App to proceed with the login.
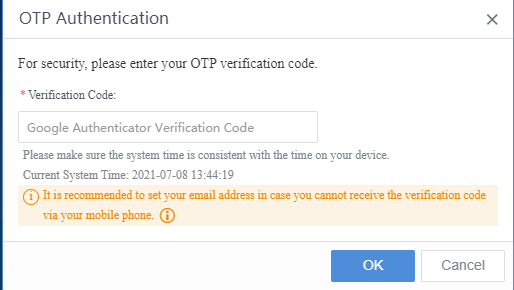
Licensing
View whether the functional license key and license key use time are correct. It is categorized into Basic Licenses and Function Module Licenses.
The Basic Licenses include the Platform License,Software Upgrade License,and Database Upgrade License.
The Function Module Licenses include Sensor Device License,Multifunction License,and Access SN Third-Party Correlated Application.
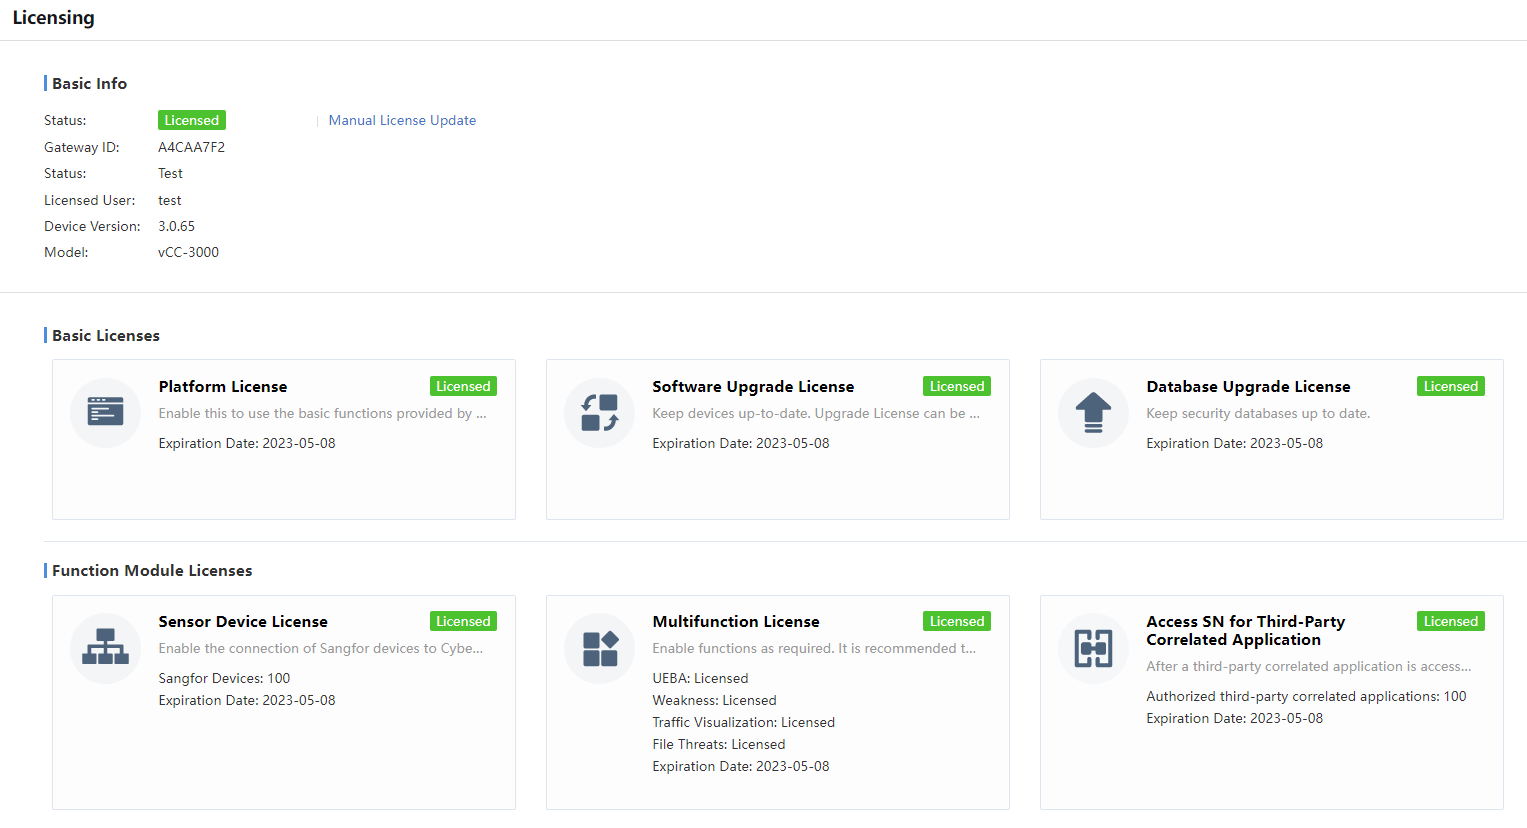
It supports importing the license file by clicking the Manual License Update.
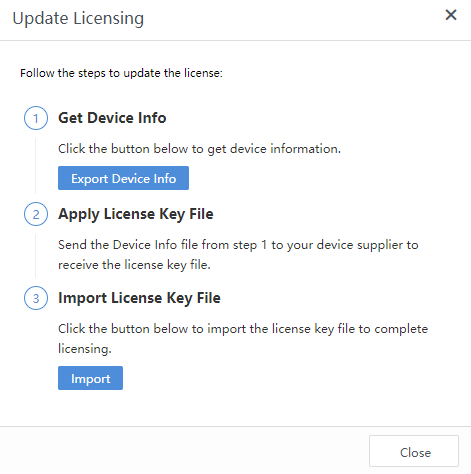
Network
It is required to enable the networking interface first and then configure the interface address. Connect the network cable until the networking interface light is on when enabling the network interface.
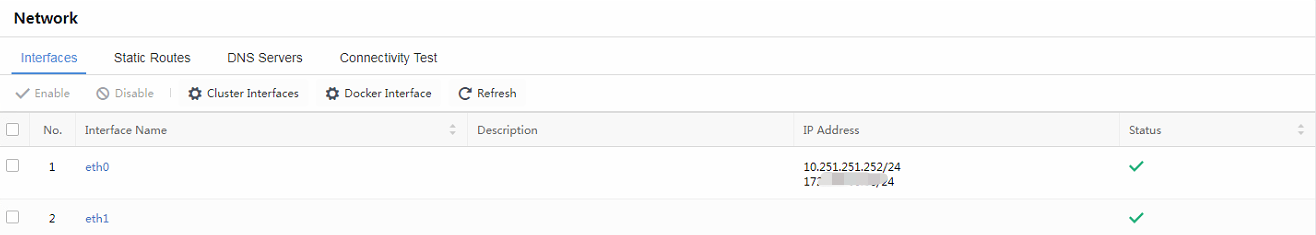
Click the interface name to edit the interface configuration, as shown below:
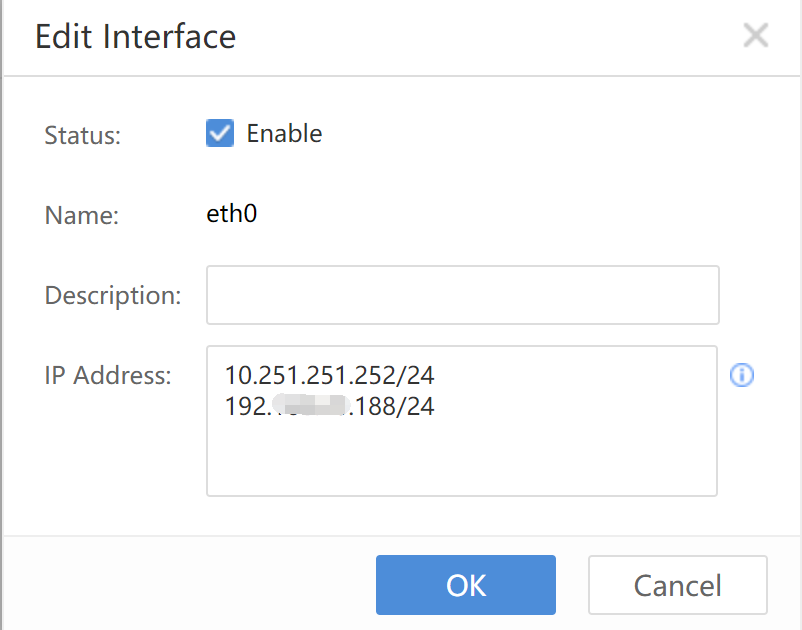
Status: Check the Enable checkbox.
IP Address:Refer to the IP address for configuring the networking interface. You can configure multiple IP addresses.
Click OK to submit.
Configure the Static Routes for the STA Device.
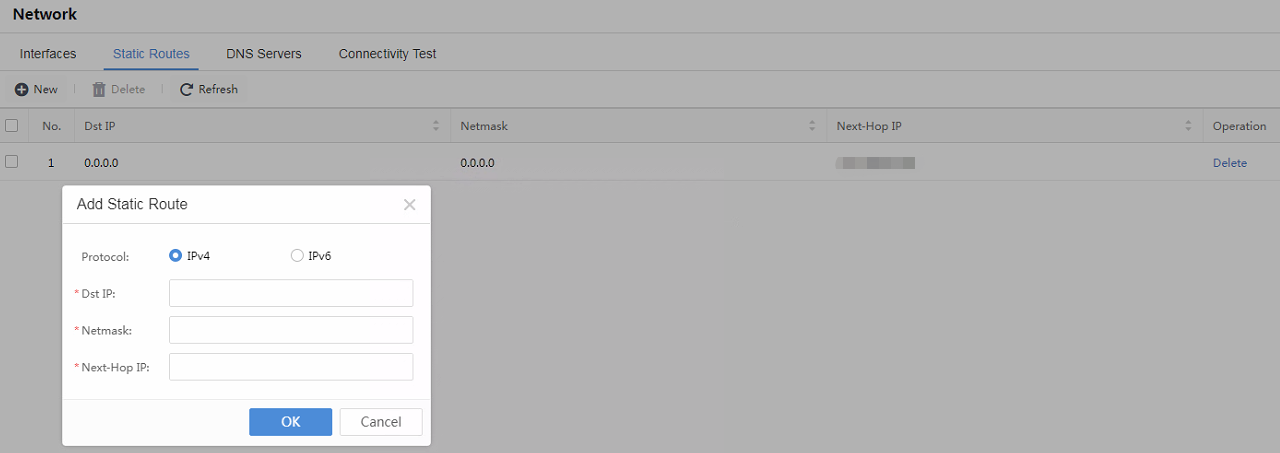
After the configuration, click OK to submit.
Configure the DNS Serversfor Cyber Command to resolve domains.
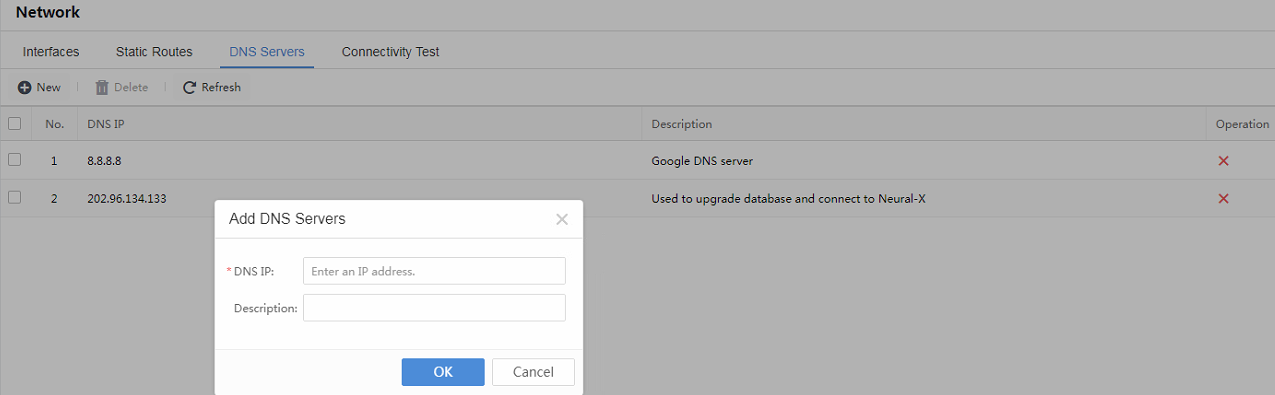
Using the Connectivity Test feature, you can perform basic ICMP testing for some target IP addresses (not including URLs).
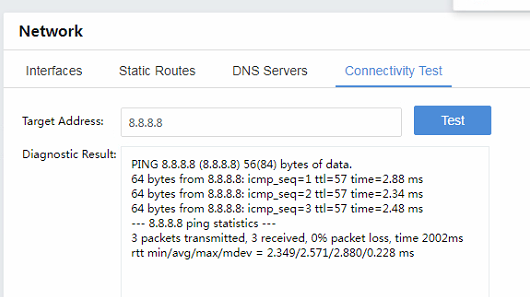
General
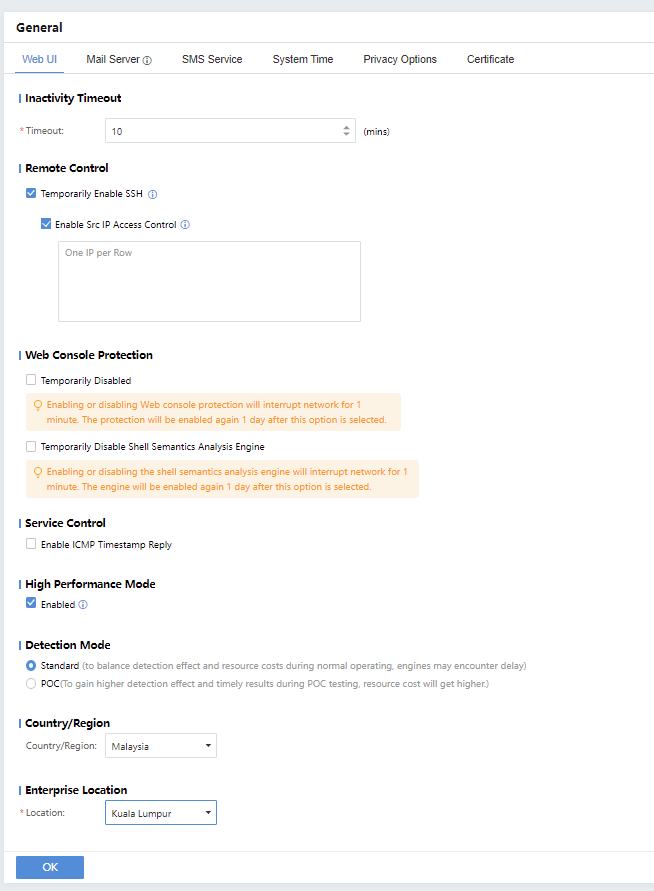
Inactivity Timeout:Web UI will become inactive after a specific time.
Remote Control:You can Temporarily Enable SSH and Enable Src IP Access Control.
Web Console Protection:Temporarily disable the Web console protection or temporarily disable the Shell Semantics Analysis Engine.
Service Control:You can choose to Enable ICMP Timestamp Reply.
High Performance Mode:The mode will enable caching technique to offer a smoother experience.
Detection Mode:Choose the detection mode.
Country/Region:Select the current country or region.
Configure the Mail Server as shown below.
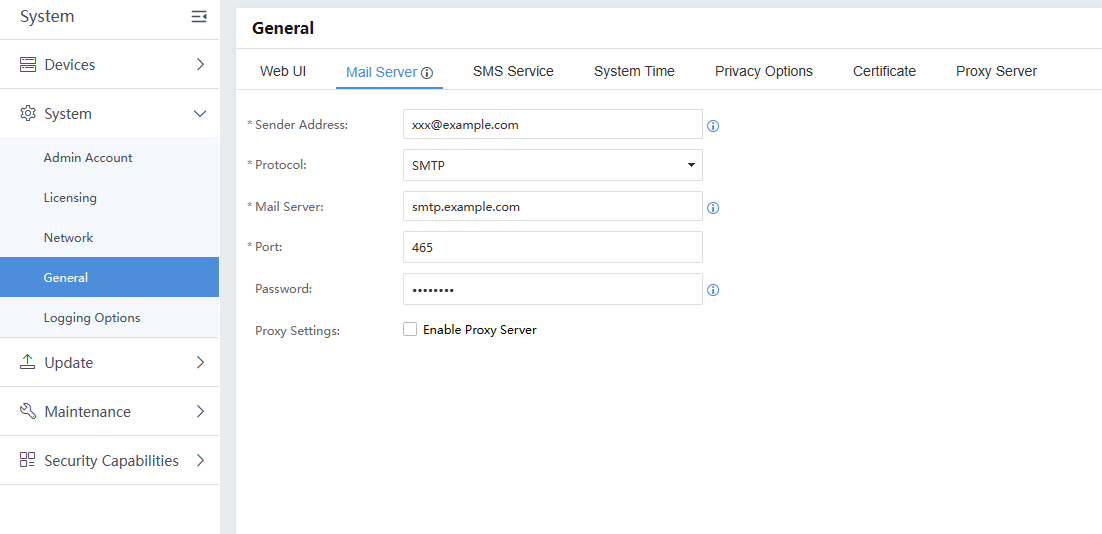
Sender Address:Refer to the email address for sending warnings or reports.
Protocol:Select SMTP or Exchange.
Mail Server:Refer to the email server address for sending the email.
Port:Refer to the port of the email server, which is a 25 port by default.
Password:Refer to the password for logging in to the email address.
Proxy Settings:Check to send email via proxy server.
- Click Send Test Email to test whether the configured email information is correct.
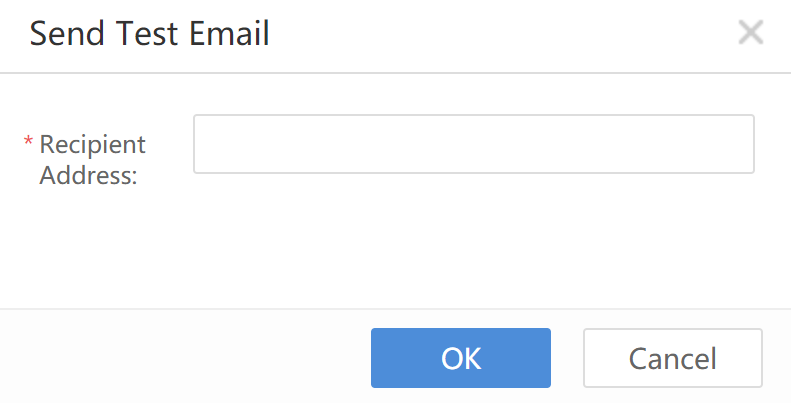
Fill in an email address to receive the email. Click OK to test.
Configure the Certificate as below:
Cyber Command supports importing the PFX,P12,.crt+.key, or PEM certificates to the web console as web console certificates.
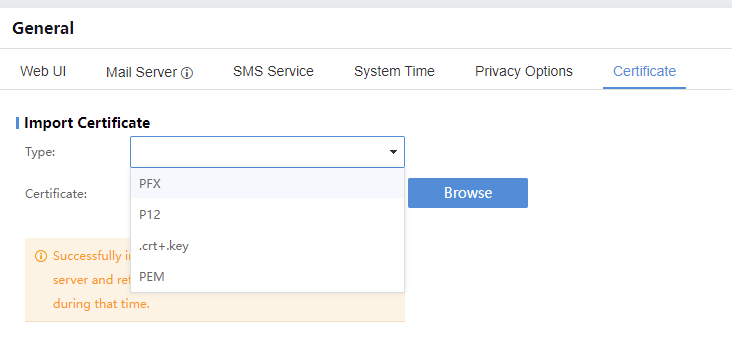
Logging Options
Set log data recorded by the Cyber Command.
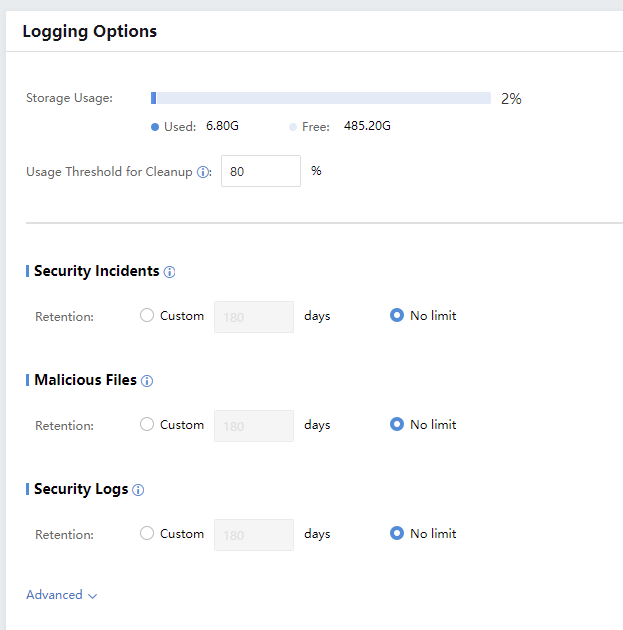
Usage Threshold for Cleanup:Logs will be automatically deleted when the stored logs exceed the set ratio.
Security Logs: Including vulnerability exploit, web attack, botnet, business system weakness, DNS attack, email security, file security, etc.
Update
It is used to update the platform’s management, STA, and signature database.
System Update
Import the update package through the console, and downgrading is not supported.
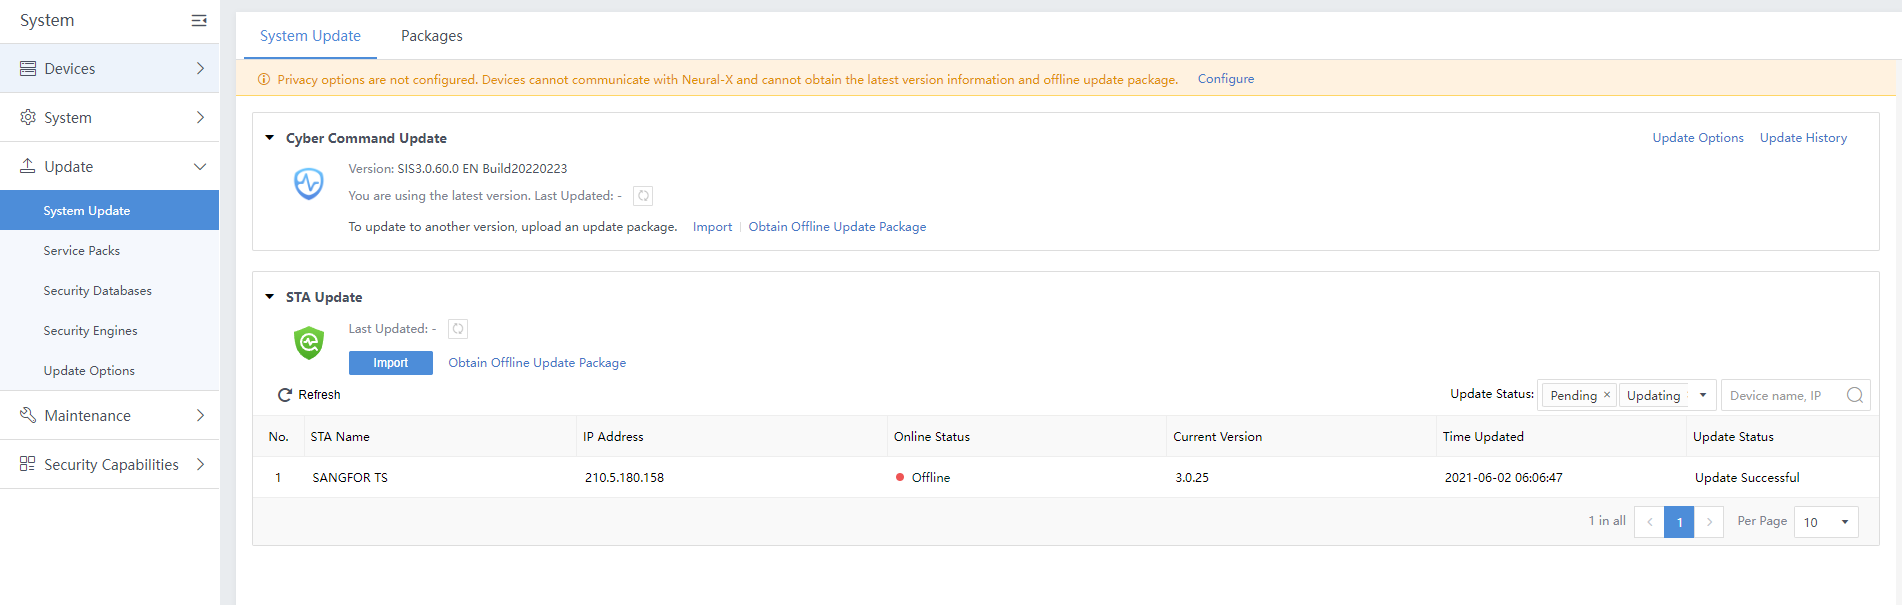
Note:
- STA software update: Detect whether there is a new version on the platform every 10 minutes. When there are multiple STAs, only one can download the update package within each period, thereby reducing the impacts on the network by high traffic.
- STA rule database update: Detect the STA rule database and platform every hour. The STA is not required to access the Internet to update the signature database.
Service Packs
The service packs show the service pack file installation status for the Cyber Command.
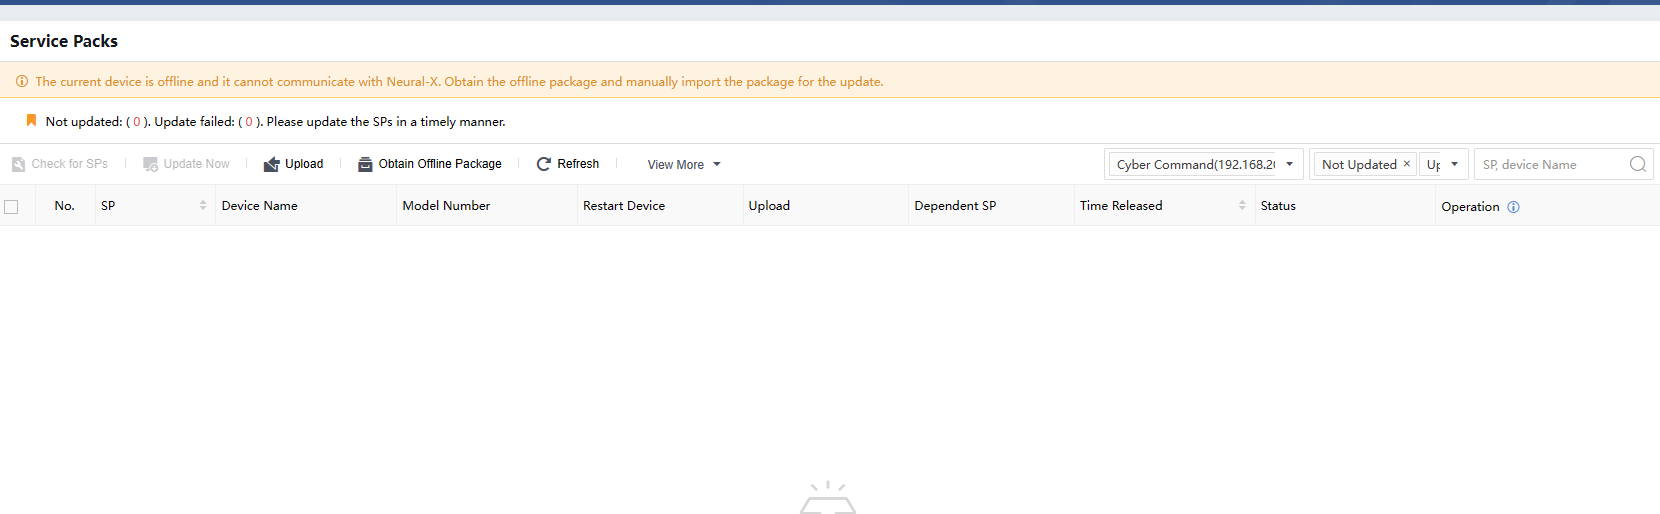
Security Databases
The Cyber Command’s security databases can be updated online or through manual import.
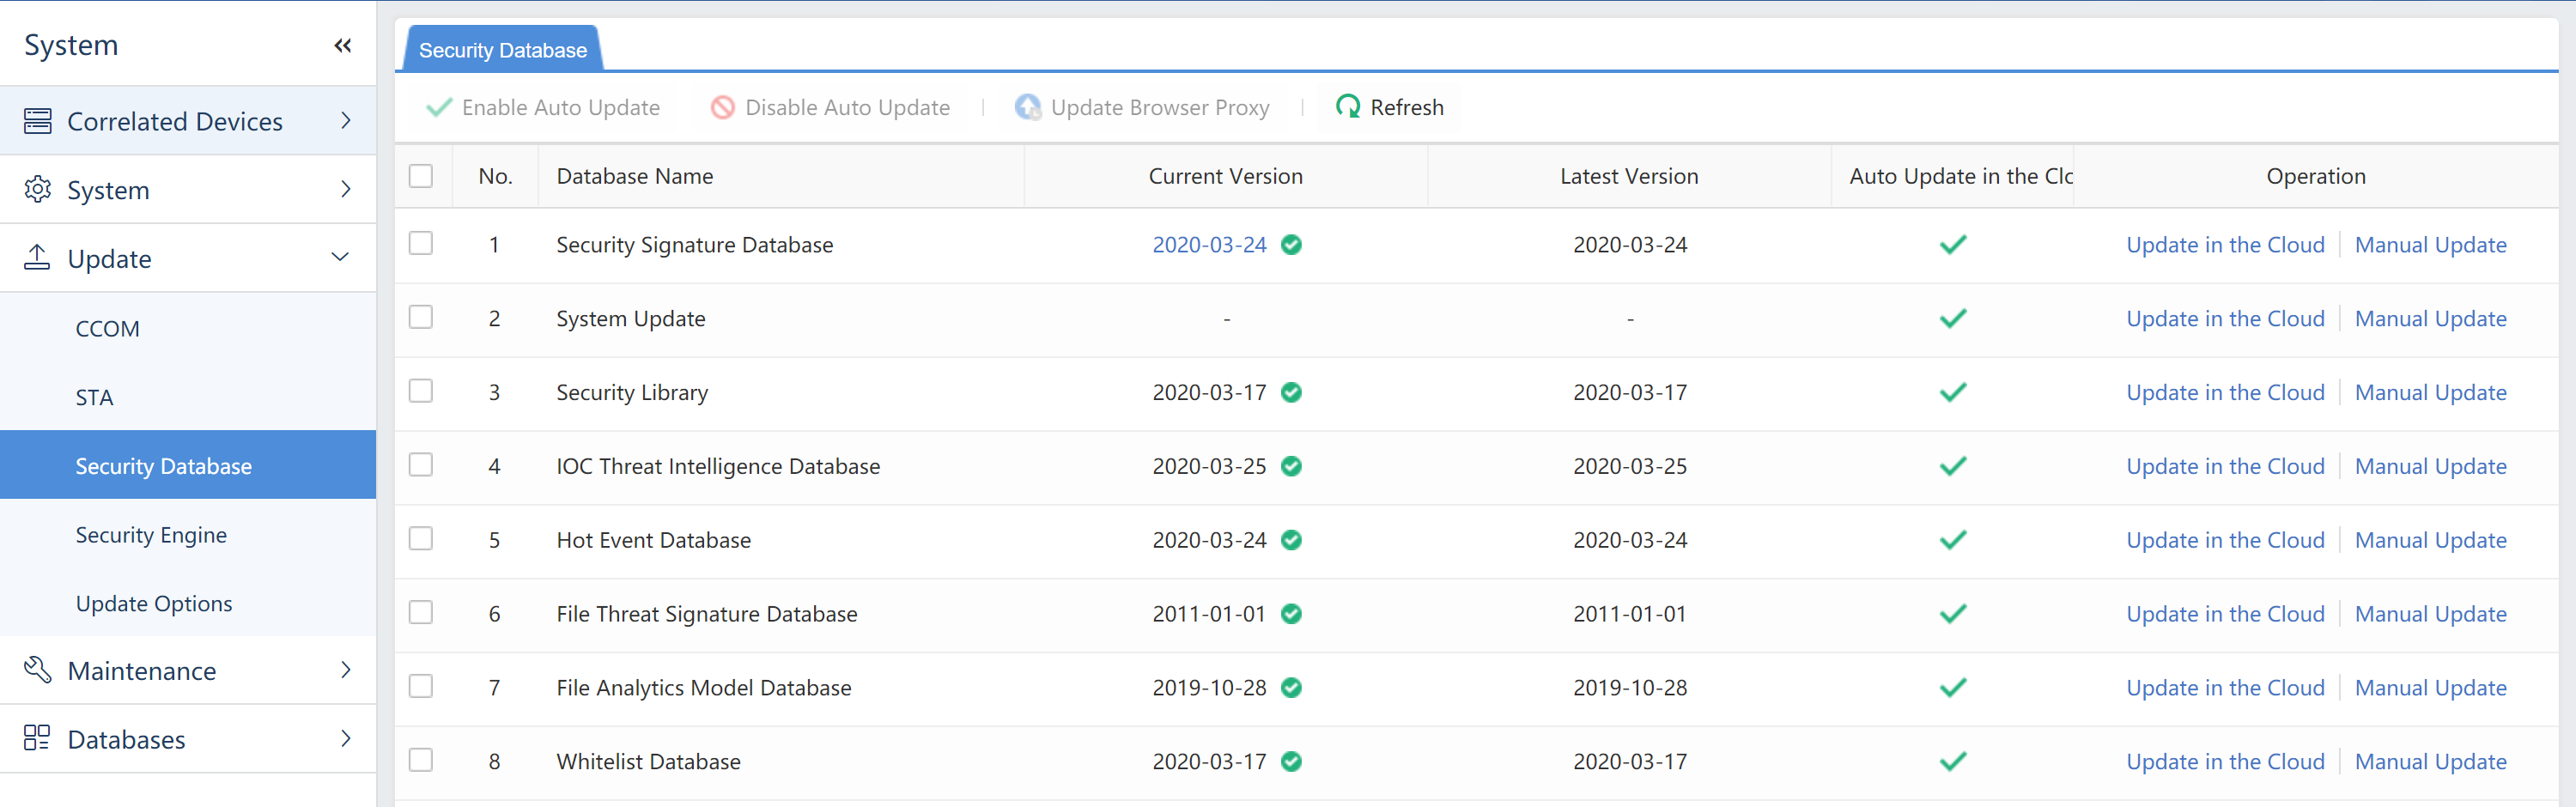
Security Engines
The security engines analyze and locate security risks by recognizing malicious behaviors.
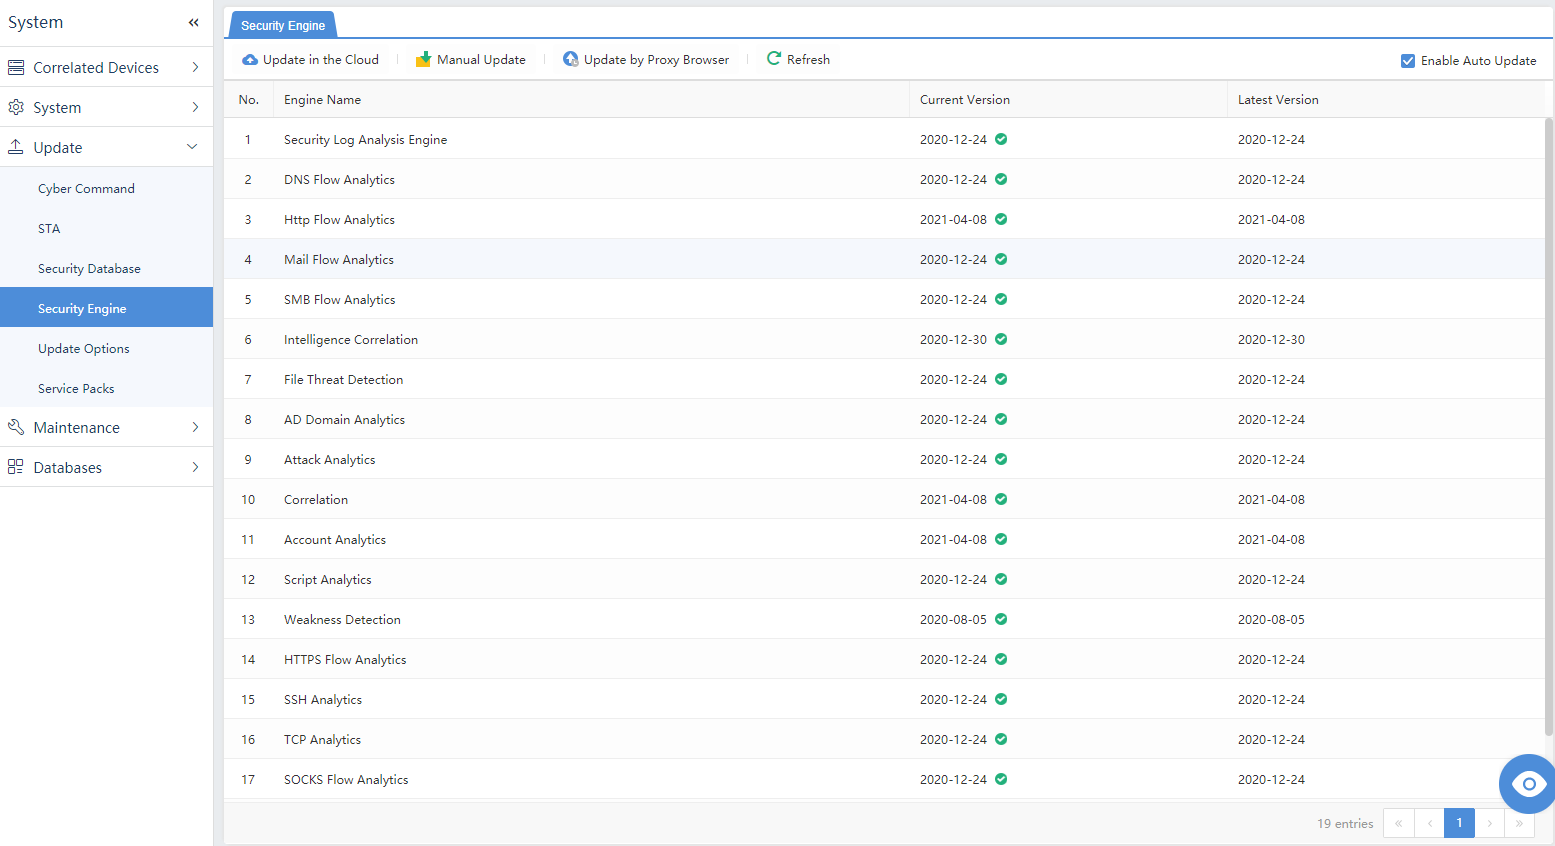
Update Options
Configure the internet settings of Cyber Command to access the UpdateServer.
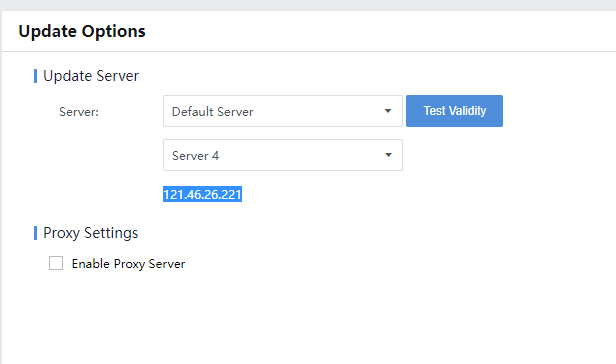
The UpdateServer includes the following:
- Server 1: update1.sangfor.net
- Server 2: update2.sangfor.net
- Server 3: update3.sangfor.net
- Server 4: 121.46.26.221
Proxy Settings:The user can use proxy settings when an HTTP proxy server is on the network. Click OK to submit.
Maintenance
It is for engineers to perform troubleshooting.
System
The user can view the usage of the platform CPU, Memory, Disk (Data Partition), Disk (System Partition), and Disk (Log Partition).
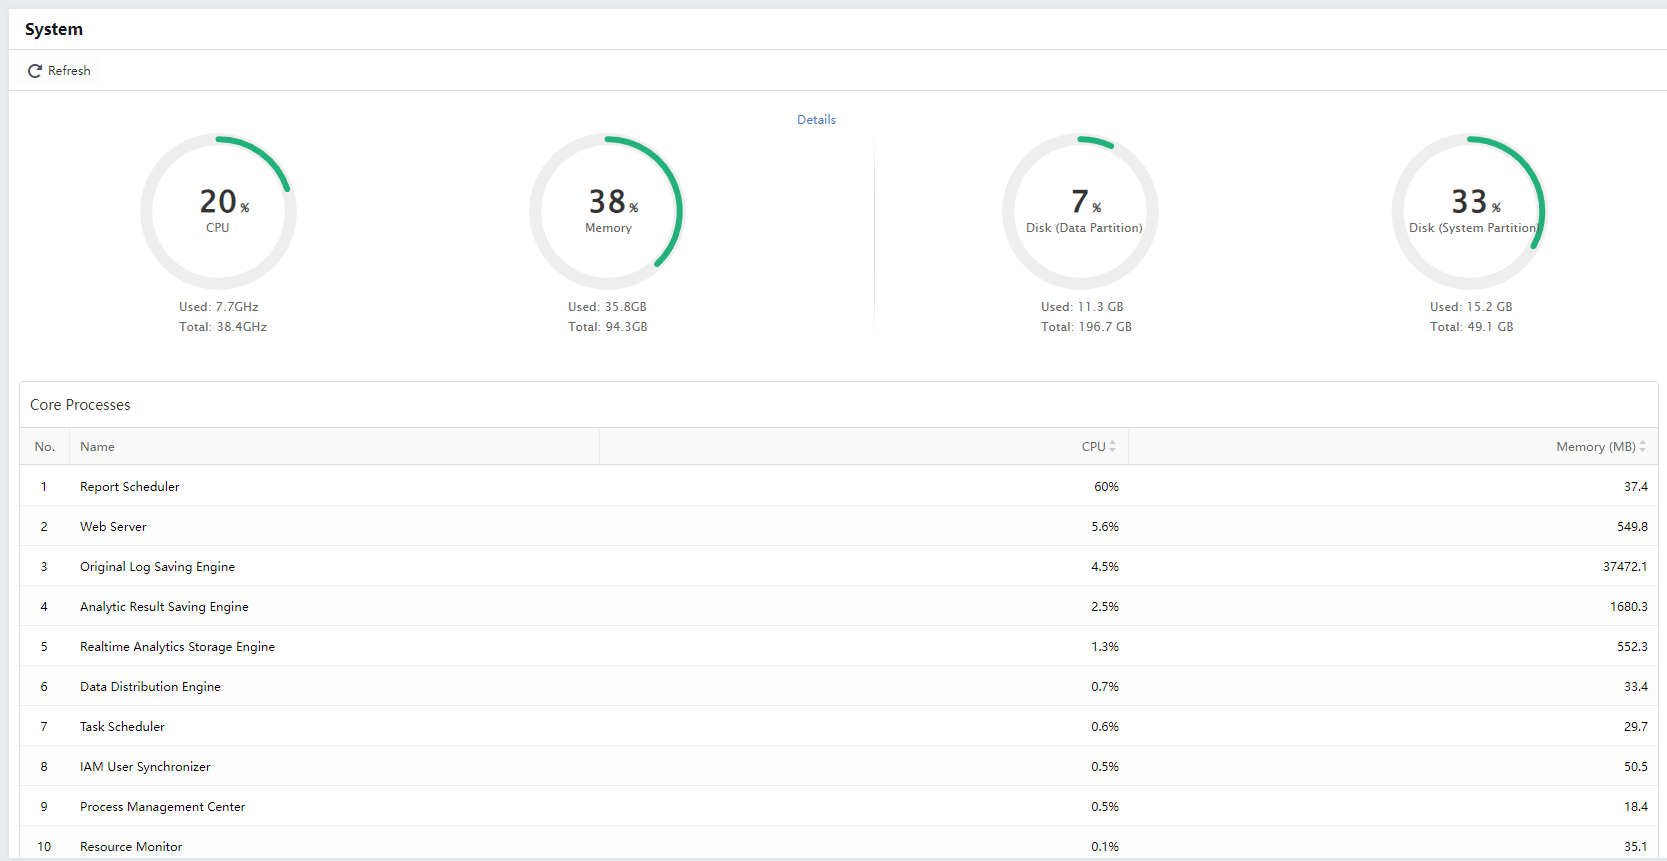
Data Backup
Back up security logs on the Cyber Command and upload them to the FTP server.
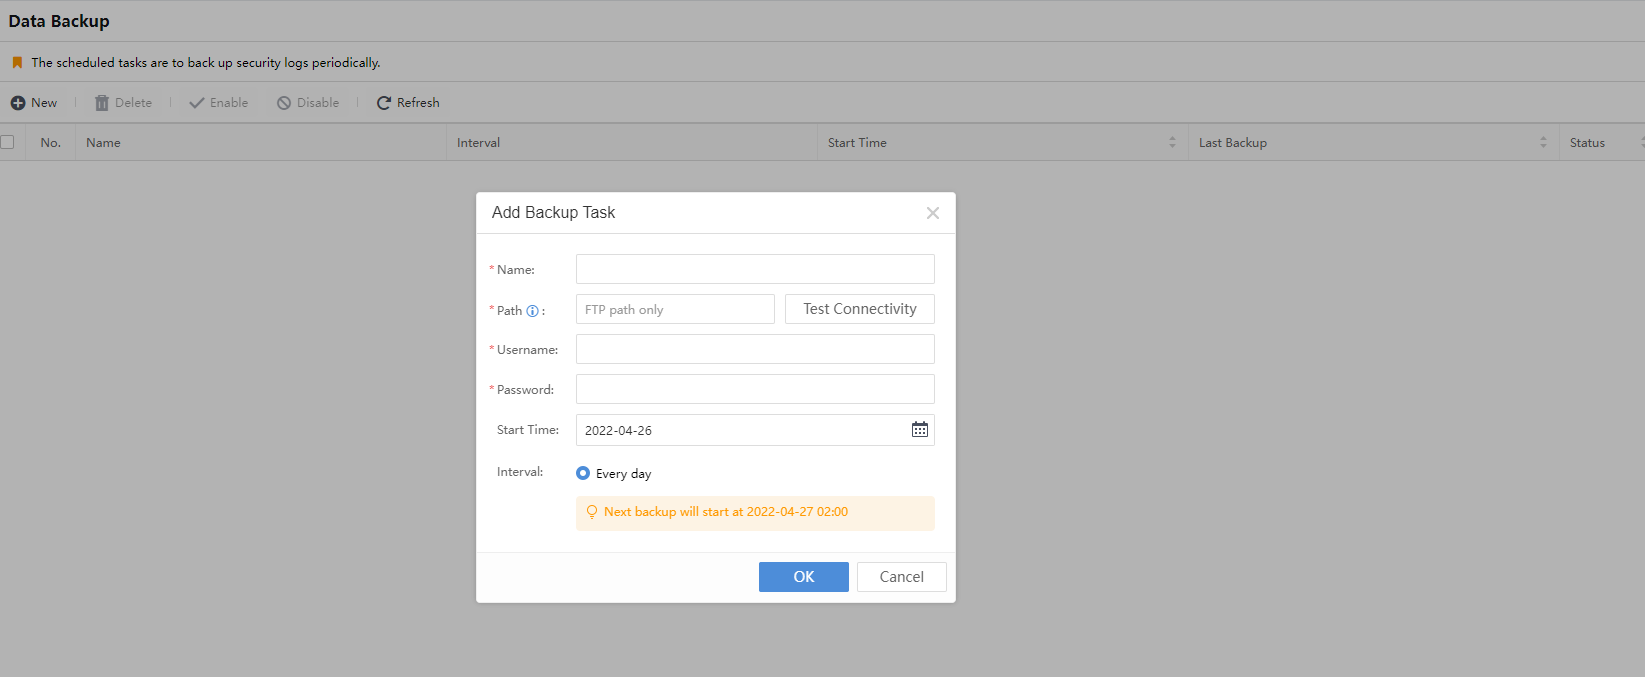
Name:The name of the policy.
Path:Configure a path for storing backup files on the FTP server.
Username:Refer to the account of the FTP server.
Password:Refer to the password of the FTP server account.
Start Time:Select the time for starting the backup.
Interval:Back up every day.
Restore/Restart
It is to restore factory settings and restart the Cyber Command. Clicking Restore Factory Defaults will delete all data and platform settings. Please be cautious.
Click Restartto restart the Cyber Command. As the Cyber Command is deployed in a single-arm mode, restart will not affect the network.
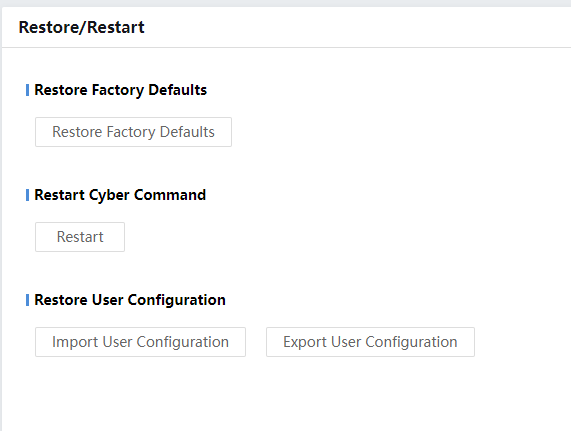
System Check
One-click system health check to see whether the platform and STA configurations are complete. If the platform has just been installed or the device reports alerts, please pay attention to the items.
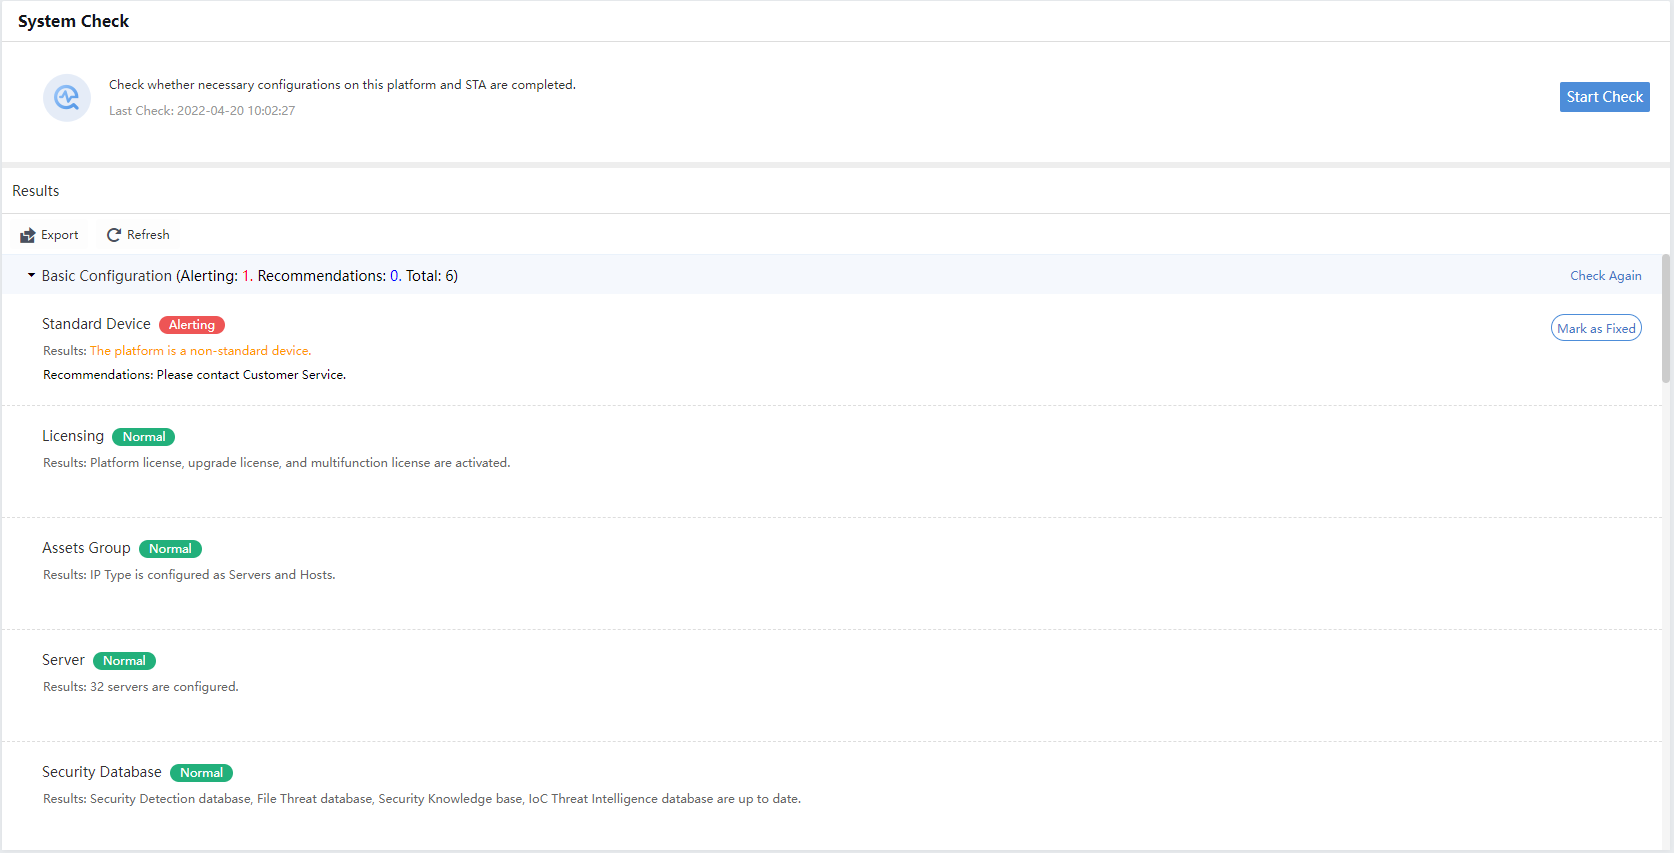
Basic Configuration: Check basic configuration items, including standard device inspection, license key, monitored internal IP address group, business system/server, rule database, and log analysis engine.
Licensing:Check whether the platform license, upgrade license, and multifunction license are activated.
Connected Devices: Inspect the connectivity of the platform access port and access device.
Traffic Detection: Inspect whether the traffic image is correct. The monitored internal IP address group shall be configured in advance.
Proxy Detection:Recognize the proxy server.
Security Capabilities
Security capability configuration includes Security Database, Detection Engines, Whitelists, File Detection, and Weak Password Rules.
Detection Engines
The detection engines mainly implement the five built-in detection engines: Rule Detection Engine,Intelligence Detection Engine,File Analytics,Attack Analytics, and Abnormal Behavior Engine, to perform operations such as rule editing, display query, and adding.
Display query
On the System> Security Capabilities > Detection Engines page, each detection engine identifies the number of rules and engine profiles. Place the mouse over the Threat Name to see the specific content. The attributes of each rule in the list include Alert ID, Incident ID, Threat Name, Severity,Threat Type, Time Created,Status, Security Alerts, Security Incidents, Operation, etc., as shown in the figure below.
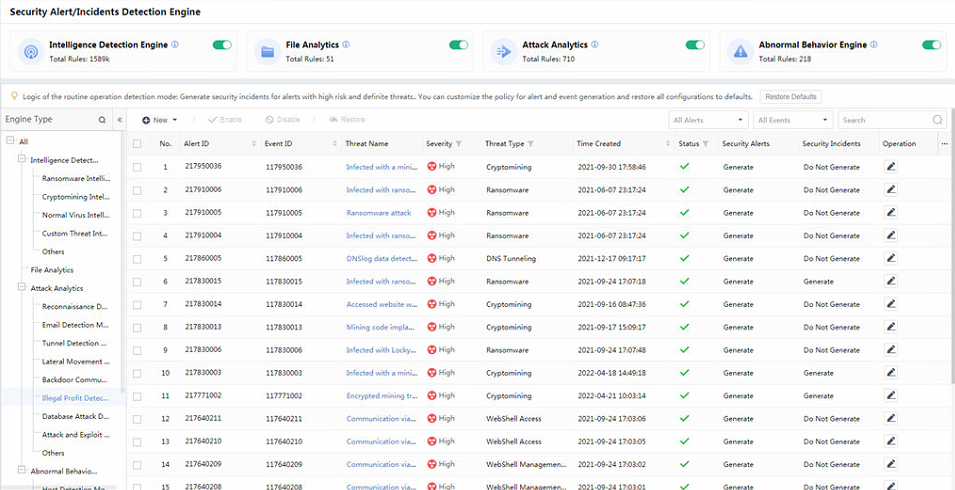
Severity:Divided into High, Medium, and Low.
Threat Type:Consistent with classifying Security Incidents and Security Alert threats in the processing center.
Library type:The classification name of the rule library.
Status:You can manually modify the status of each rule. The green mark represents the enabled status, while the red mark represents the disabled status.
The rule list can be classified and displayed according to the Threat Type and Severity, and the rules can be fuzzy searched according to the keyword/rule ID, as shown in the figure below.
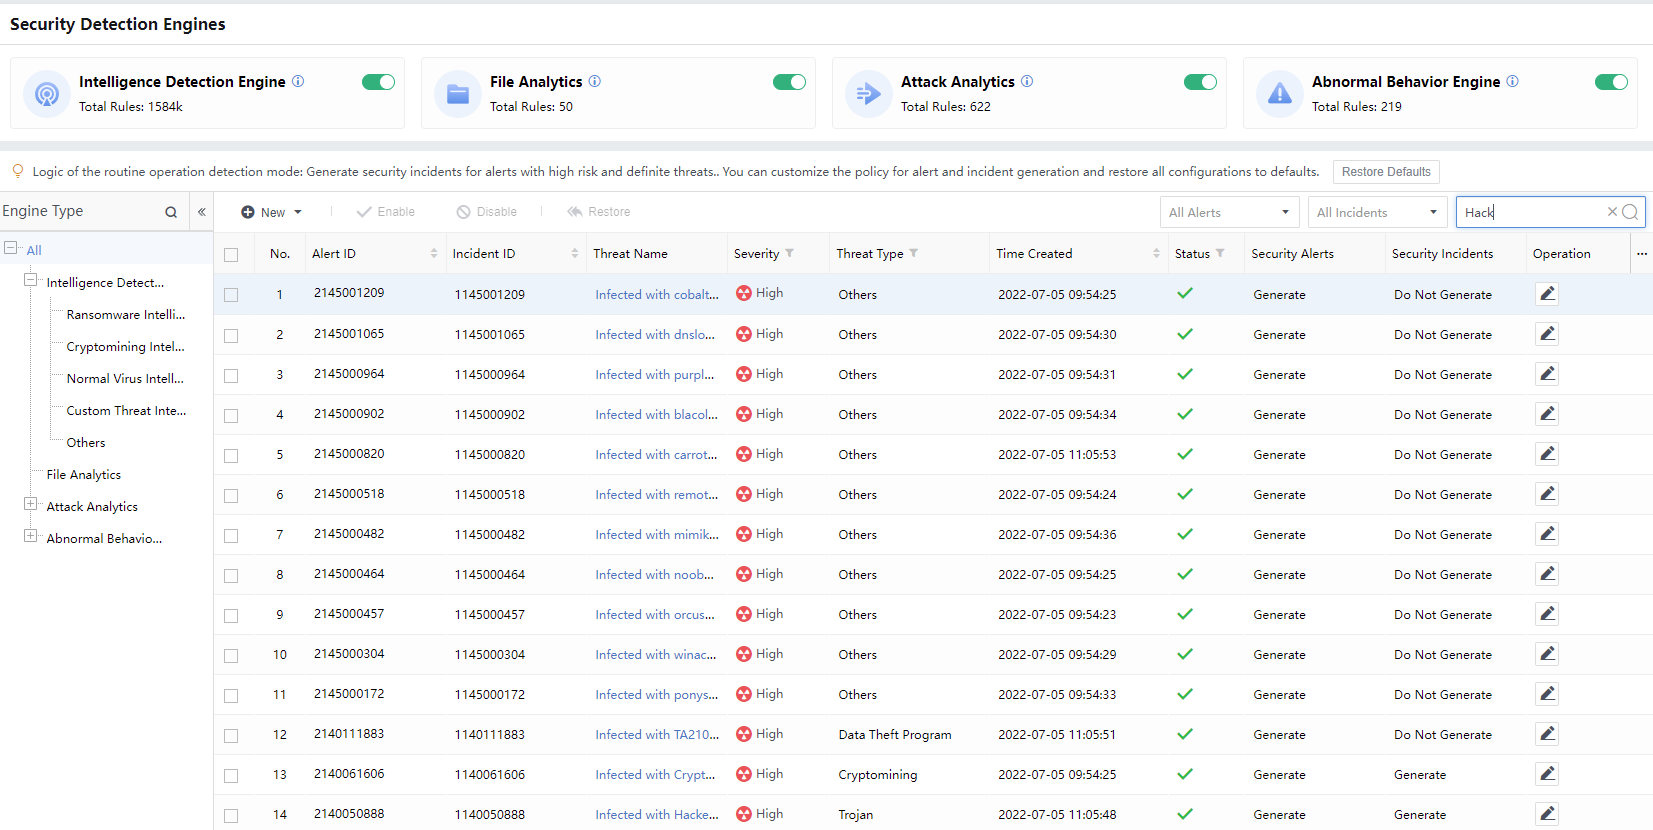
You can also perform a fuzzy search in the search bar based on the keywords, as shown in the figure below.
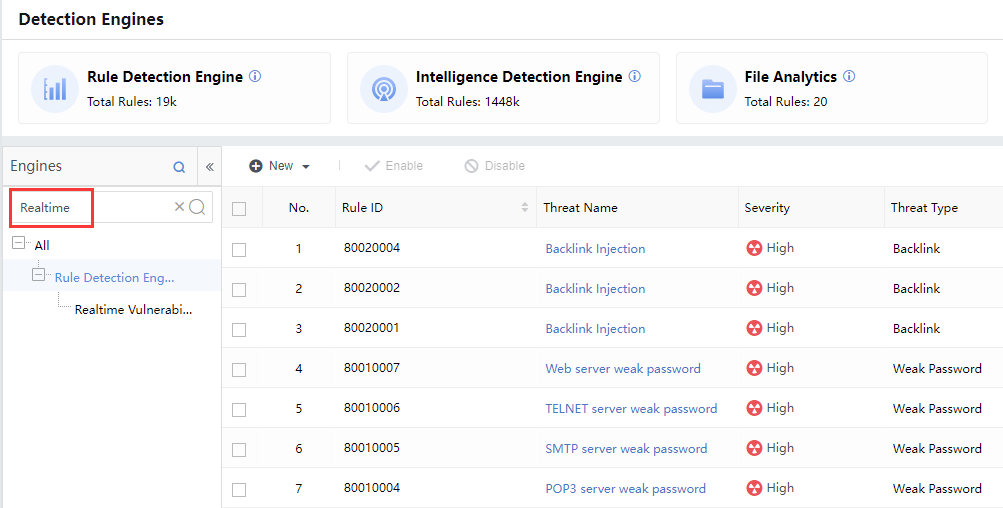
In the rule list, you can click the icon of each rule to edit it.
Edit the Rule
On the System > Security Capabilities > Detection Engines page, select one or more rules and click Enable or Disable to enable or disable in batches, as shown in the figure below.
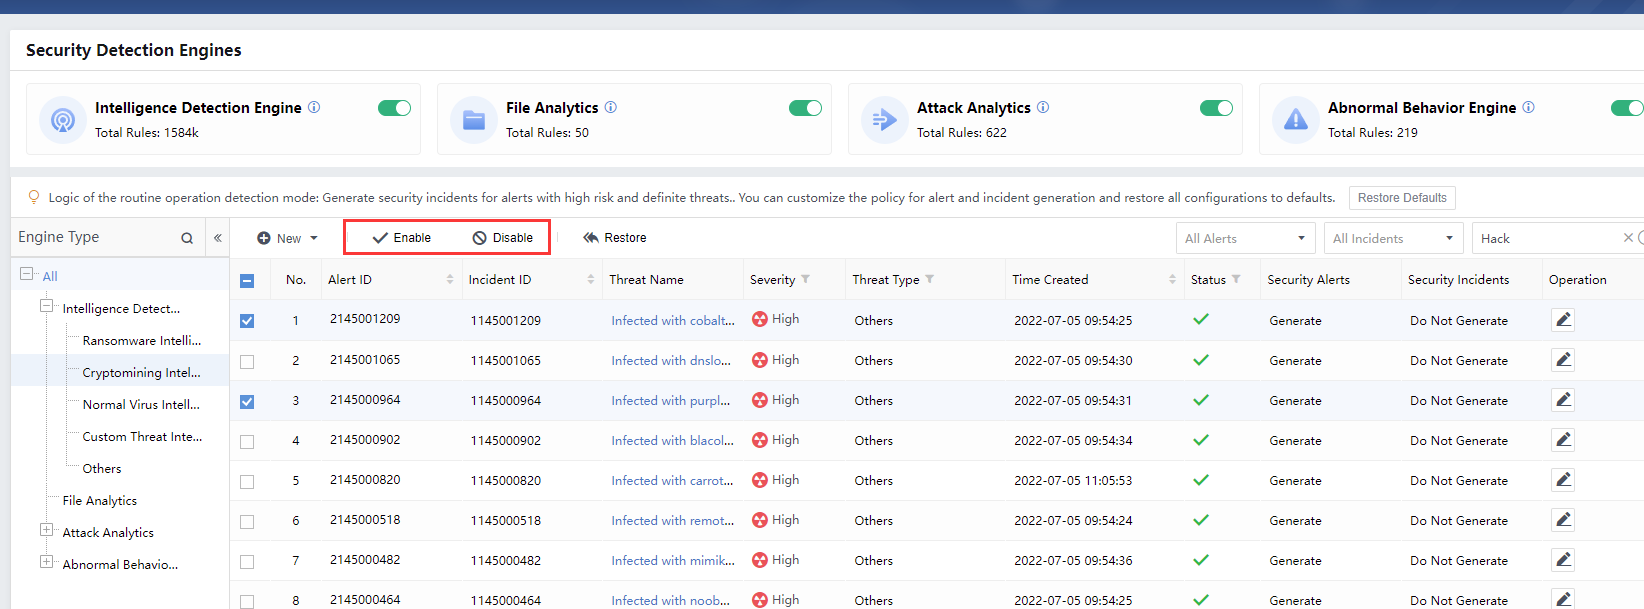
Click the edit icon to enter the Rule Details page to view the details, including Status, RuleID, Threat Name, Threat Type, Impacts, Severity, etc. You can manually select Enabled or Disabled, or select the Severity level from the drop-down list, as shown in the figure below.
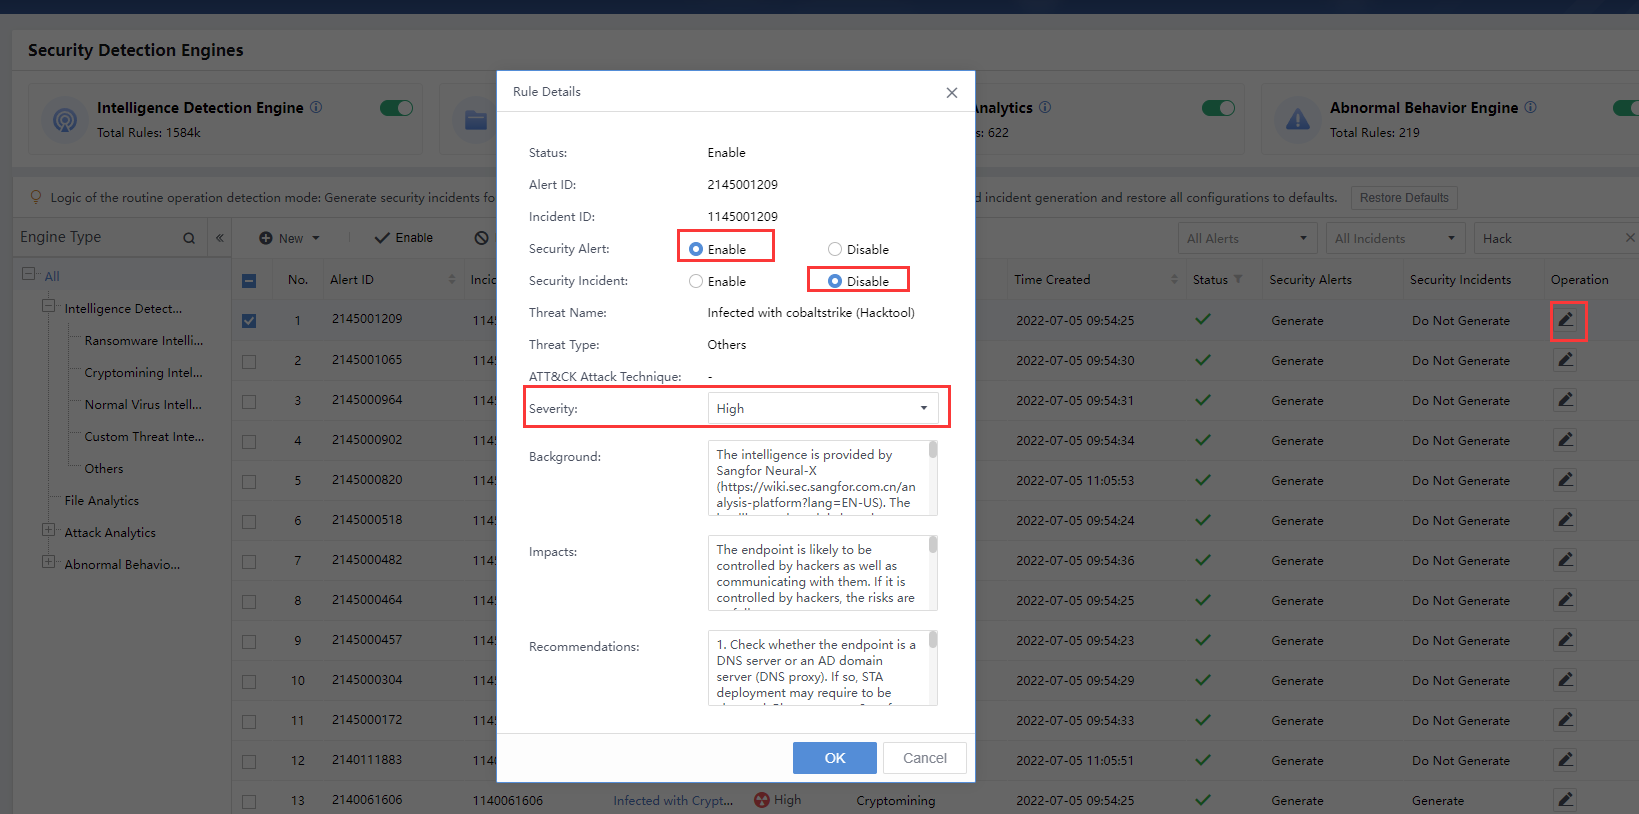
Custom Intelligence
On the System > Security Capabilities > Detection Engines page, click New and select Custom Intelligence, as shown in the figure below.
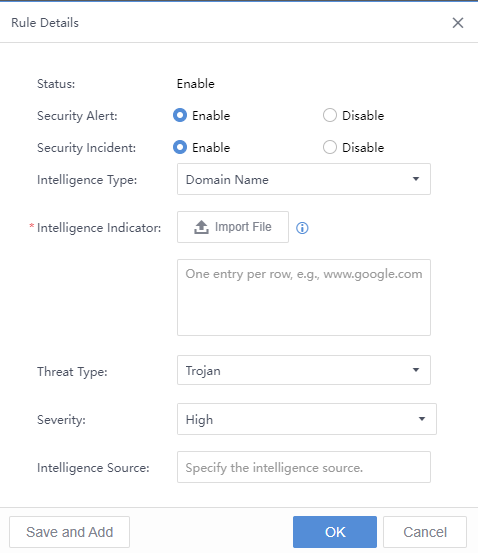
Status:Enabledby default.
Security Alert:Select Enabled to generate the security alert.
Security Incident:Select Enabled to generate the security incident.
Intelligence Type:Choose the intelligence type.
Intelligence Indicator:Import the .txt file up to 50000 IOCs.
Threat Type:Select the threat type.
Severity:The severity of the rules is classified into High, Medium, and Low.
Intelligence Source:Specify the intelligence source.
Whitelists
Add proxy servers, missed scanning devices, and other devices judged to be known business behaviors into the whitelist. The whitelist includes a security whitelist and an audit whitelist. The overview page is shown below.

Audit Whitelist:Traffic that matches the whitelist will not be audited.
Security Whitelist:No alerts or events will be generated for the logs that match the whitelist. The platform no longer generates corresponding alerts and events, including the Security Alert Whitelist and Weakness Scan Whitelist, as shown in the figure below.
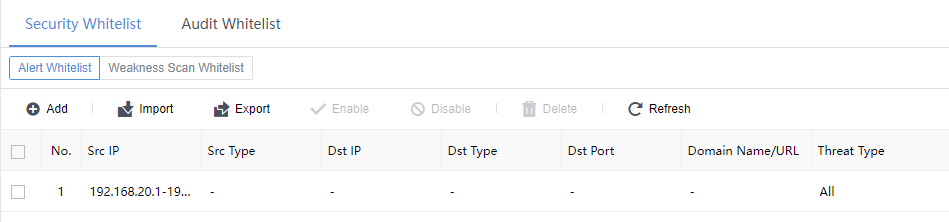
Analyze:The stage of generating Security Alerts, followed by Security Incidents.
- Create a Security Whitelist
The security whitelist is suitable for scenarios where Security Alerts or Security Incidents are whitened and adjusted at the log level.
Add Whitelist Entry
On the System >Security Capabilities>Whitelists page, click Security Whitelist, then select the Security Alert Whitelist tab. Click Add to enter the Add Security Alert Whitelistpage.
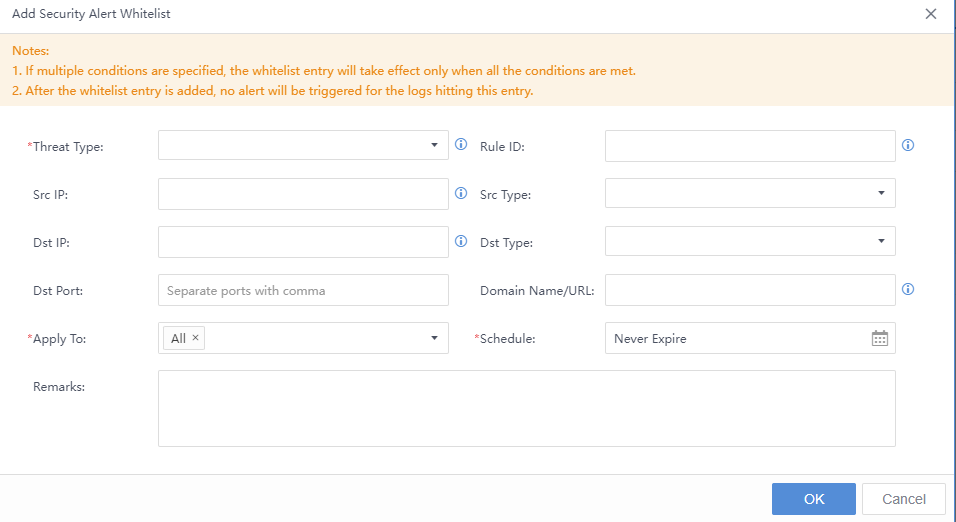
Src IP:After being added, data with this IP as the source will not record alerts.
Dst IP:After being added, data with this IP as the destination will not record alerts.
Domain Name/URL:After joining, no alert will be recorded when accessing the data of the domain name/URL.
Threat Type:Matched alert classification.
Rule ID:No alert will be recorded if the corresponding rule ID is matched.
Applicable Device:The effective range of the whitelist applies to.
Remarks:Fill in the remark information.
- A fuzzy search can be performed, as shown in the figure below.
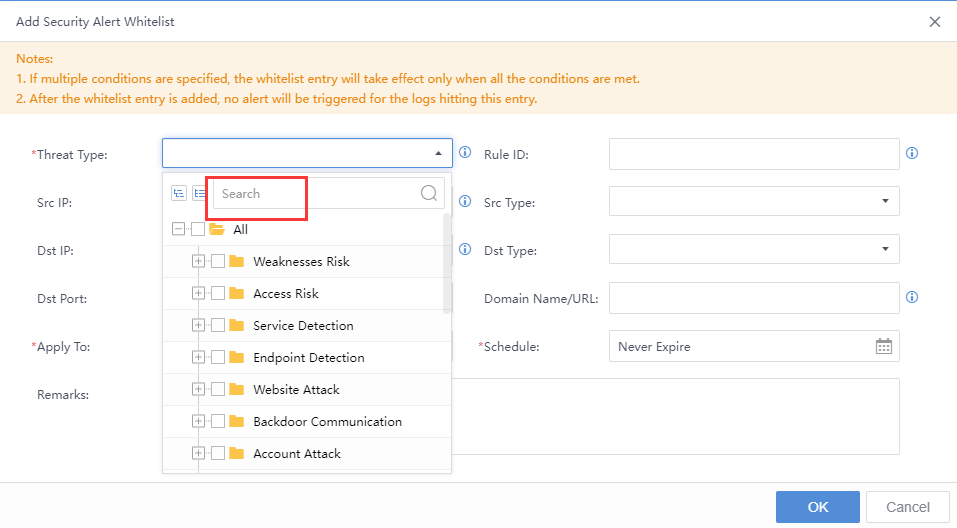
Import and Export Configuration
- You can import and export the Security Alert Whitelist configuration details in the .xlsx file.
Import File:
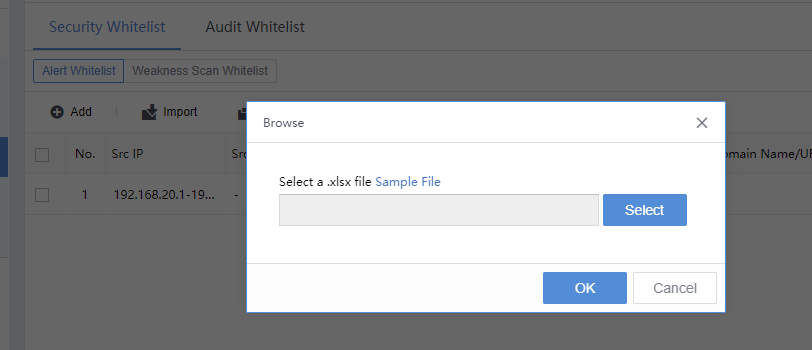
Export File:
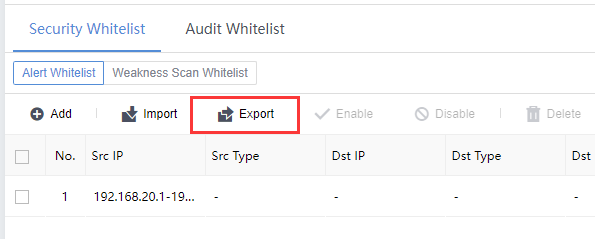
Note:
- There is a one-to-one correspondence between the types of alerts on the page and the types of threats in the processing center’s Security Incidents/Security Alerts.
- If multiple conditions are specified, the whitelist will take effect only when all the conditions are hit.
Weakness Scan Whitelist
Under the Weakness Scan Whitelist tab, click Add to enter the Add Weakness Scan Whitelist page. Enter the IP address, URL, username, rule ID, asset group, risk type, and other information, then click OK, as shown below.
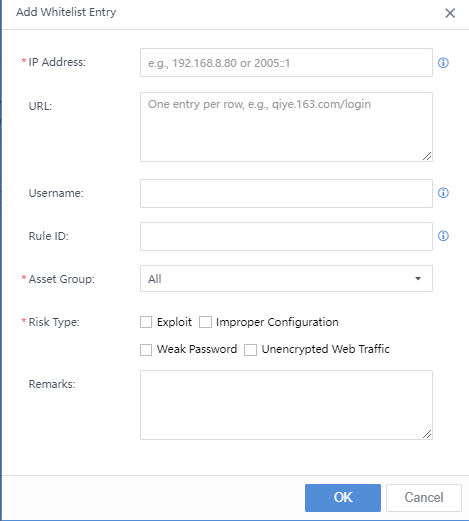
Import and Export
- You can import and export the Weakness Scan Whitelist configuration details in the .xlsx file.
Import File:
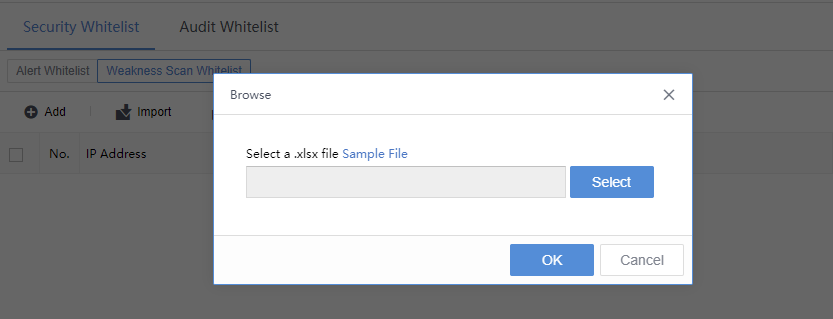
Export File:
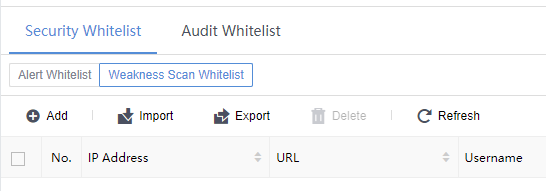
Audit Whitelist
The audit whitelist scenario is suitable for whitening logs at the traffic level. The whitelisted IP addresses will not generate logs. Else, it will generate Security Alerts and Security Incidents.
On the System>Security Capabilities>Whitelists page, under the Audit Whitelist tab, click Add to enter the Add Audit Whitelistdialog box. Next, fill in the source IP, destination IP, log type, and other information, as shown below.
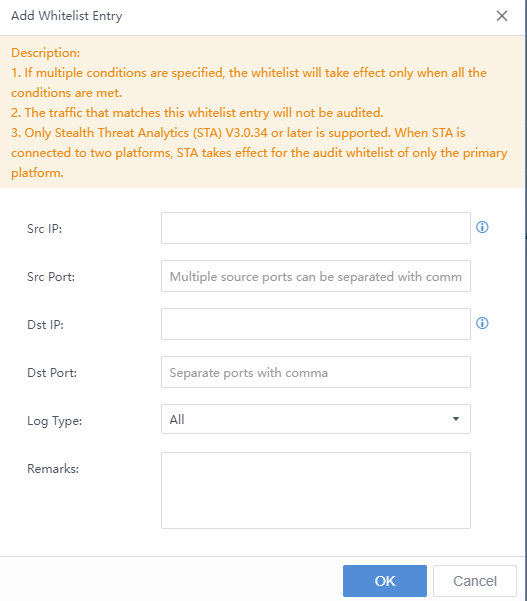
In the Risk Type drop-down list, you can perform a fuzzy search based on keywords, as shown in the figure below.
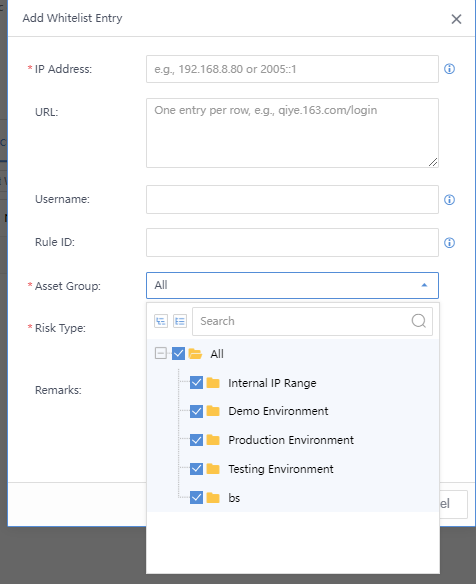
Src IP:After being added, the data with this IP as the source will not be recorded in the log.
Dst IP:After being added, the data with this IP as the destination will not be recorded in the log.
Log Type:The category of the matched log.
Remarks:Fill in the remark information.
-
Import and Export Configuration
-
You can import and export the Audit Whitelist configuration details in the .xlsx format.
Import File:
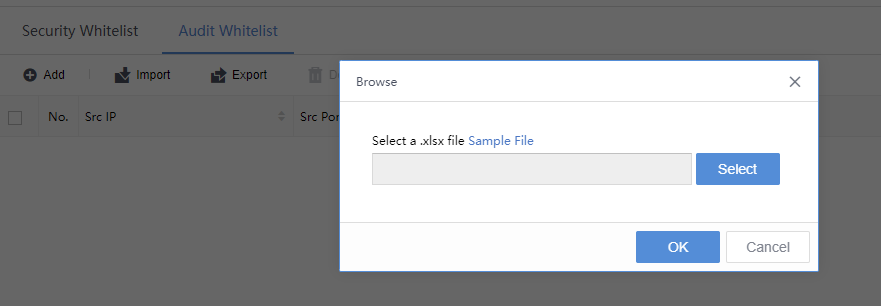
Export File:
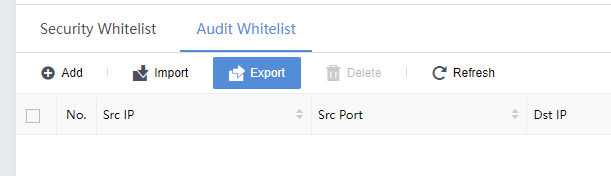
Note: Once the IP has been whitelisted, the system will filter out the matched traffic data.
File Detection
The File Detection page corresponds to the Detection>Threats>File Threats function module, as shown in the figure below.
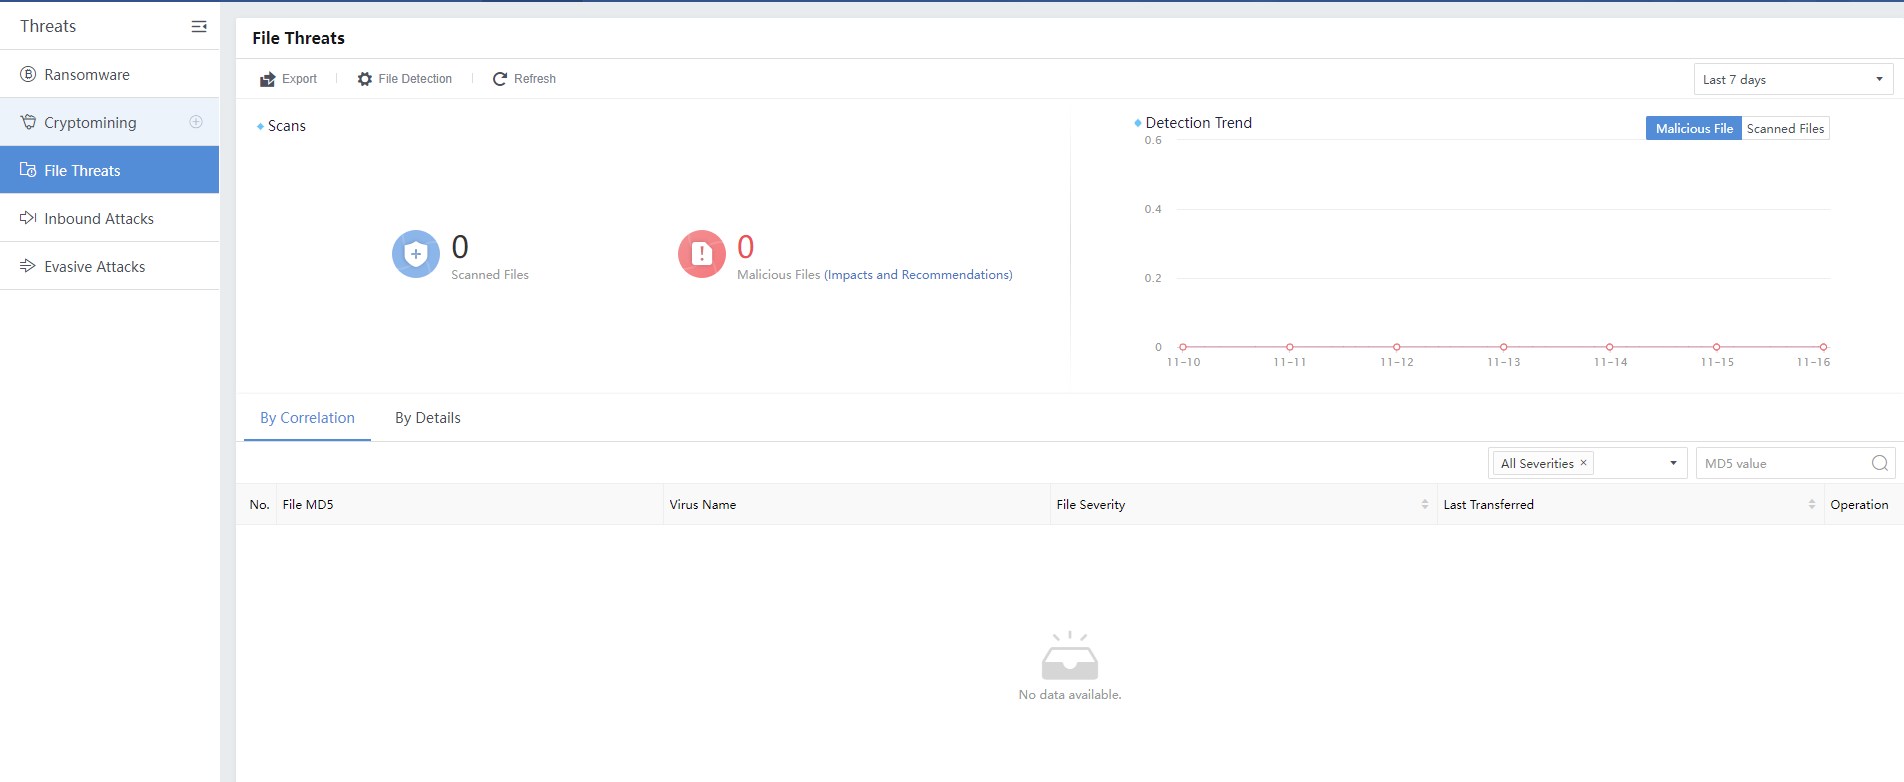
The administrator can adjust the file detection settings, including file analysis size (maximum 20MB), recognized protocol type, selected detection engine, etc., as shown in the following figure.
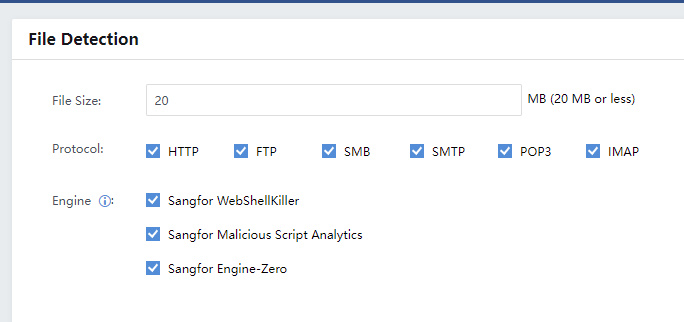
Select the required Protocoltypes: HTTP, FTP, SMB, SMTP, POP3, IMAP.
Detection engines include Sangfor WebShellKiller, Sangfor Malicious Script Analytics, and Sangfor Engine-Zero.
Weak Password Rules
The Weak Password Rules correspond to the Assets > Weaknesses > Weak Password function module, as shown below.
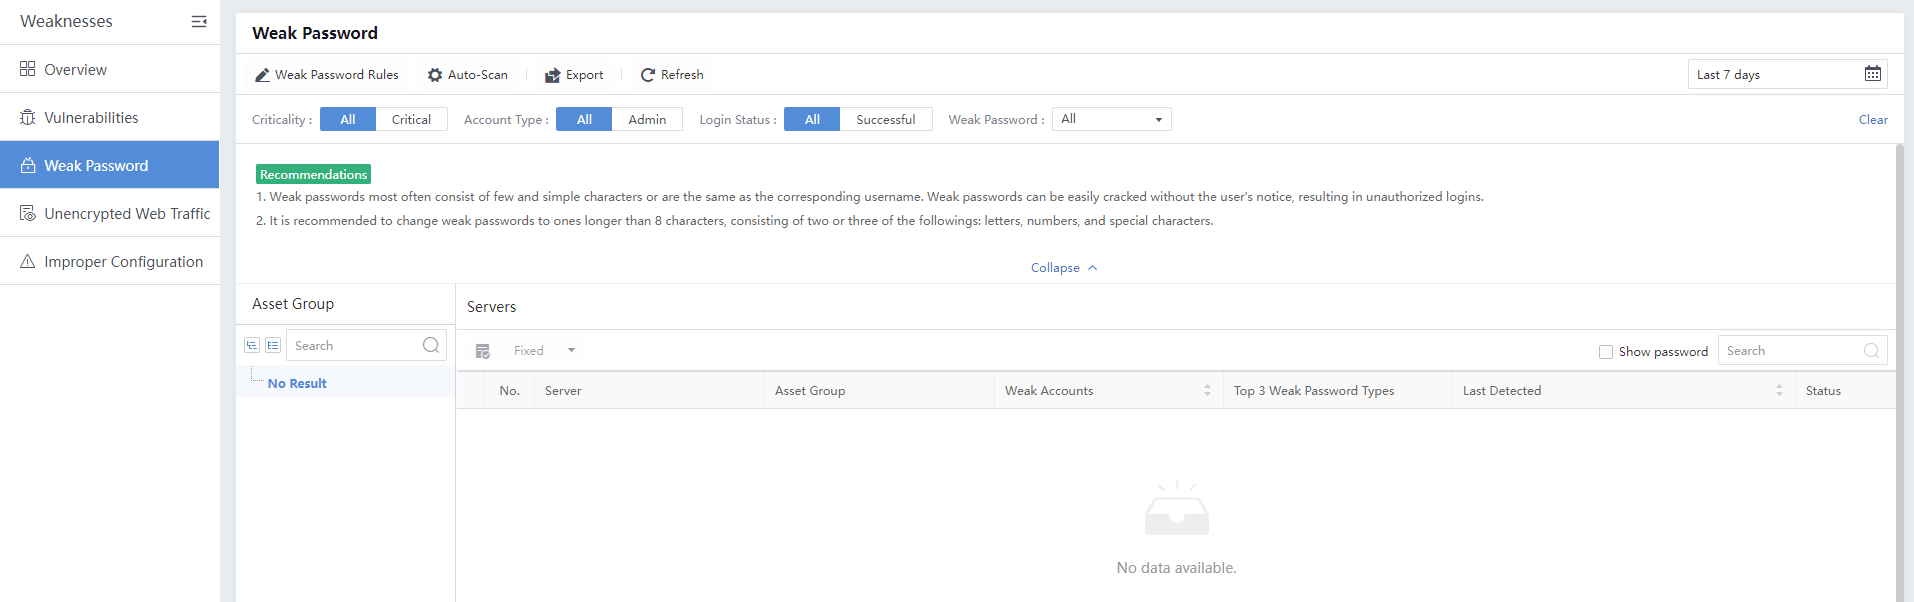
The weak password configuration includes default rules and custom rules. The built-in rules identify and detect all applications (web and non-web). The figure below shows that the default rules cannot be edited, modified, or deleted by default.
Custom Weak Password
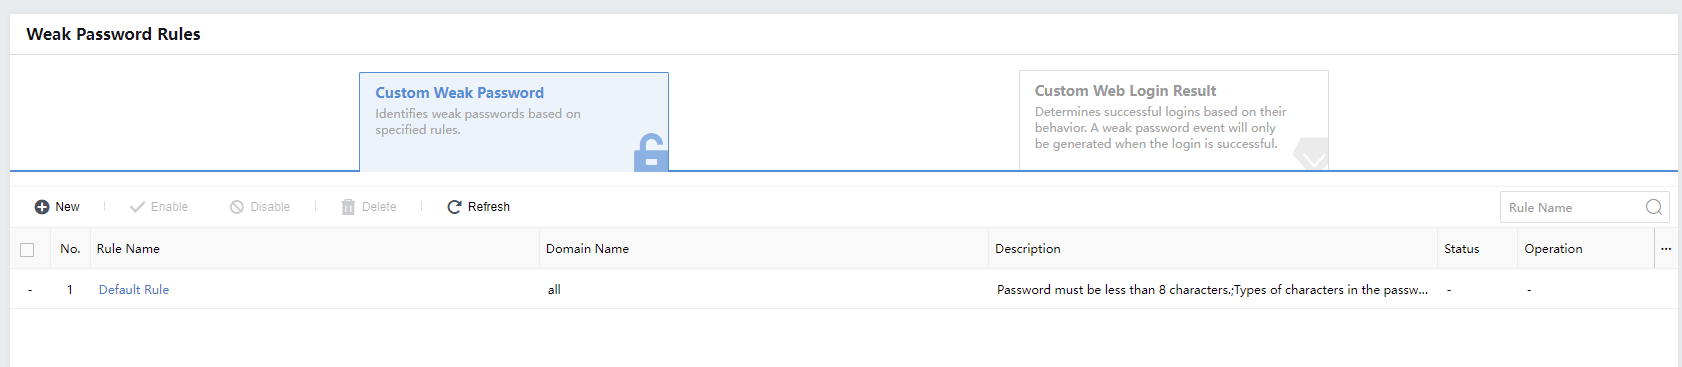
Navigate to System>Security Capabilities > Weak Password Rules and select the Custom Weak Password tab. Click the New button to enter the Add Rule page. The custom weak password rule is mainly for web applications. You need to specify the effective domain name, conditions, account whitelist, password whitelist, weak passwords, etc., as shown below.
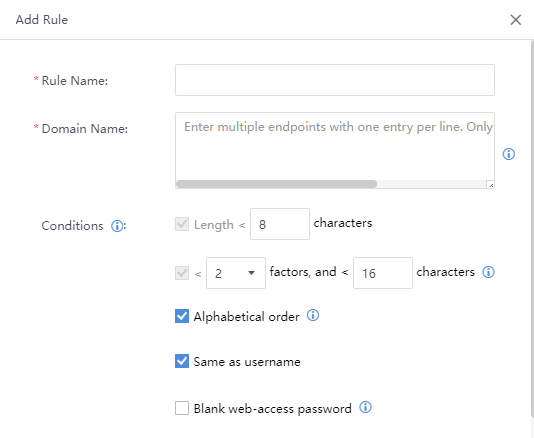
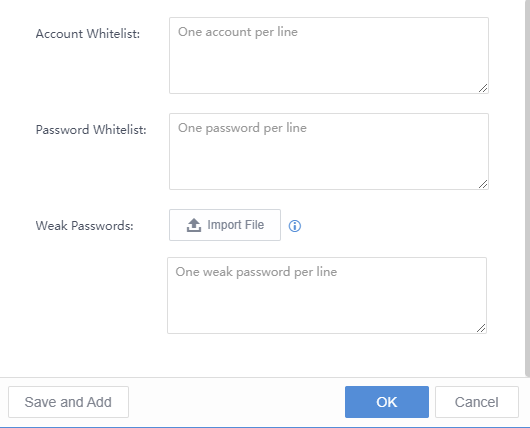
Rule Name:The name of the custom weak password database.
Domain Name:The domain name/URL to which the rule applies, for example, .
Among them, HTTP://belongs to the request protocol of the traffic, xxx belongs to the host address, which can be a domain name, hostname, or IP:80, /a/b/c belongs to the resource path, and ?1=1is a parameter.
- The rule needs to be configured with the domain name’s content by referring to the host value in the request traffic.
- Conditions: Including minimum password length, number of character types and digits, alphabetical order, same as username and Blank web-access password.
Account Whitelist:If the weak password obtained through product-side analysis does not meet the customer’s business scenario/actual status.
Weak Passwords:In the case of a small number, you can fill in the blank directly, or you can import in .txt format. Click Import File, as shown in the figure below.
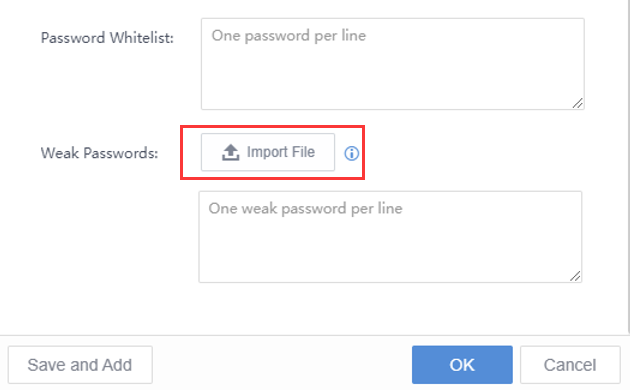
Note:
- For custom weak password rules and associated web domains/URLs, the maximum number does not exceed 50.
- Priority order: The priority of the custom weak password rule is higher than the default rule. It is to match the custom rule first and then the default rule.
Custom Web Login Result
Navigate to System>Security Capabilities > Weak Password Rules and select the Custom Web Login Result tab.
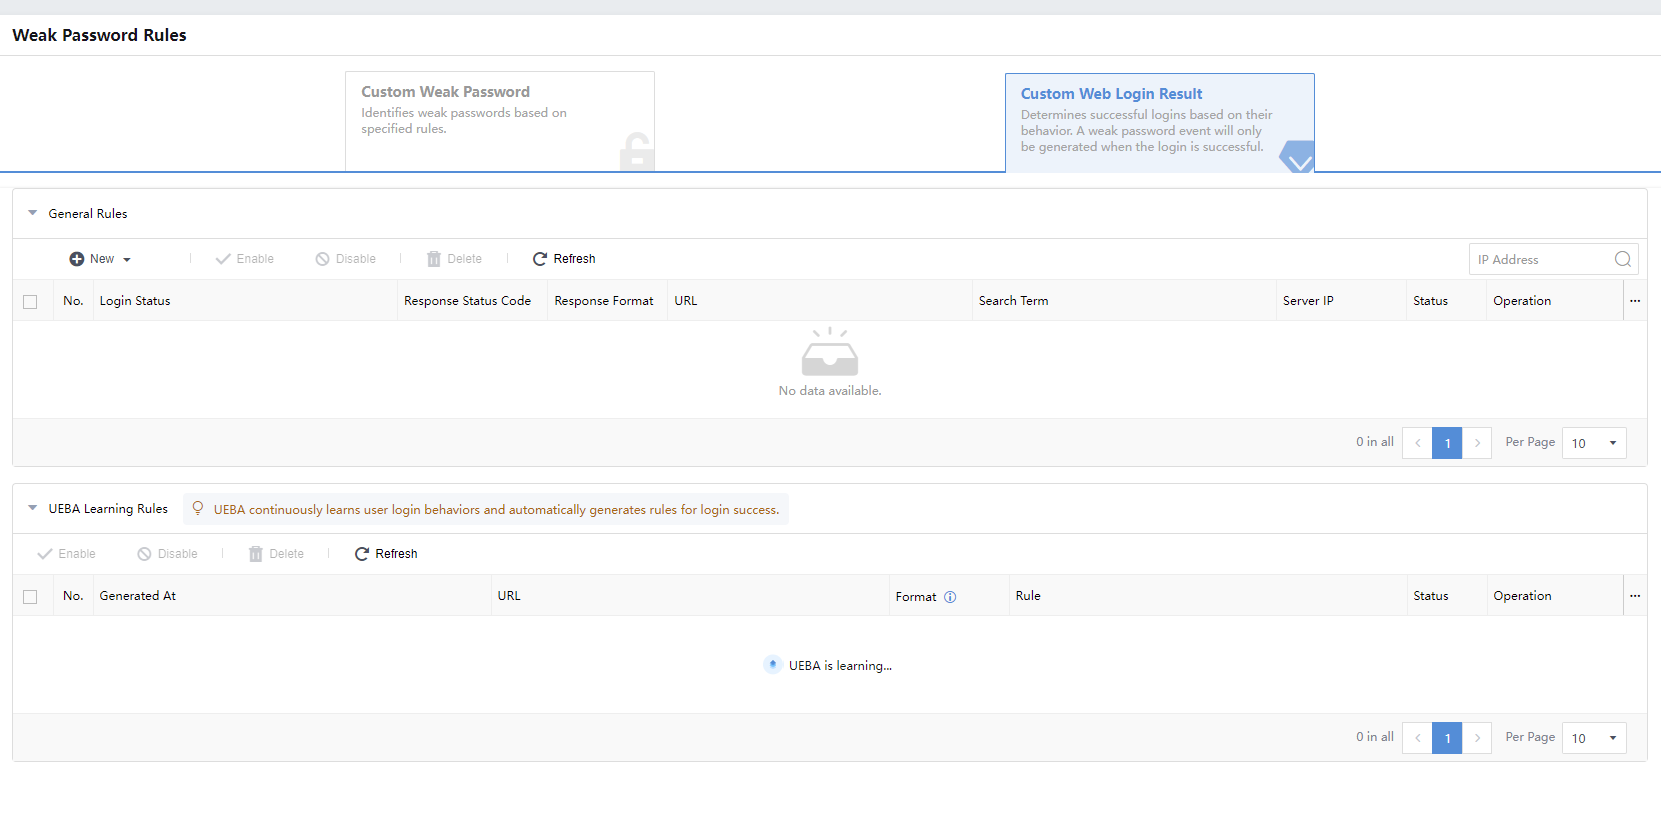
Web login results are categorized into Rule for Login Success and Rule for Login Failure. The web login success and login failure information that Cyber Command identifies in the customer’s actual network is different from the real situation of the business.
Therefore, manual corrections are carried out based on HTTP. The protocol’s two types of Response Status Codes are carried out by matching the content of the successful login, the server IP address, etc., as shown in the figure below.
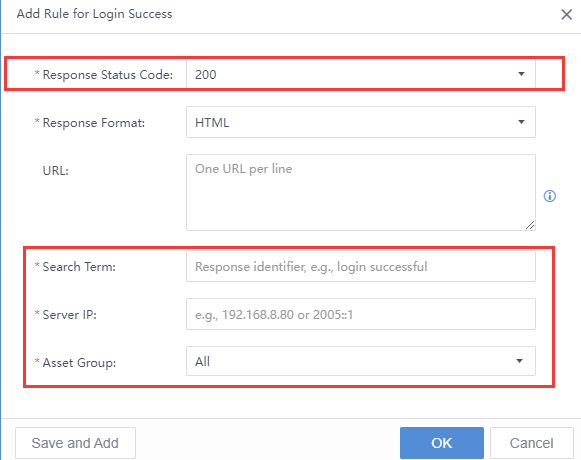
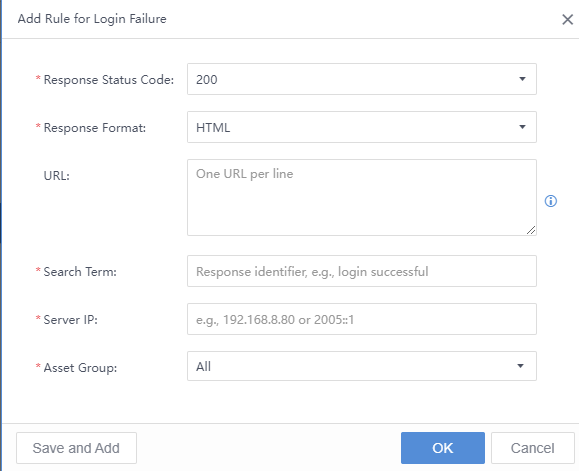
Attachments
Attachment I
The deployment description in the special scenario includes the DNS, AD, and DHCP environments.
DNS Environment
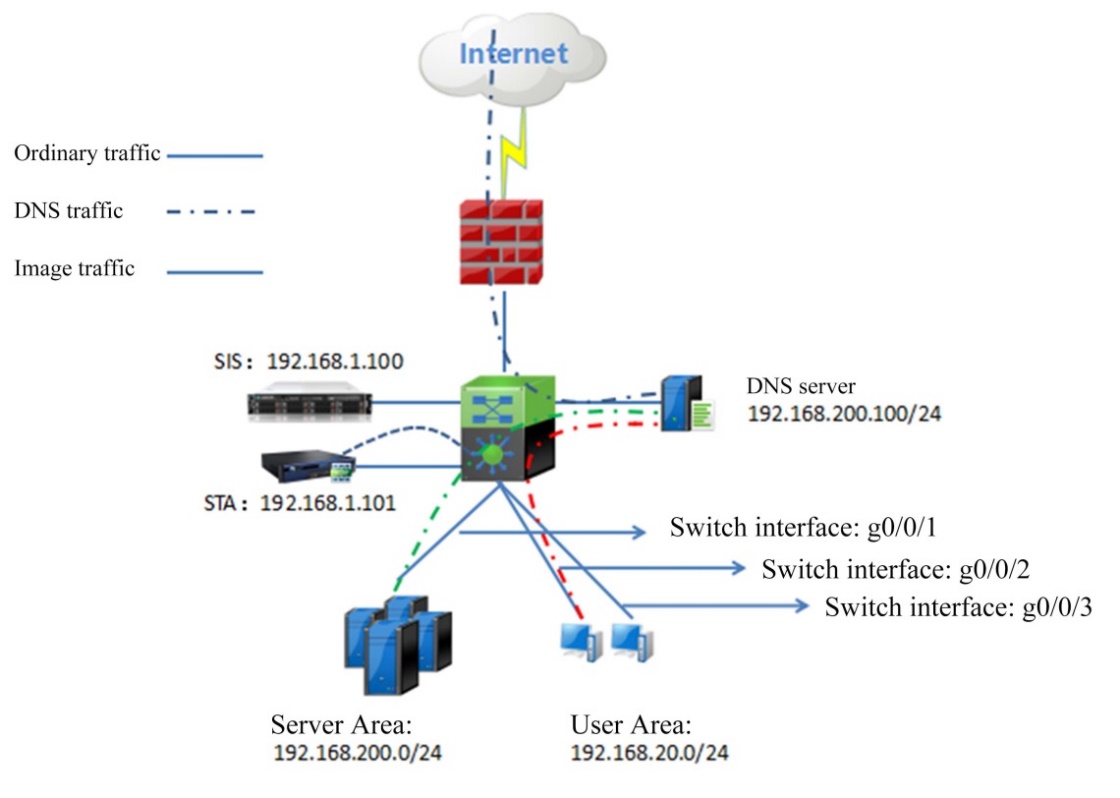
Notes:When the STA receives image data that is the proxy of the LAN DNS, it identifies the DNS as a risky host or business system and, therefore, cannot locate the actual risky service.
Logic: Image the data before the proxy of LAN DNS from the PC (or business system) to LAN DNS. Capture the address of LAN DNS and the data packet of the 53 port.
- If the IP address of LAN DNS is both the source and the destination, add the DNS to the global whitelist.
- If the IP address of LAN DNS is only the source, it indicates that the imaged data only includes proxy data, and the data shall be imaged again.
- If the IP address of LAN DNS is only the destination, it indicates that the data is imaged correctly.
- Then add the DNS to the whitelist. (Also, add the IP address of the scanner to the whitelist.)
Configuration Steps:
Method I:Add the IP address of DNS into theAudit Whitelist. (Recommended)
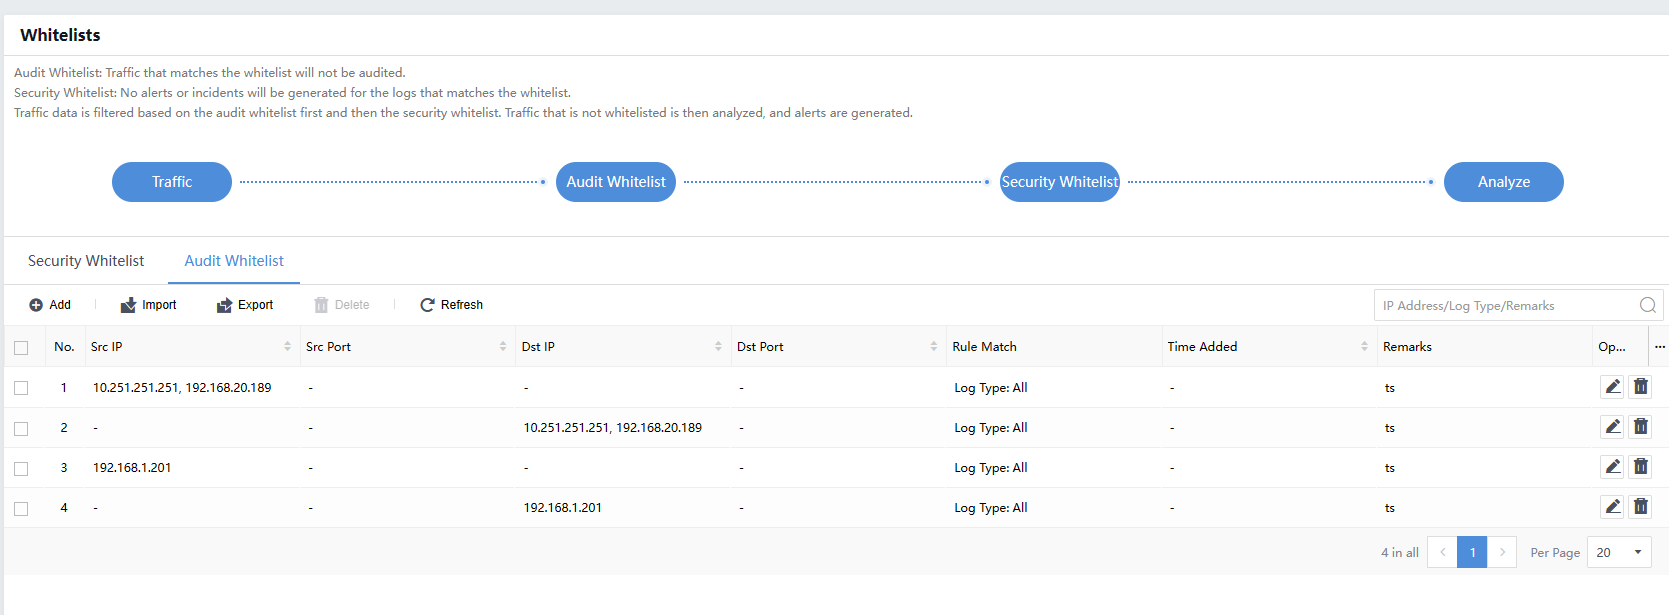
Method II:Add the IP address of the Audit Whitelist.

HCI Environment
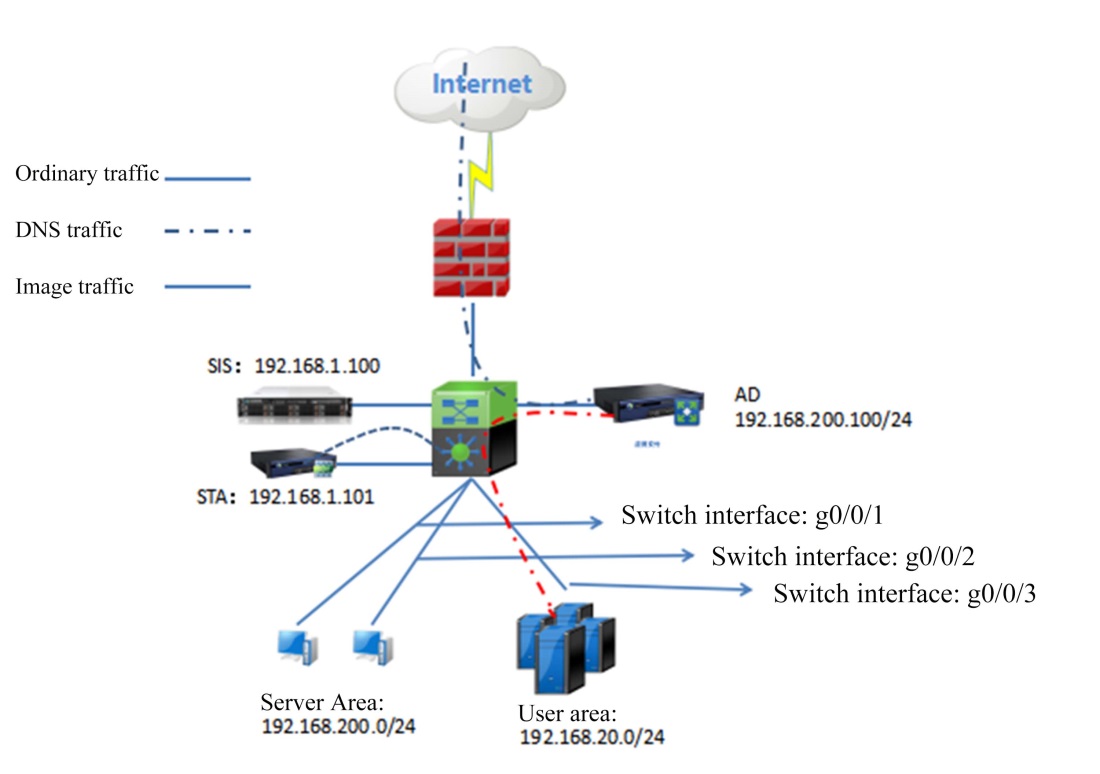
Deployment of AD in a single-arm mode transfers the IP addresses of the public network to those of AD.
Logic:
- It is recommended that the STA’s image traffic be the traffic between the server and AD, through which risky servers can be recognized. However, the risky hosts cannot be located when the STA is deployed between the AD and the Internet.
- It is recommended to enable the XFF field to detect launched attacks and recognize a source IP address of WAF attacks on the STA using the XFF.
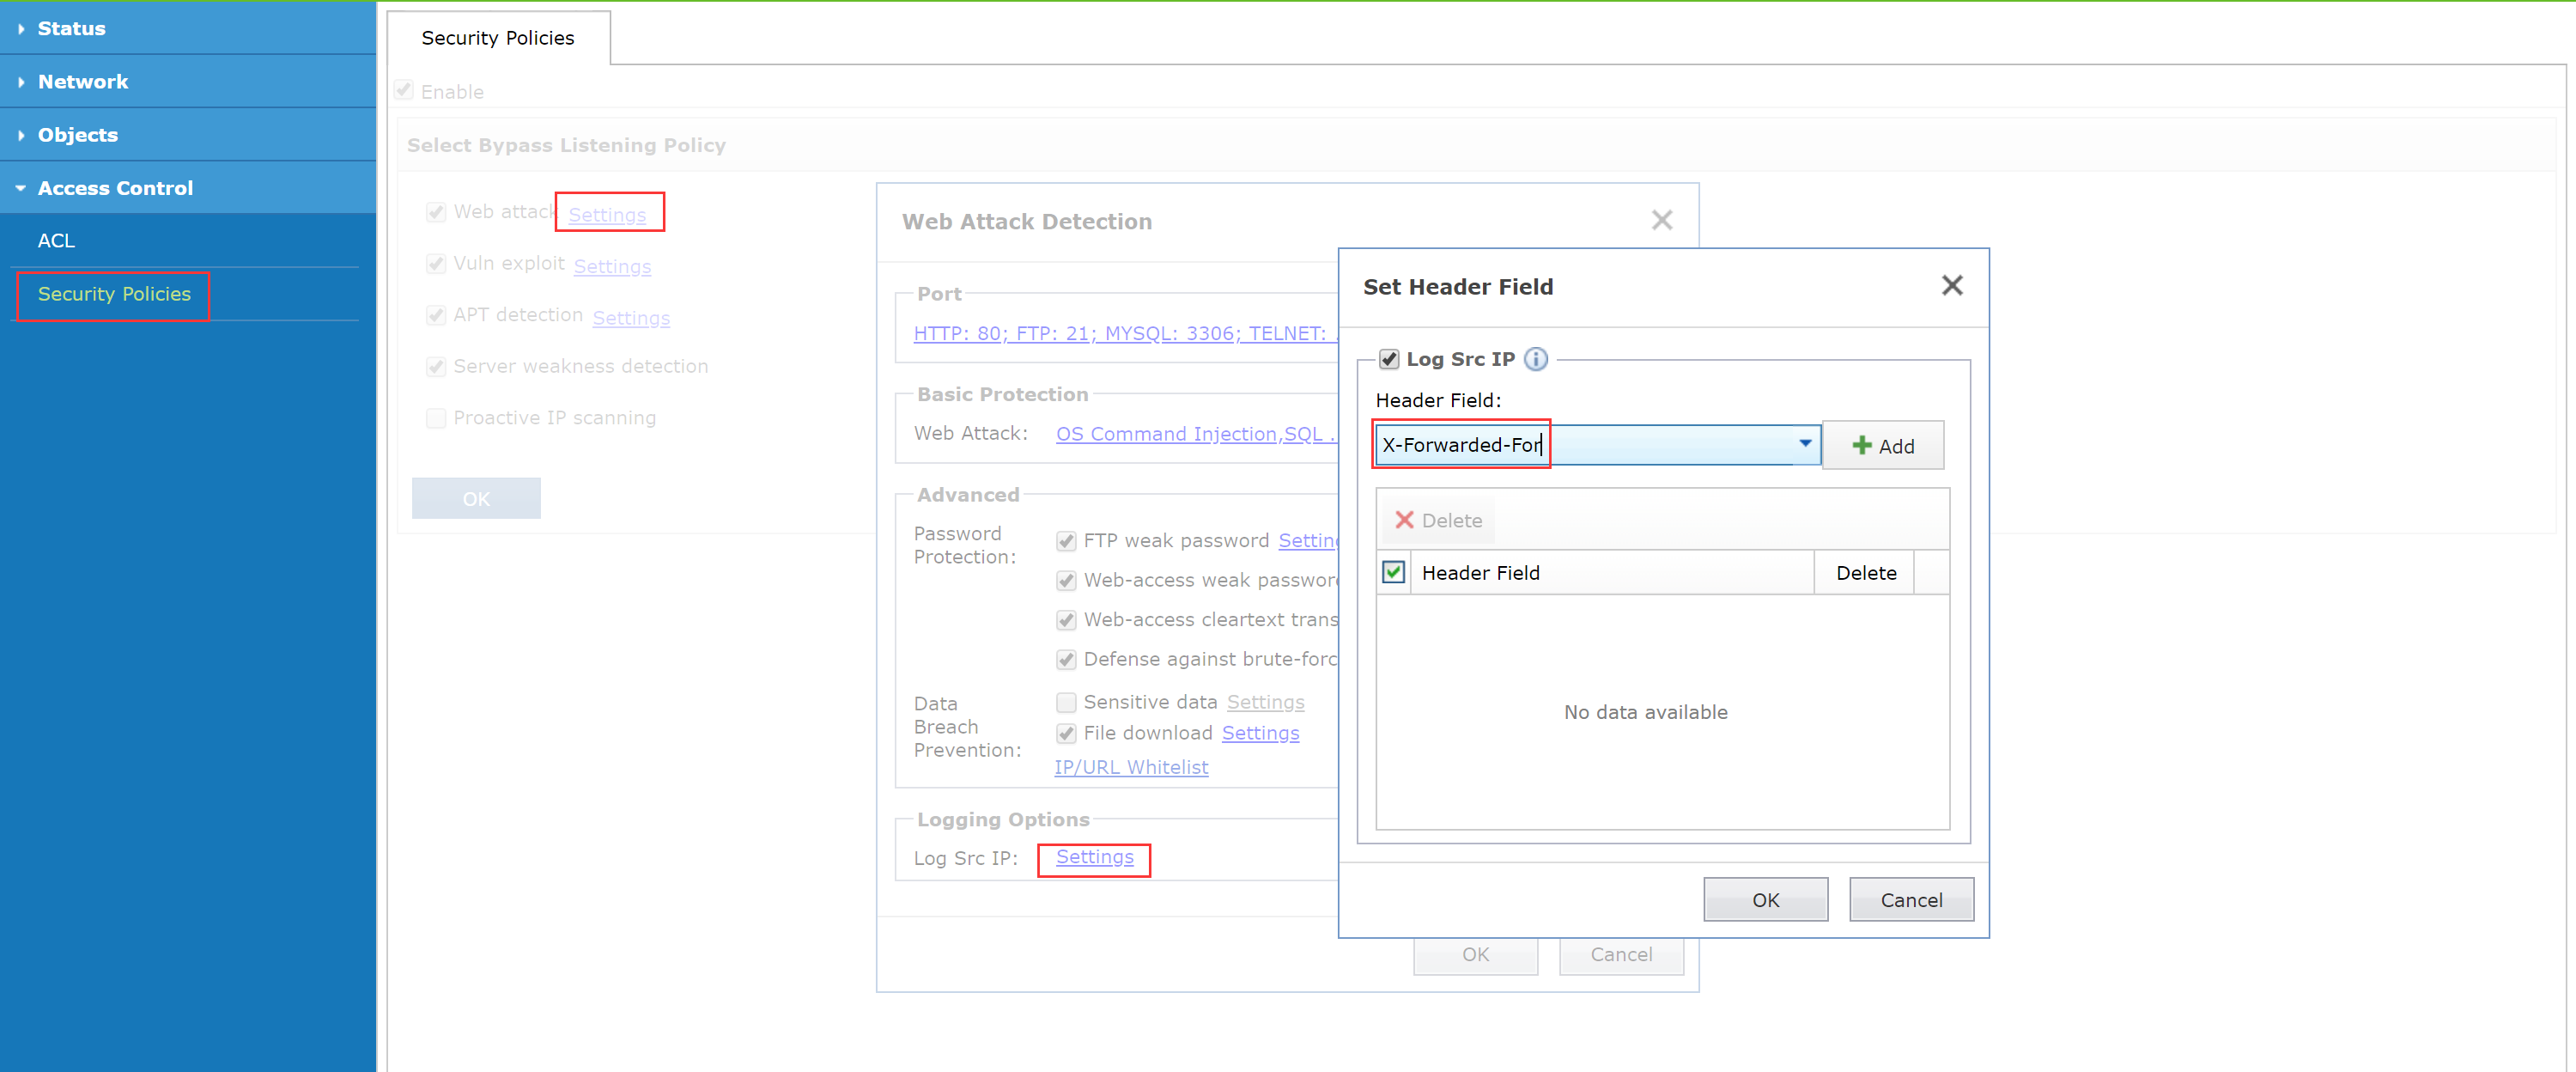
DHCP Environment
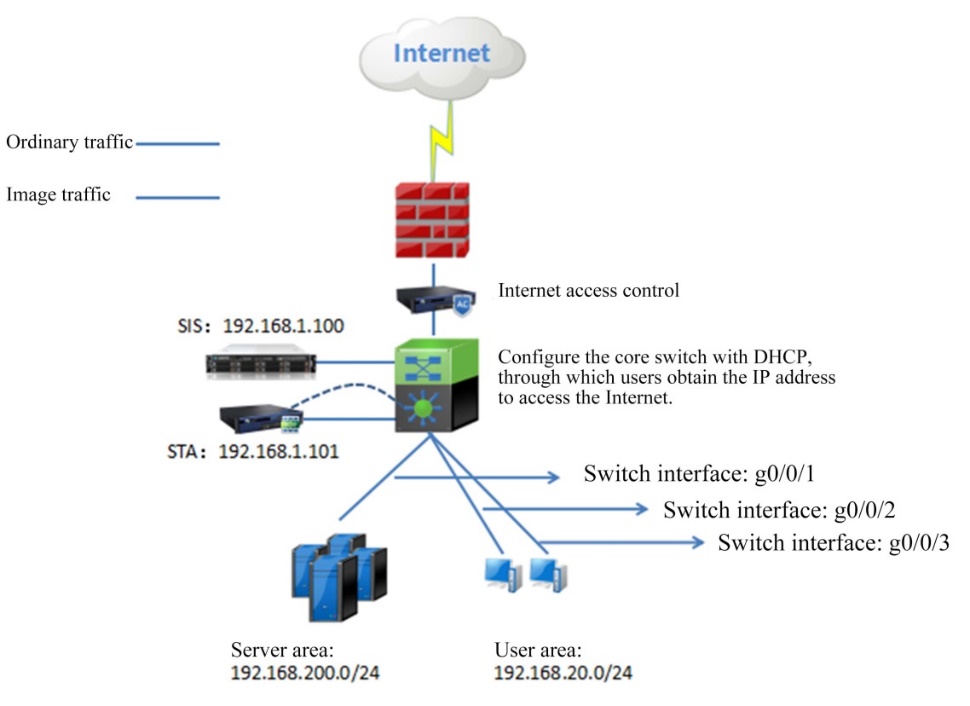
As shown above, if a security issue occurs on the endpoint user’s part, the specific endpoint with the security issue cannot be located due to DHCP’s dynamic provisioning of IP addresses.
Solution:
If the DHCP lease time is set as one week, it indicates that the lease time is prolonged, i.e., the user’s IP address is indirectly bound.
By correlating the Cyber Command with the Internet Access Gateway, the Internet Access Gateway uploads a username to the Cyber Command. The security issue corresponds to the username on the IAG because the risky endpoints can be confirmed without changing the username.
Caution: When the IAG is configured with globally excluded IP addresses, the excluded domain names automatically initiate a DNS request.
The excluded IP addresses automatically initiate a request to search for the domain names. It is related to the validity of the mechanism with which IAG automatically detects the globally excluded IP addresses. As this may result in the C&C communication behavior of IAG being identified by Cyber Command, it is necessary to add IAG’s IP addresses to Cyber Command’s global whitelist.
The configuration is as below:
IAG should be updated to version 11.X, or above. Or add a corresponding patch using version IAG 12.0.5 or IAG 12.0.6 to release the correlation policy.
IAG Configuration:
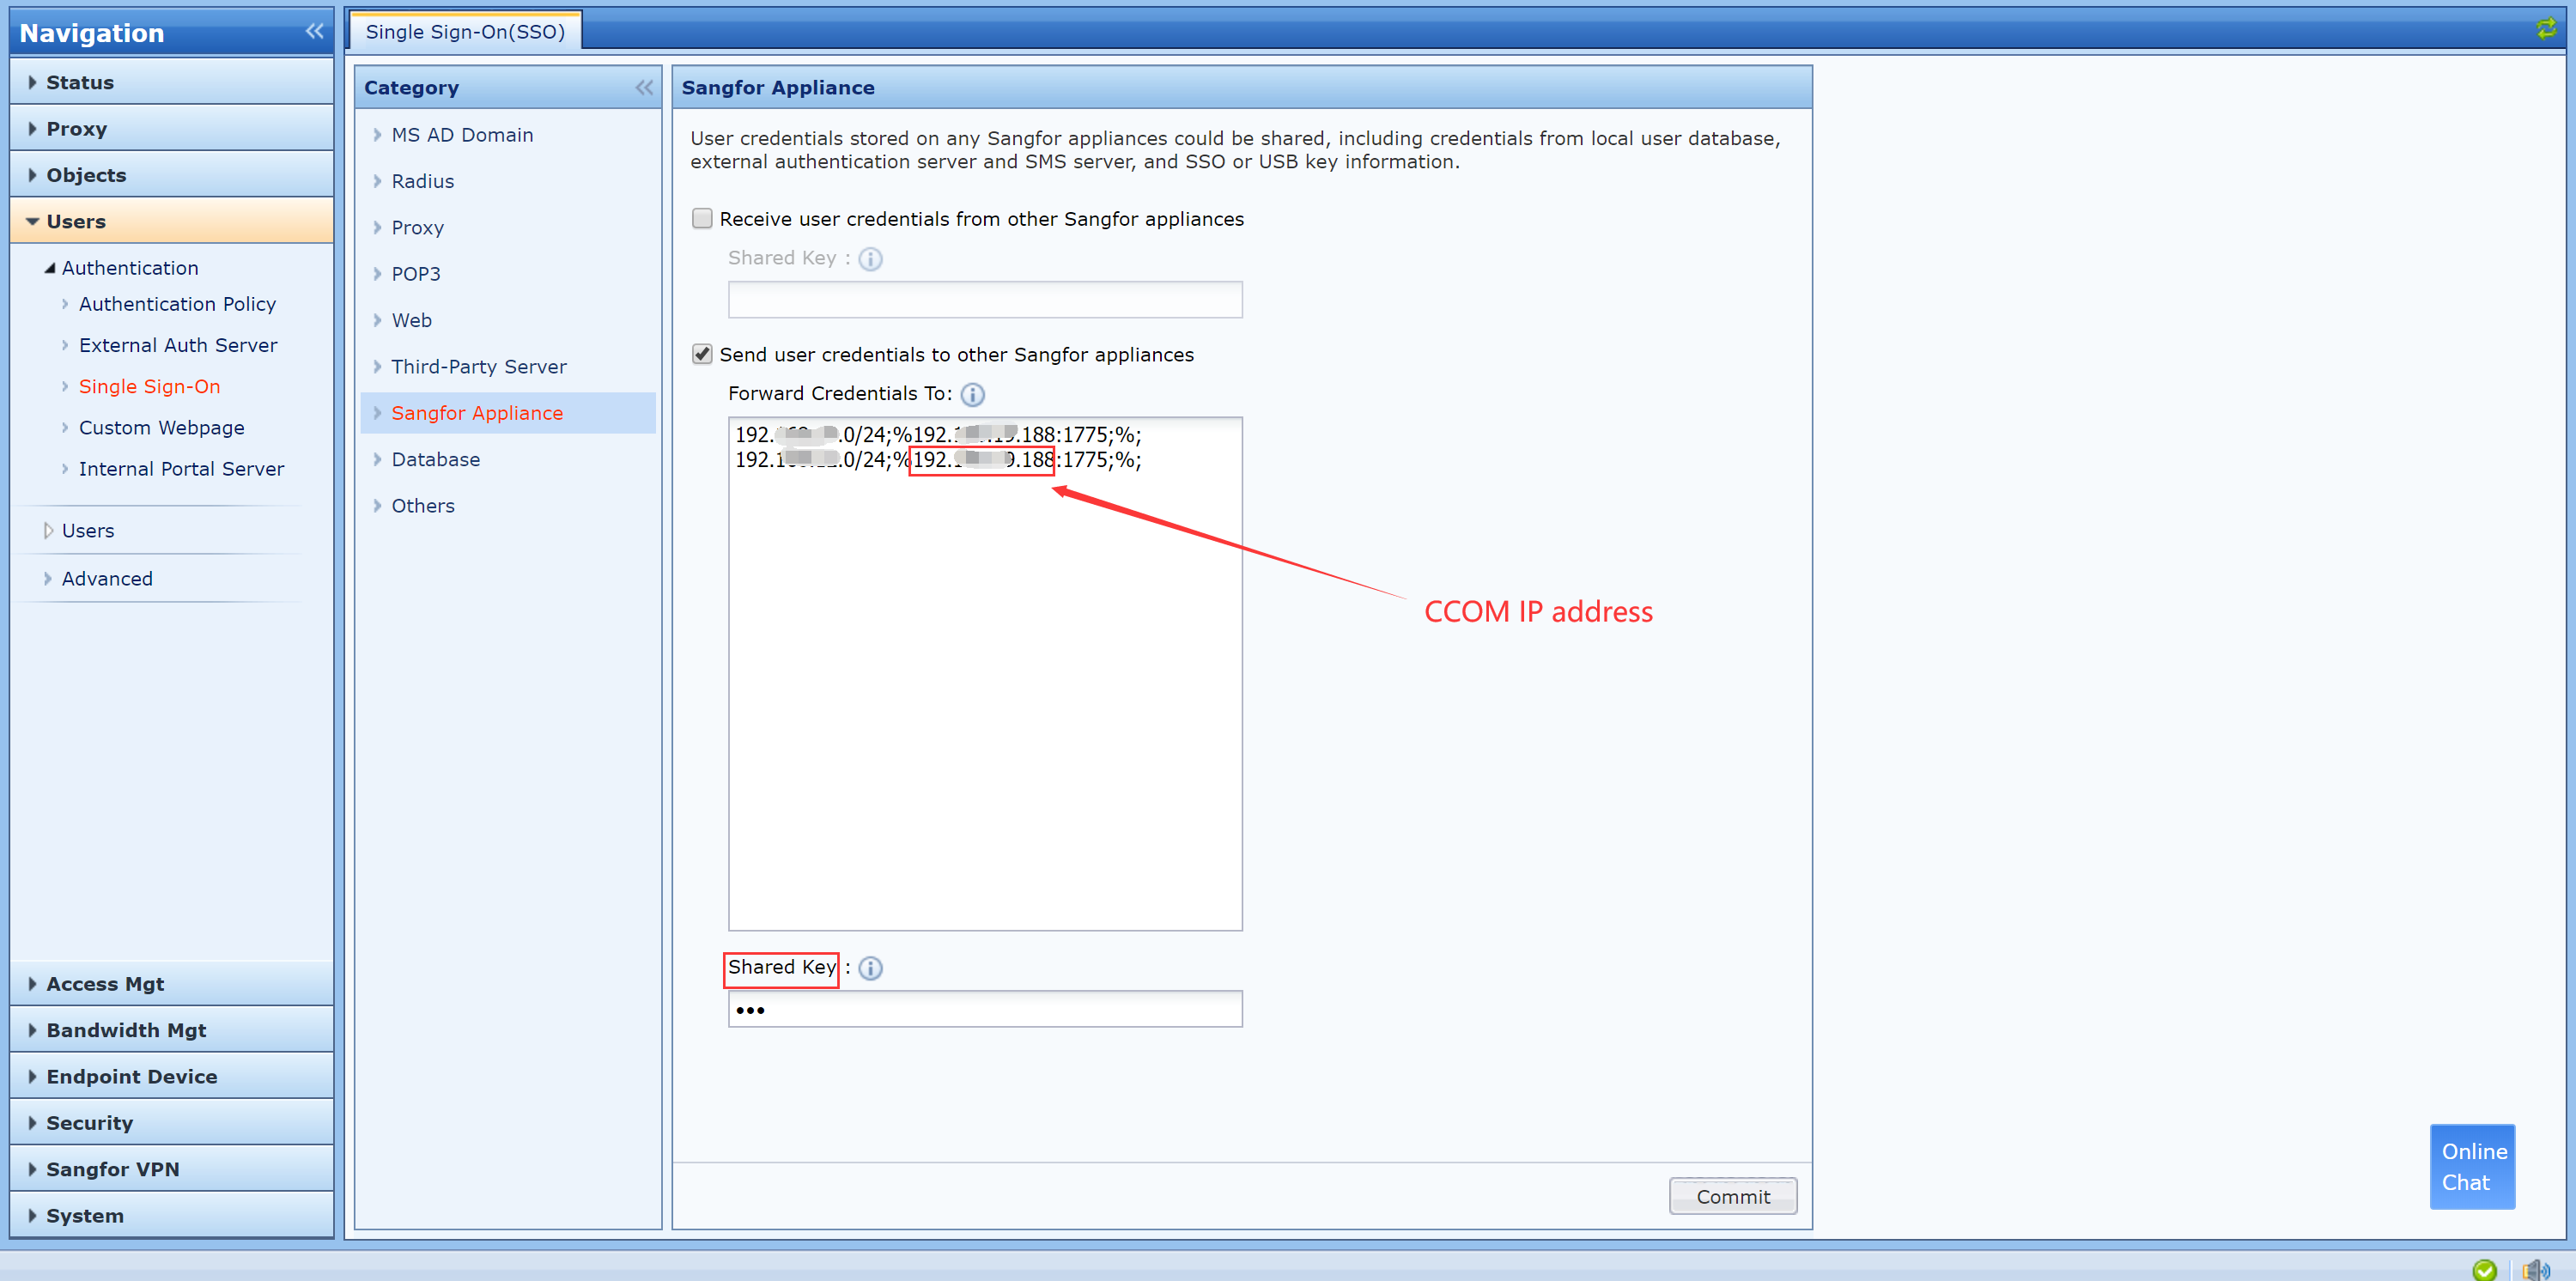
Cyber Command configuration:
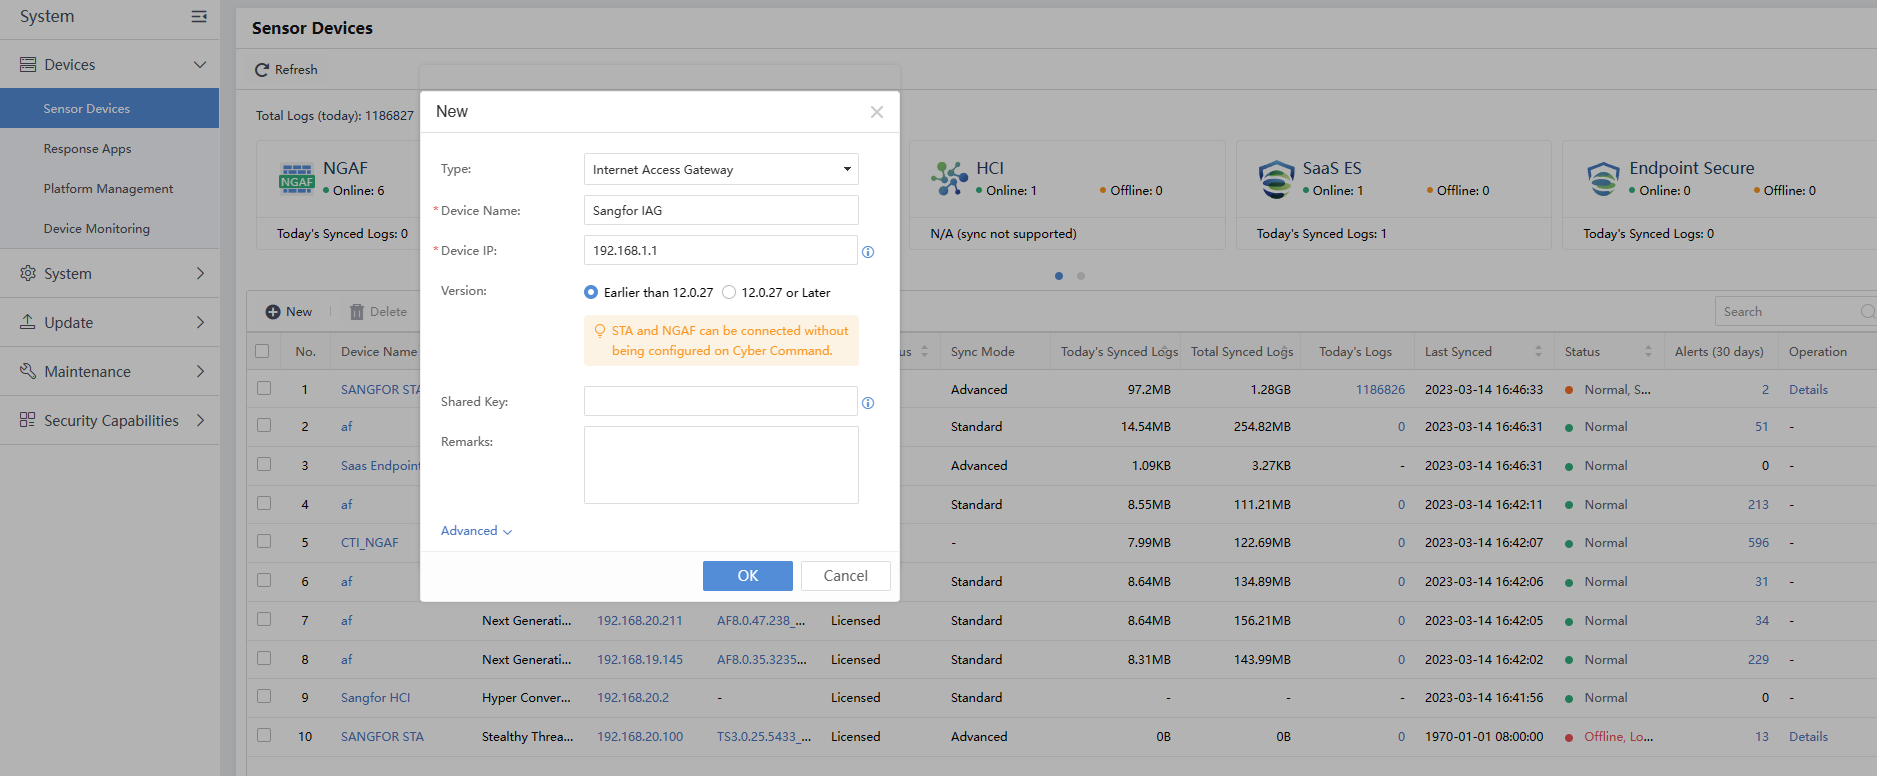
Online Conditions:When logging in, the IAG user shall adopt password authentication because single sign-on information will not be sent to the Cyber Command when password authentication is not performed.
Online Effect:The device is online when IAG appears on the interface. However, the IAG does not upload the behavior logs, so all items are displayed as (-).