【HCI】Oracle Database Performance Issue Troubleshooting Guide_V6.8.0
Check HCI System Status
Scenario: Database Slowness
- The customer migrates the database server from the physical server to Sangfor HCI. However, database applications are slow compared with the previous platform.
- Production application is slow after being used for a certain time.
- Performance benchmark POC in between physical server and Sangfor HCI.
Proposed Solution
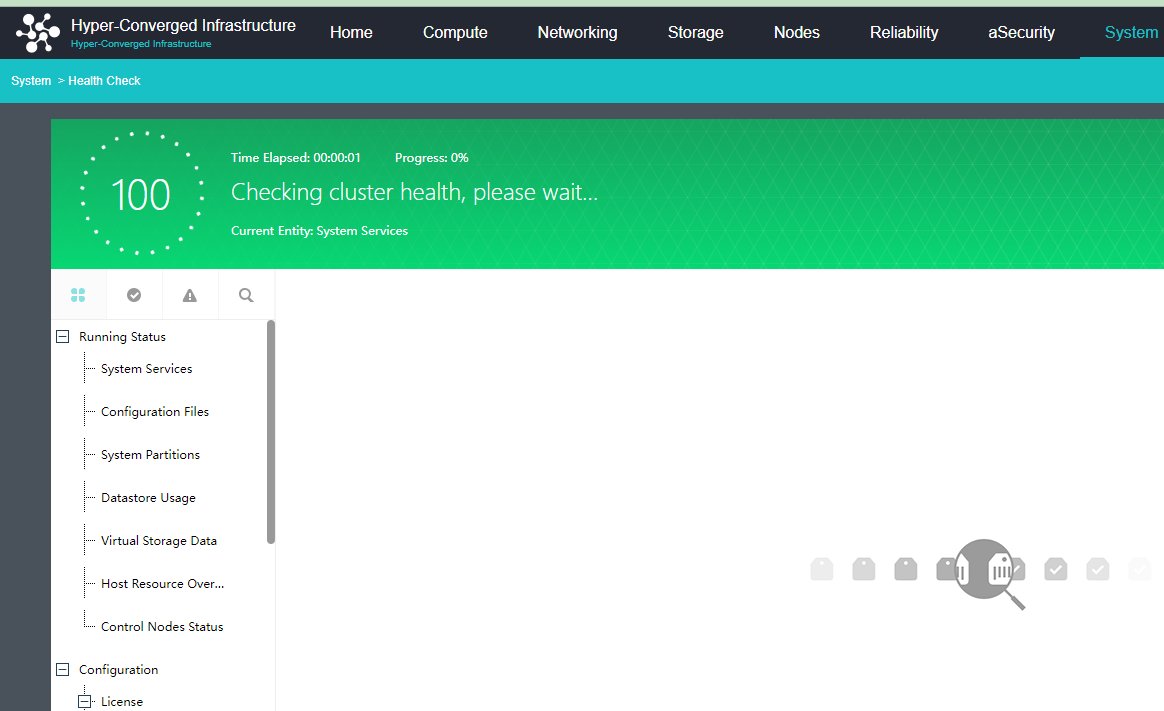
- Perform one-click checking on the Sangfor HCI, and check on the alert/warning logs.
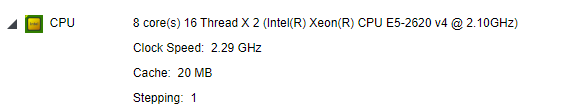
- Check whether the CPU Clock Speed is under 2.0 GHz.
-
Check whether the network negotiation speed is identical. It does not support a 100M network card and does not recommend multiplexing manage interface and vxlan.
-
Installing HCI 6.3.0R3 or 6.7.0R2 for better stability and performance is recommended.
-
Deploying 10G network interfaces for the aSAN network is recommended. It might have an I/O bottleneck issue if deployed with a 1G network interface.
-
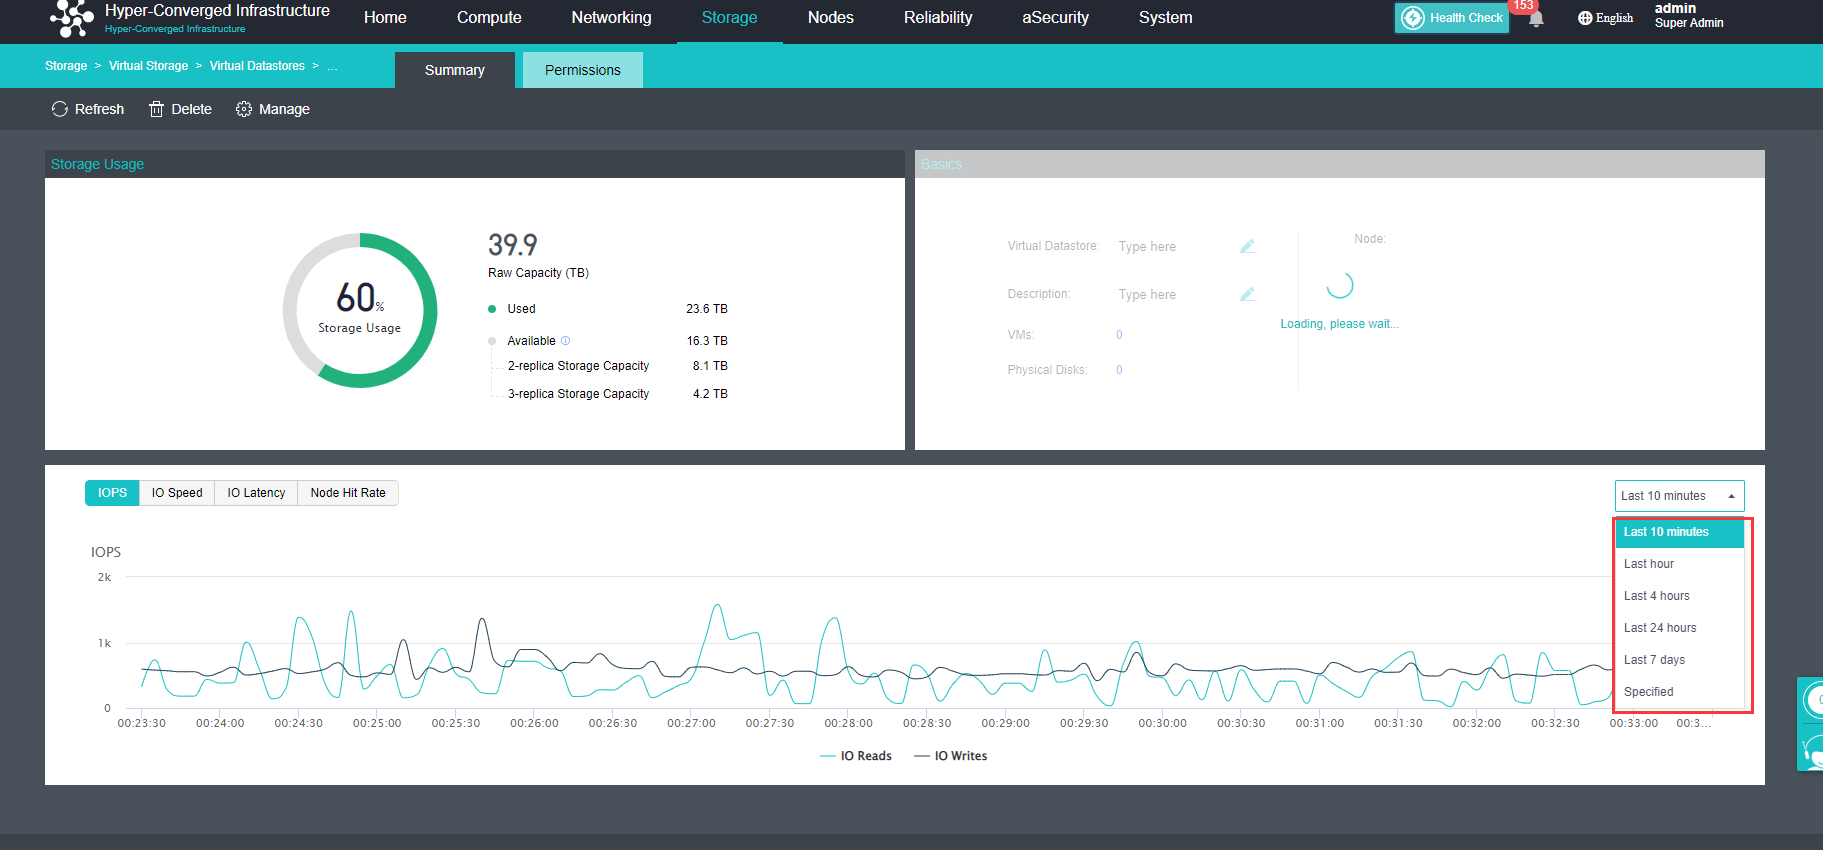
Record down the slowness time of the database server, and check on the VS IO latency and the IOPS.
Check Database Server VM Configuration
Scenario
The customer does not follow best practice when deploying a database server VM, which indirectly increase the time to query production data.
Proposed Solution
-
Check whether the database server VM configuration follows the best practice guideline.
a) Ensure vCPU configuration does not exceed the core number of physical cores and threads.
b) Enable the huge page memory.
c) Enable pre-allocation for the database server hard disk.
d) Mark as high priority VM.
e) Enable fast IO/VirtIO disk.
f) If the datastore is virtual storage, change the storage policy with High Level of Performance QoS.
g) Disabled Memory reclaiming features.
h) It is not recommended to take a snapshot at the database VM. It will affect the performance once the snapshot increase.
-
Virtual machine or virtual storage has high IO latency.
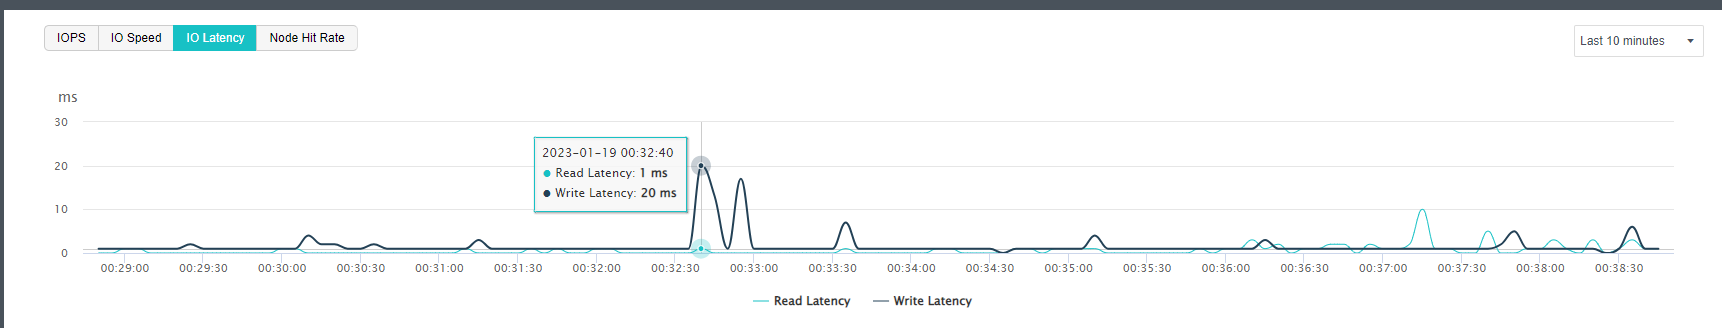
a) Check on the virtual machine IO latency (under HCI VM summary).
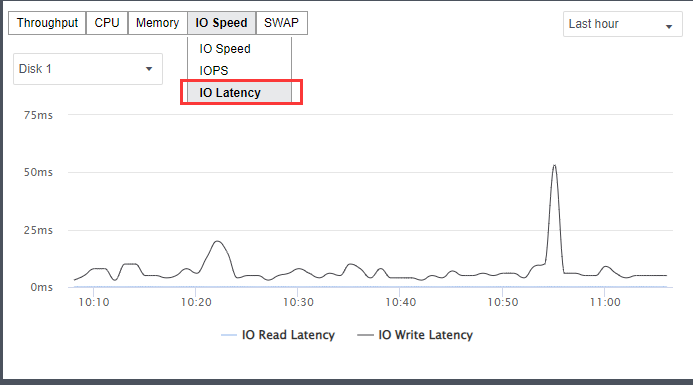
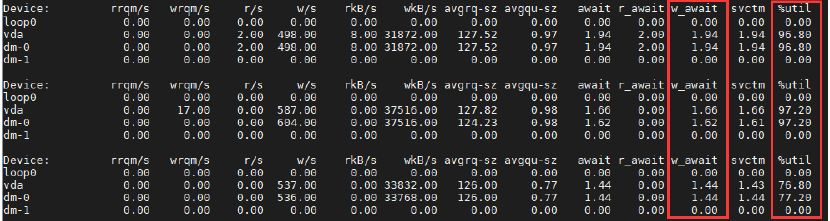
b) Check on the IO wait and utilization under guest OS, as shown below
i. In the Linux machine, execute the command iostat:iostat –x –d 1 100. The last column shows the disk’s utilization rate.
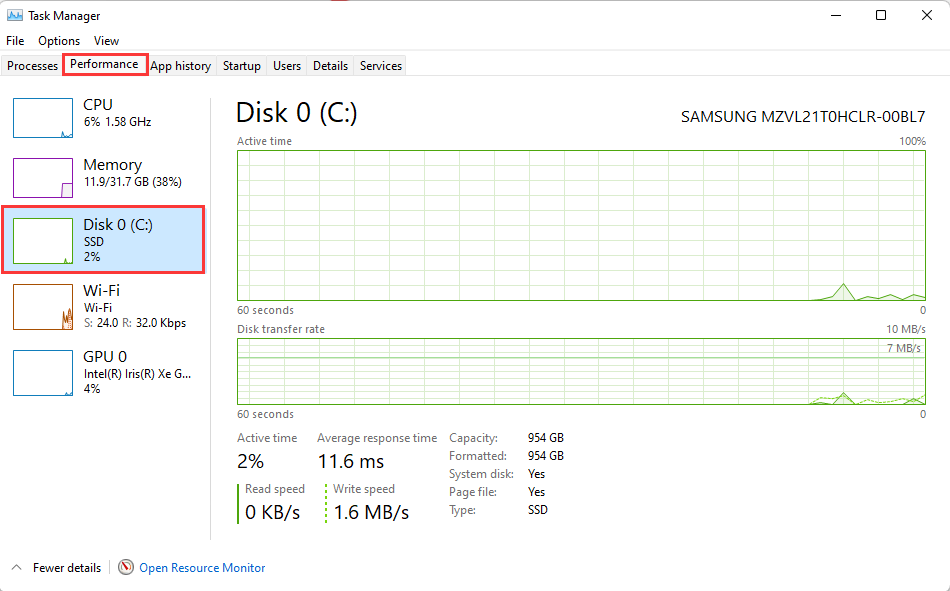
ii. In the Windows machine, open task manager and switch to the Performance tab. Open resource monitor to check on the disk’s IO details.
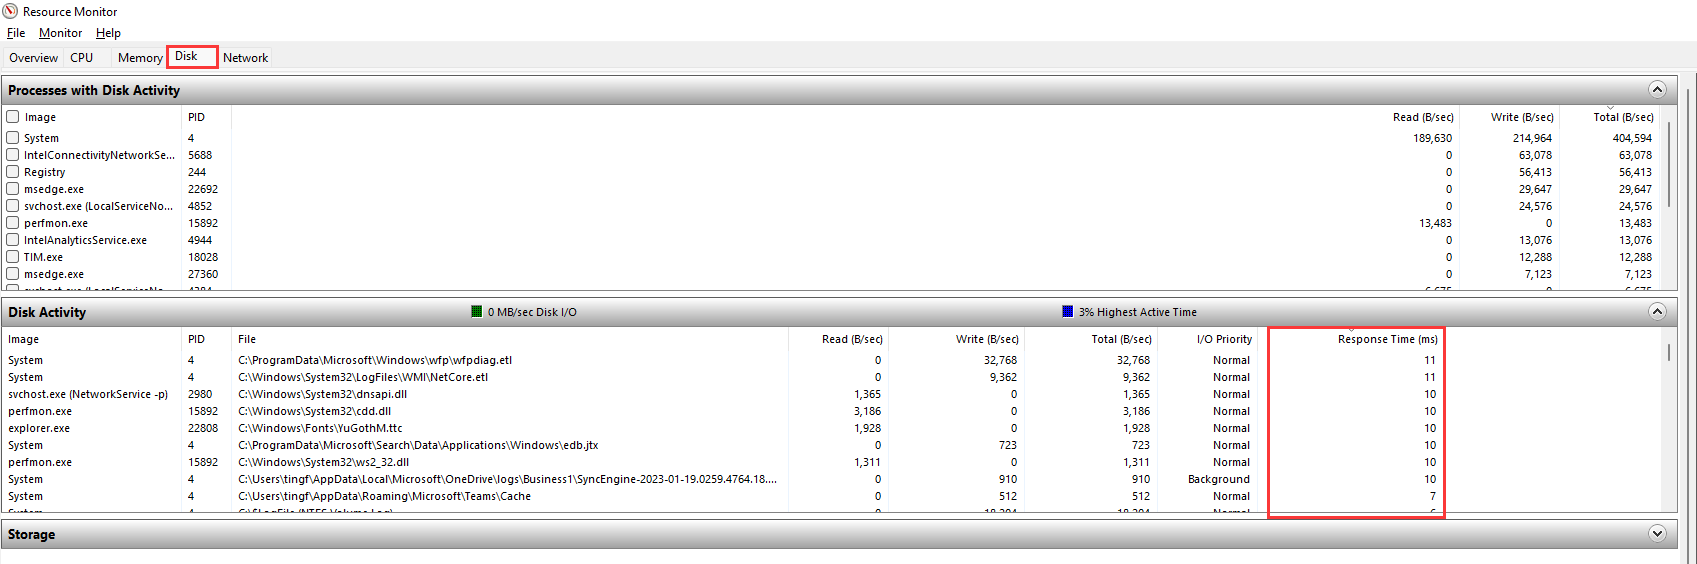
iii. From the Task Manager, click the Open Resource Monitor. Next, switch to the Disk tab, and check the disk activity. It will show the process read/write status and the response time.
c) Check the virtual storage IO latency under storage summary (It is considered normal if the latency is lower than 50ms).
Optimize the SQL Tables
Customer applications have a slow response caused by the SQL performance issue. Get relevant descriptions from customers and compare the execution time between the physical server and the HCI. The SQL statement might need to be optimized if the difference is large. The key to SQL optimization is to focus on HWM reduction.
Proposed Solution
What is the High Watermark (HWM) in Oracle?
The high water mark (HWM) for an Oracle table is a construct that shows the table at its greatest size. Just as a lake has a high watermark after a draught, an Oracle table has a high watermark that shows the greatest size of the table, the point at which it consumed the most extent.
Check Related Tables with a High watermark
Modify the following code with the table name and the table owner:
SELECT table_name,
ROUND ( (blocks * 8 / 1024), 2) "High water mark spacing MB",
ROUND ( (num_rows * avg_row_len / 1024 / 1024), 2) "Used spacing MB",
ROUND ( (blocks 10 / 100 / 1024) 8, 2) "Reserved spacing (pctfree) MB",
ROUND ( ( blocks 8 (num_rows avg_row_len / 1024 /1024 ) blocks 8 10 / 100 /1024), 2) "Wasted spacing MB"
FROM user_tables
WHERE table_name = ”
AND owner=”
ORDER BY 5 DESC;
Reclaim the Space if it has the High Watermark
The command is as below:
alter table owner.table_name enable row movement;
alter table owner.table_name shrink space cascade;
alter table owner.table_name disable row movement;
Note:
Row movement: allow row movement.
Shrink space: shrink table data spacing; cascade, shrink index spacing at the same time.
Finally, close the row movement.
Collect Update Information Statistics on Specific User or Table
Update Statistics on Specific Table
exec DBMS_STATS.GATHER_TABLE_STATS(ownname=>’owner’,tabname=>’table_name’,ESTIMATE_PERCENT=>10,method_opt=>’for all columns size 1′,cascade=>true,force=>true,degree=>8);
Update statistics on specific user (Optional)
exec DBMS_STATS.GATHER_SCHEMA_STATS(ownname=>’owner’,ESTIMATE_PERCENT=>10,method_opt=>’for all columns size 1′,cascade=>true,force=>true,degree=>8);
Note:
After SQL optimization, execute the same SQL query again to verify whether the time to finish the task becomes shorter.
Obtain and Analyze AWR Report
The Automatic Workload Repository report or AWR report (as it is more commonly known) has been introduced in Oracle 10g and evolved from the Statspack functionality of Oracle 8i/9iis. It is a vital tool for collecting historical performance statistics of an Oracle Database by DBAs and System Performance engineers.
Proposed Solution
-
Obtain the AWR report during the slowness issue or peak production periods.
-
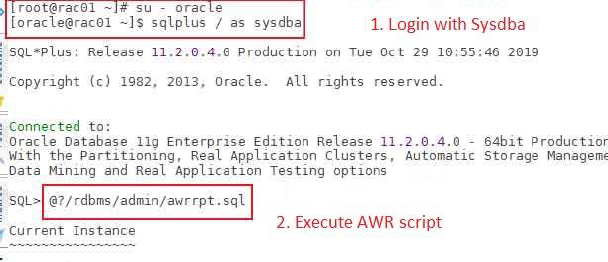
Log in to the database server with account sysdba and execute the following command: @?/rdbms/admin/awrrpt.sql
-
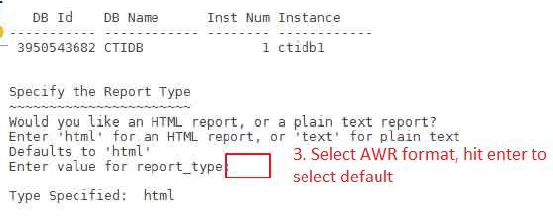
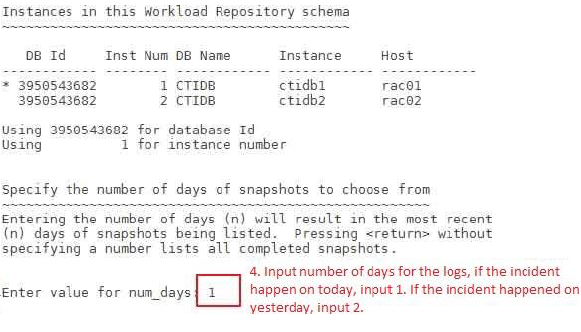
Customize the input as follows:
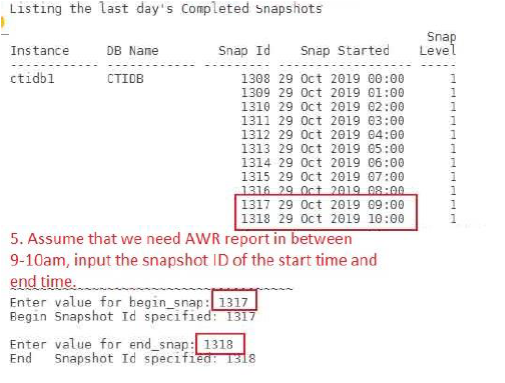
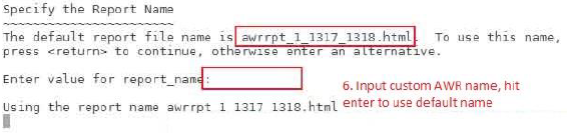
Find the AWR report in the current root directory: awrrpt_1_1317_1318.html
Transfer to the local PC for further analysis.
Analyze AWR Report
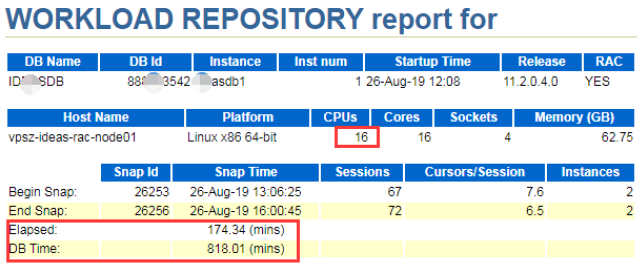
Check Database System Utilization
The following diagram shows the AWR report of 3 hours. DB time/Elapsed * CPUs is the database workload.
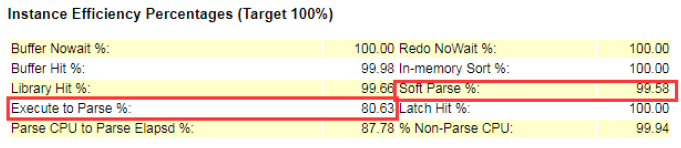
Check the Instance Hit Rate
The best hit rate status is around 100% or 99%~100%. The performance considers poor if the hit rate is lower than 99%.
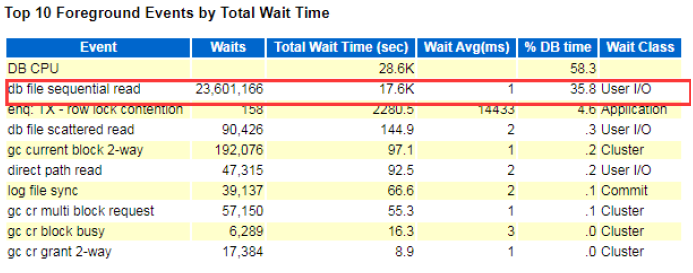
Check Top 10 Queue Events
It is normal if the DB CPU has the top utilization, while it is considered abnormal if it is not at the maximum utilization.
From the screenshot below, the instance shows db file sequential read files have continuously utilized extensive waiting time, consider it as abnormal events.
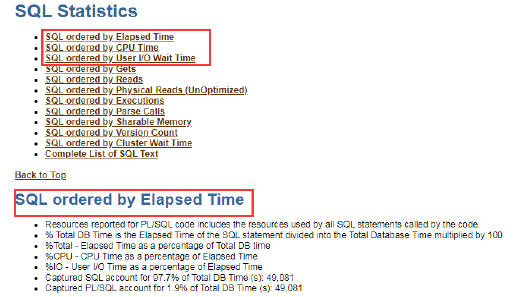
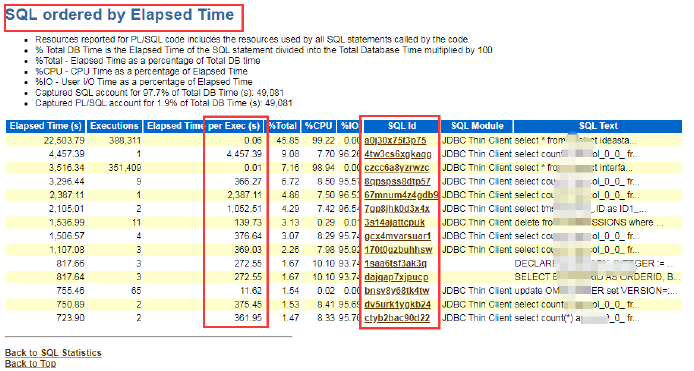
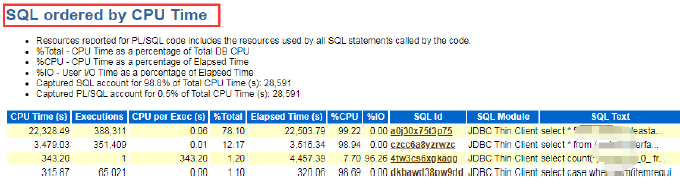
Check the Query Time of the SQL Command
- Basically, the SQL execution time can be filtered by SQL ordered by Elapsed Time, SQL ordered by CPU Time, and SQL ordered by User I/O Wait Time.
- Check the execution time when querying the SQL, filter on the top CPU usage, and I/O time wait.
- Click on the UI sql_id to check on the specific SQL query content.
- If unable to analyze, record the relevant sql_id and escalate to the database specialist.
Escalation to the Database Specialist
If the above solution does not solve the issue, kindly collect the following information before escalating to the specialist.
- Guest OS type and version.
- Database version.
- Slow SQL statement.
- SQL_ID.
- AWR report during the incident.
- SQL execution time.
- See whether it affects the production.
- Incident description.