[IAG] Data center traffic statistics daily, weekly, monthly query shows inconsistent traffic in the same time period
Problem Description
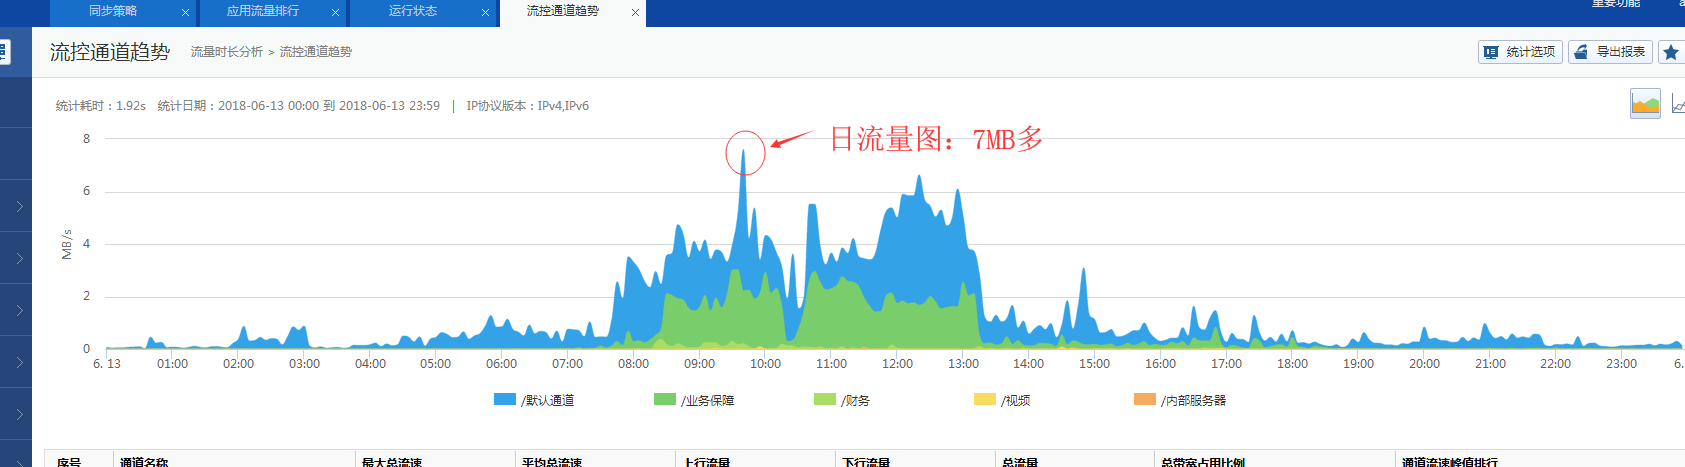
When a customer was collecting statistics on the company's network flow control channel trend chart, he reported that when he queried the flow control channel trend chart for a certain period of time in the data center, he found that the peak values of the flow trend chart for that day were very different between the daily query and the weekly query.
Warning Information
143555b4f4768a804a.png (98.49 KB)

832405b4f47c19ddd7.png (88.56 KB)
solution
It is normal for the traffic graphs to show different traffic. The data center traffic trend graph shows the traffic in the same time period in the monthly, weekly and daily traffic. The traffic time points taken by different time statistics graphs are different. The traffic average of a certain time period is taken. The traffic in the same time period between the three cannot be compared.
Suggestions and Conclusion
Select the flow control channel trend chart of different time periods. The value points of the graph are different. It is recommended that if you want to view the network traffic in a certain time period, try to select a shorter time point so that the displayed traffic can show the real traffic value as much as possible.
Original Link
https://support.sangfor.com.cn/cases/list?product_id=22&type=1&category_id=6064&isOpen=true