【VDI】IOM User Manual_v2.0
IOM Solution
Introduction
IOM stands for Intelligent operation and maintenance (IOM), and we have designed, developed, and upgraded Sangfor aDesk Virtual Desktop Infrastructure(VDI) Intelligent Operations and Maintenance based on this core concept.
Sangfor aDesk VDI Intelligent Operations and Maintenance, a granular monitoring and analysis plus intelligent diagnosis app operations and maintenance platform, provides industry-leading VDI monitoring and analysis plus intelligent diagnosis solutions, which can detect and find more than 70% of desktop cloud performance bottlenecks.
The system combines machine learning algorithms and artificial intelligence technology to encompass operation and maintenance solutions for applications, networks, storage, virtual machines, physical machine clusters, and other systems to achieve rapid troubleshooting of VDI performance problems, including but not limited to virtual machine lagging, physical resource bottlenecks, application anomalies, network interruptions, etc., and intelligently analyzes desktop cloud usage-related problems 7*24 to provide a full range of optimized solution.
Applicable Scenarios
Passive troubleshooting scenario: After the user’s feedback on the latency issue, the customer’s IT administrator and technical engineer use IOM to do preliminary troubleshooting on the customer’s latency issue.
Active inspection scenario: Customer IT administrators and technical engineers regularly use the IOM platform to inspect the VDI platform to see any latency issues, and when latency issues are found, they can deal with the issue promptly without having to wait until the user complains.
Technical support troubleshooting scenario: After the user feedback on the latency issue, the customer’s IT administrator and technical service engineers use IOM’s intelligent analysis to do preliminary troubleshooting on the customer’s latency issue, but still can’t solve it, so they need assistant from R&D experts for troubleshooting.
IOM Deployment Guide
Pre-deployment Preparation
Preparation
IOM needs to be built on a Linux server. The details are as follows.
| Name | Role | Note |
|---|---|---|
| HCI platform | Starting from version 5.9.1, VDC supports integrating with the IOM platform, while virtual machines running on HCI can automatically integrate with the IOM platform. | HCI version must be 5.9.1 and above (IOM 2.0 and above) |
| Platos-xs Virtual Machines | It is the virtual machine that carries the IOM platform and installs the IOM in Platos-xs, which serves as the management platform for the IOM. Currently, only Platos-xs is supported. We are not responsible for any stability problems if you install it on other Linux distributions. | |
| Platos is a Sangfor-developed underlying operating system that currently does not provide external mirrors. If you need to deploy it, please download the VMA image through the community platform. | Download the corresponding template through the Sangfor Community: | |
| download link | ||
| IOM installer | IOM has been pre-deployed in the Platos-xs system | |
| Pagent | Pagent is an information collector that must be installed within the user’s virtual machine and the HCI system to monitor the virtual machine. | HCI already comes with Pagent. No need to install it. |
Network Preparation
Network Connectivity Requirements
The IOM server (i.e., Platos-xs VM) needs to be connected with the following components:
VMs monitored by the IOM: The VMs upload the collected data to the IOM platform via Pagent (the IOM listening port 9563).
HCI platform monitored by IOM: HCI uploads the collected data to the IOM platform through Pagent (listening port 9563 on the IOM side).
Administrator’s PC: The administrator uses a PC to access the IOM’s console over the network (the IOM listening port 443).
Pagent upgrades for all monitored objects: VMs and HCI’s Pagent upgrade via the IOM server (IOM side listening port 8023).
Network Bandwidth Requirements
VMs with Pagent installed (i.e., monitored VMs) are to report traffic information to the IOM in real-time, with a real-time traffic rate of 0.0256 Mb/s per VM.
For example, assuming that 50 virtual machines are running on a server, the bandwidth required for the physical network port of this server is 1.28Mb. The bandwidth consumption is relatively small if it is a 1000Mb physical network. For the IOM platform, if 1000 virtual machines are monitored simultaneously, the required service bandwidth of the IOM server is 25.6Mb, which is relatively less bandwidth consumption if it is a 1000Mb physical network port.
IOM Resource requirements
Configuration Requirements
To realize VDI full-stack monitoring across applications, virtual machines, physical machines, and other layers, the IOM platform must always collect data related to virtual machines, HCI, and VDC. Hence, the configuration requirements for the IOM platform are higher. At the same time, the logs and related information data generated will take up more storage space, and the specific requirements are as follows:
| The number of monitored virtual machines | Recommended Configuration for IOM Platform |
|---|---|
| 0-100 | 4 cores 8GB RAM + 150GB disk |
| 100-200 | 4 cores 16GB RAM + 250GB disk |
| 200-500 | 8 cores 24GB RAM + 350GB disk |
| 500-1000 | 12 cores 32GB RAM + 650GB disk |
| 1000-2000 | 24 cores 48GB RAM + 1.5T disk |
| 2000-3000 | 32 cores 64GB RAM + 1.8T Disks |
Note:
- 50G of the disk capacity required for the IOM platform is for the IOM system installation, while the remaining space is for data capacity.
- IOM can retain the last 30 days’ data.
- To maintain a better experience, RAM is recommended to be 16GB and above, and it is recommended to allocate more memory and disk space.
- IOM currently supports access to up to 3000 VMs. However, distributing the workload into multiple IOMs for large-scale VM scenarios is still recommended to ensure stability, data display aesthetics and prevent unforeseen circumstances.
- If deployed with standalone physical servers, it is recommended to use full SSD storage for a better O&M experience.
- The amount of data collected by the IOM daily is as follows (for a single monitored VM)
- 400,000 data entries (180,000 for processes)
- Occupies 25MB of disk space on the IOM server
- Real-time network traffic of 0.0256Mb/s per monitored virtual machine
Impact on Storage Performance
Since the IOM platform needs to collect and write a large amount of data, there is an impact on the performance of the storage resources used for IOM, considering only SSDs (you can ignore the impact on HDDs), as detailed below:
Impact on virtual storage(VS): assessed as a worst-case scenario of additional IOM log writes with no change in original VS IO reads and writes, only affecting VS-SSD cache disks on the single HCI node where the IOM is deployed.
500 VM IO writes 25M * 500 = 12.5G/day, which is around 0.5% impact on SSD lifespan.
1000 VM IO writes 25M*1000=25G/day, which has around a 1% impact on SSD lifespan.
2000 VM IO writes 25M*2000=50G/day, which has around a 2% impact on SSD lifespan.
3000 VM IO writes 25M*3000=75G/day, which has around a 4% impact on SSD lifespan.
Note: HCI running IOM servers will have fewer VMs than other HCI. Therefore, the VMs will have much less write disk IO. The actual impact will be much better than the above assessment (the above impact assessment is based on the worst-case scenario, and it is recommended to relocate the IOM servers to minimize the impact on the HCI’s SSD lifespan).
Impact on local storage: The larger the SSD storage space, the smaller the IOM virtual machine data writing impact is. The lifespan is about five years if the storage space is properly allocated(impact on HDD is not taken into account).
Impact on external storage: You can look at the storage vendor’s parameter description or consult the vendor based on the number of monitored VMs * 25M/day.
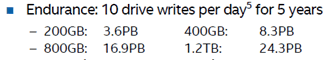
The corresponding lifetime of a 200GB SSD over a five-year lifespan is 3600TB, which averages out to 3600TB/(5*365) = 1972GB per day, which is 200GB on the disk, and 1972GB equal to 10 writes per day.
IOM Deployment
Quick Deployment
- Download the VMA image from the Sangfor Community website (https://community.sangfor.com/plugin.php?id=service:download&action=view&fid=8#/7/all) and import the VMA image directly.
- After importing the IOM 2.0 VMA, locate a VM, make sure the VM’s network port configuration is consistent with the IOM platform, and configure that VM with a Layer 2 IP that is the same as the image’s IP. The image’s default IP is 10.254.254.242/24.
Once the configuration is complete, visit https://10.254.254.242 on the VM’s browser (default username and password are admin).
Click System Settings > Network Configuration, and fill in the official IP address, gateway, etc.
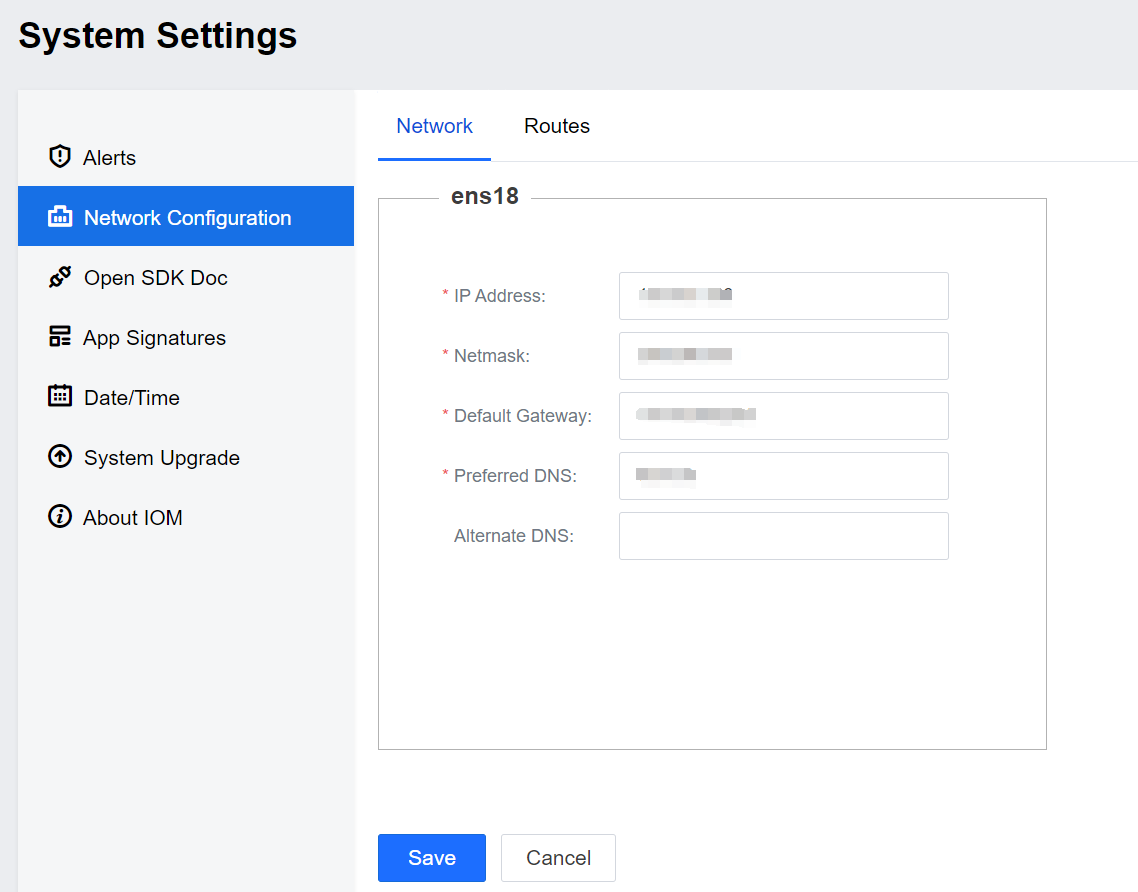
After clicking Save, the environment will restart the NIC, wait 3 to 5 minutes, and access the official IP address.
Change Admin Password
Visit the IOM platform address (https://IP) through your browser and log in (default username and password are admin).
- Change your password after a successful login.
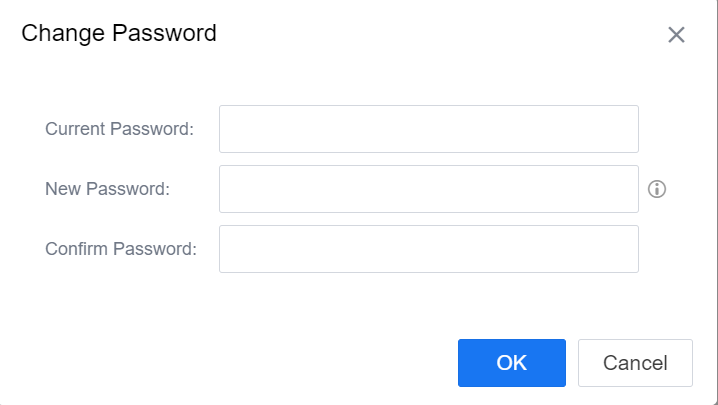
- If you do not choose to change your password after logging in, you can also click on the administrator’s avatar to change your password.

The password requirements are as follows:
- Cannot contain the username.
- Must be 8 to 16 characters.
- Must contain three of the following: uppercase letters, lowercase letters, digits, and special characters.
Integrated with the VDC platform
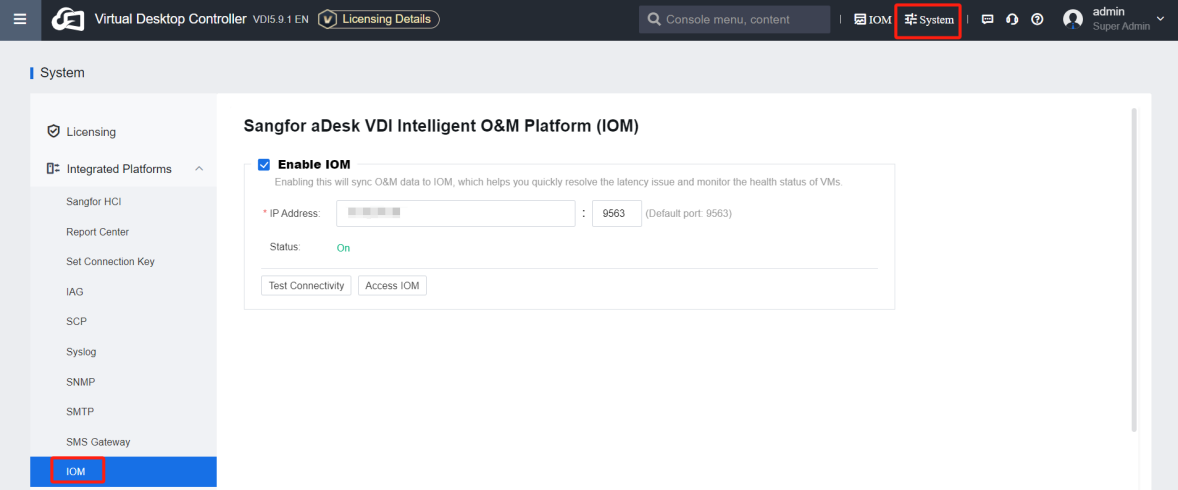
Log in to VDC. Navigate to System > Integrated platform > IOM for integration, as shown below.
IOM Platform
Homepage
The Homepage has seven modules: Overview, Alert Events, VDC/HCI Monitor, Health Status, Online Users, App Experience, and Intelligent Analytics Overview.
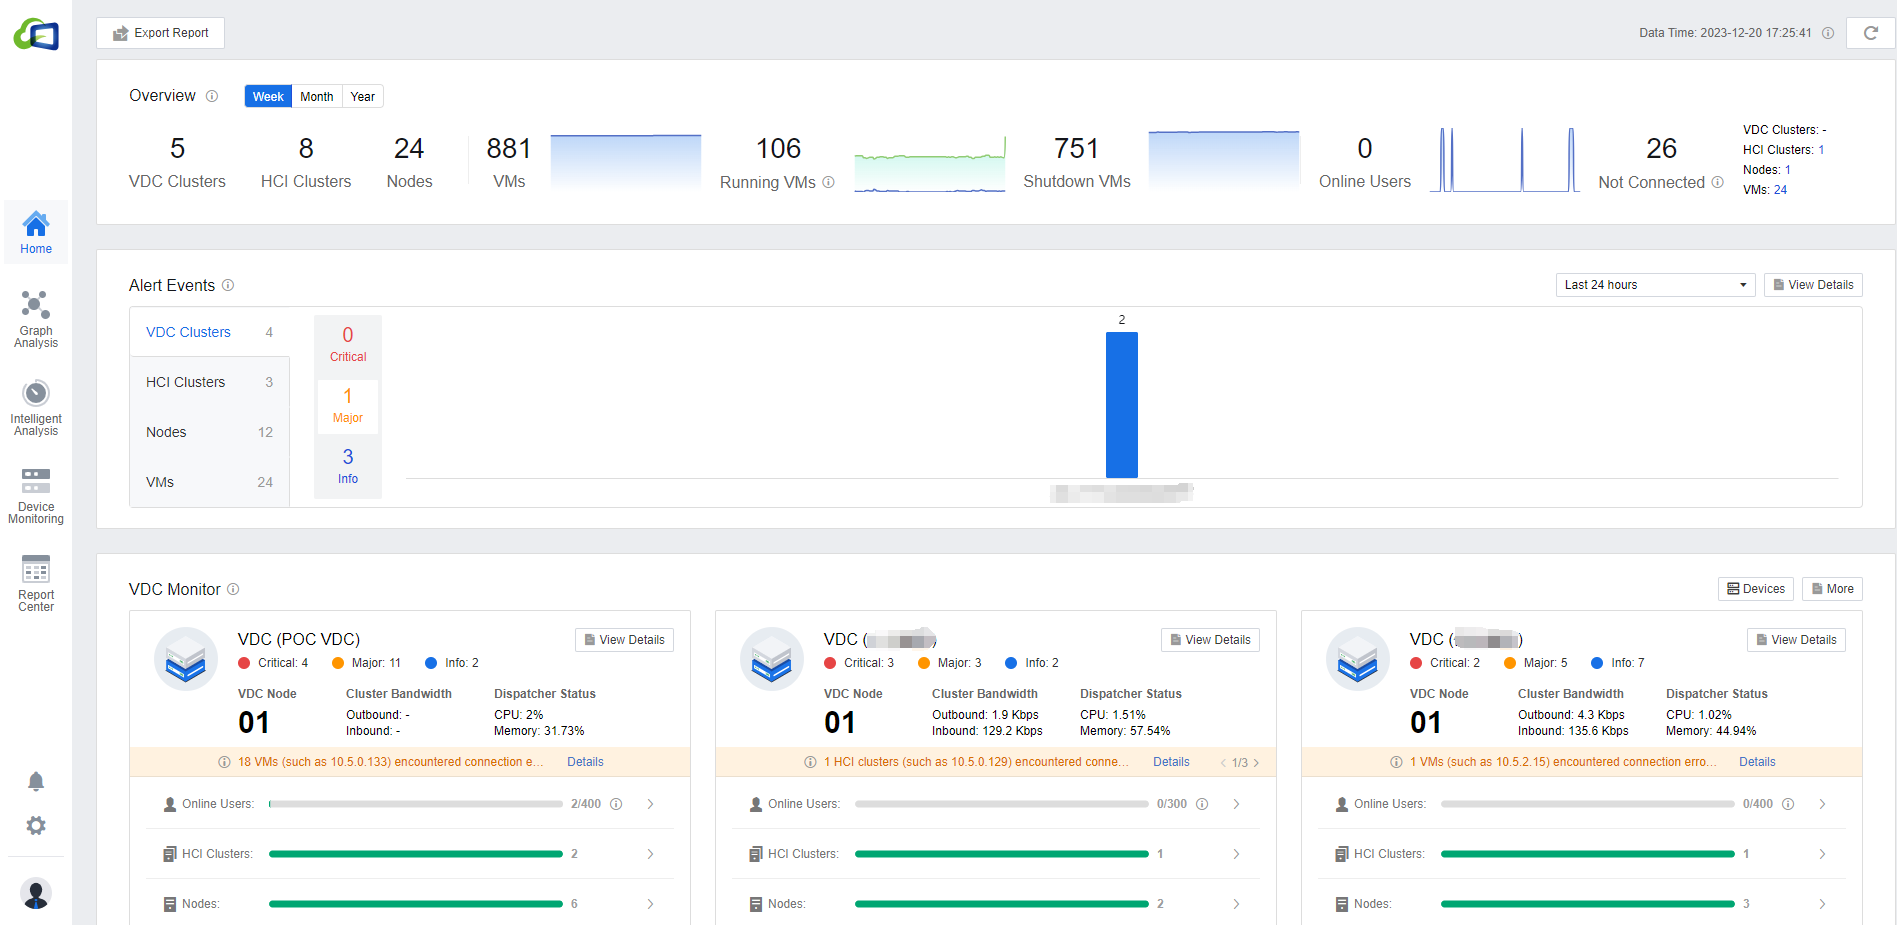
The overview allows you to see the number of VDC/HCI clusters currently connected, the number of nodes, the number of virtual machines, as well as the number of virtual machines switched on and off, and the number of online users with unconnected VDC/Virtual Machines/clusters/nodes. Administrators can quickly navigate to the current utilization of the desktop environment on the Homepage.

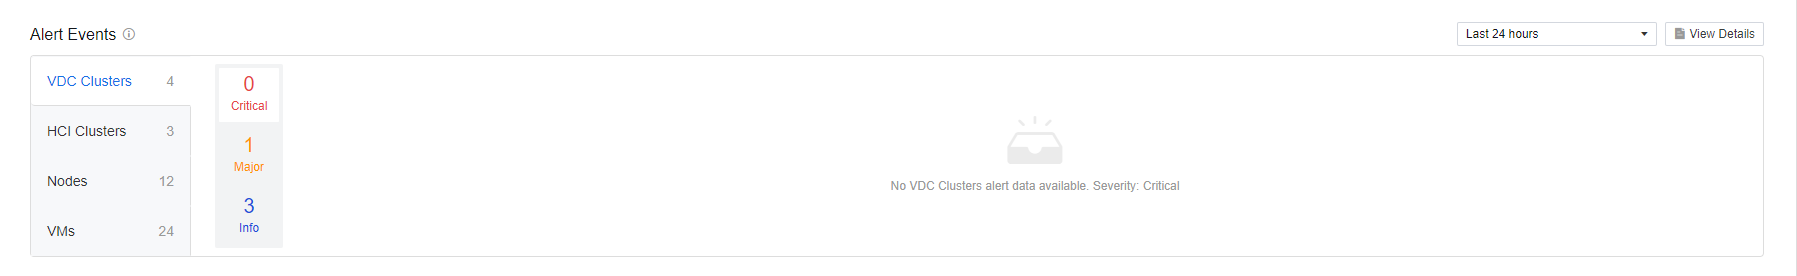
Alert Events
Alert events display the alerts for VDC/HCI clusters, nodes, and virtual machines. According to the severity of the events, categorize them into Critical, Major, and Info. Click on the corresponding alert to jump to the details of the corresponding alert page, which is convenient for administrators to locate the alerts quickly.
VDC Monitor
VDC monitoring can provide the number of Online Users, HCI Cluster, Nodes, and VMs for each cluster. You can also see the outbound/inbound bandwidth and CPU/memory of the VDC. Click the View details button to view the overall environment utilization alerts from the VDC cluster perspective.
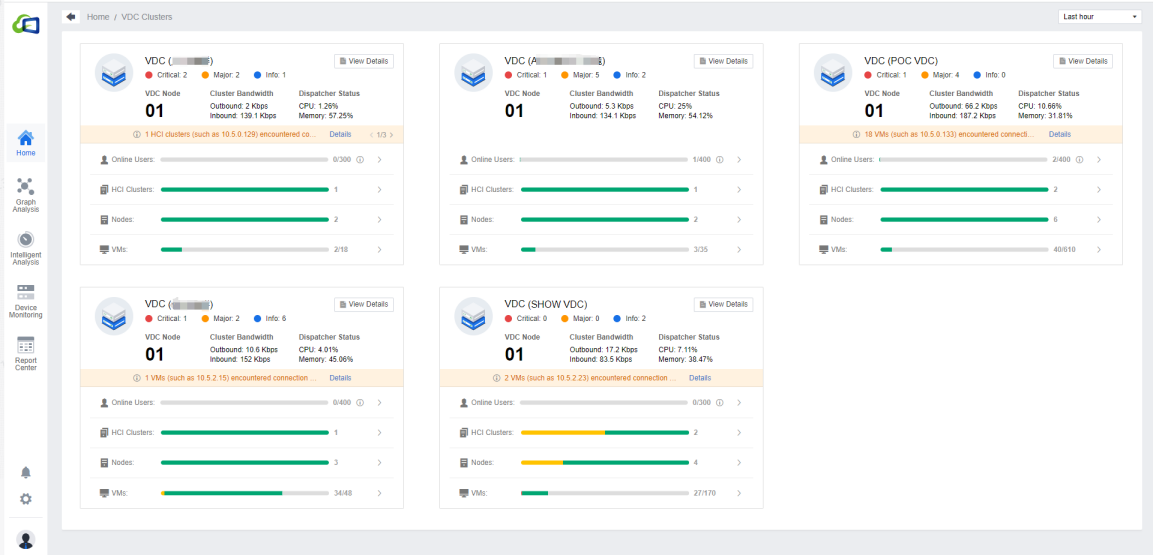
Note: The VDC alerts shown here are consistent with the alerts on the VDC devices. Please log in to the VDC platform to eliminate the alert.
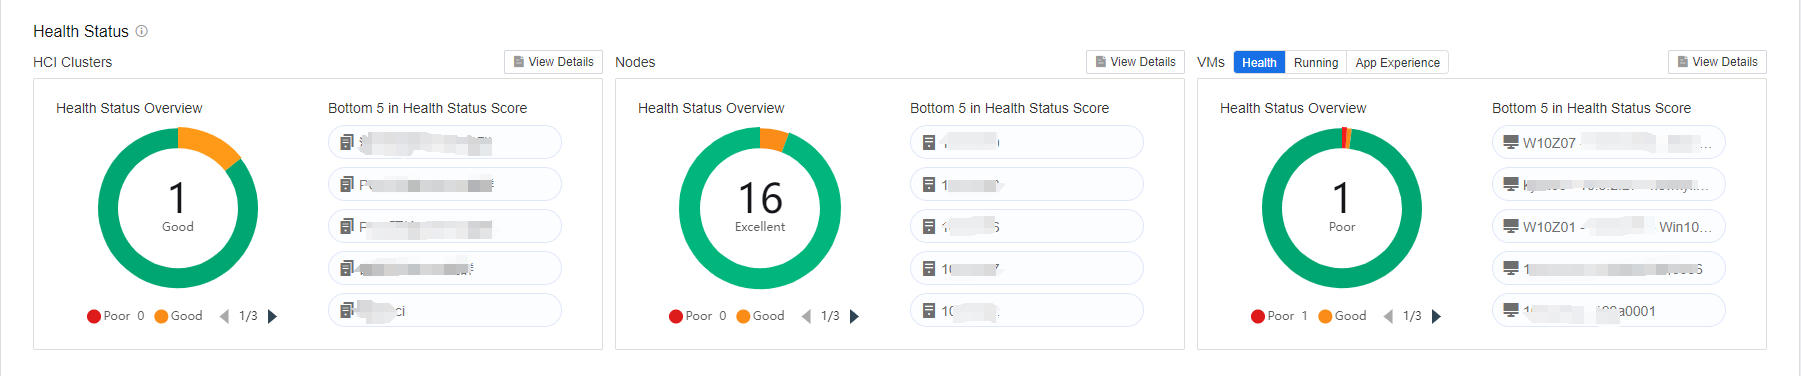
Health Status
The health status module includes the load distribution and trend of HCI clusters, nodes, and VMs. It ranks the high-load nodes and VMs according to AI intelligent algorithms, and clicking on the device name can enter the device’s detail page. It also displays last week’s cluster load trend graph to help the administrator manage the clusters, nodes, and VMs.
Online Users
This module allows you to see the IOM-integrated VDC concurrent users. It supports viewing the Trend of Concurrent Users by Day/Week/Month. Click the Export Online Users button to export the list of online users directly.
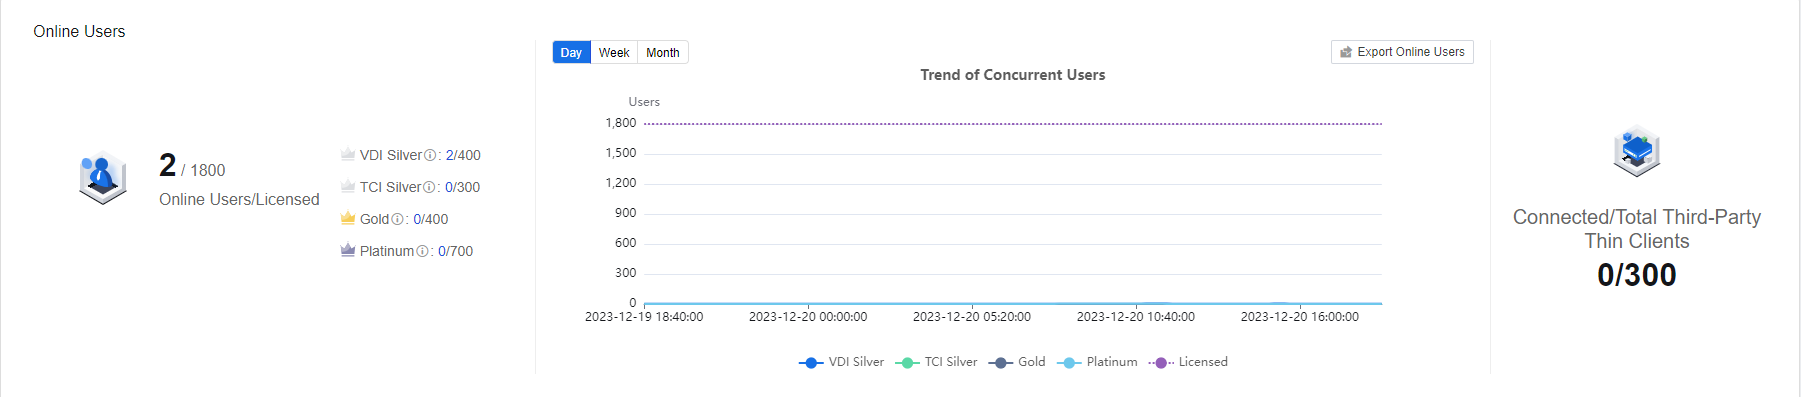
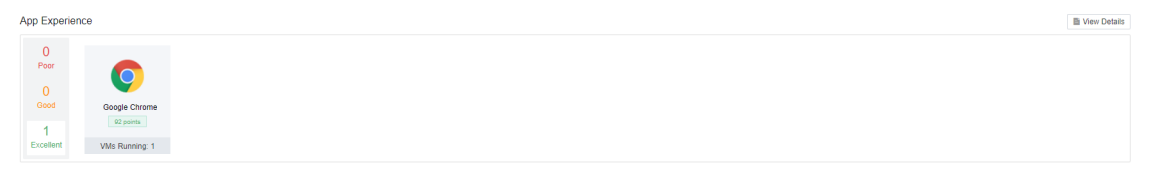
App Experience
The App Experience module is based on AI algorithms, plus a collection for the usage of VM applications to classify all the applications used within the environment into three categories: Excellent, Good, and Poor. It also shows the number of VMs running the application in the environment now. Click View Details to show the details of the application.
Intelligent Analytics Modules
The Intelligent Analytics module below shows an overview of the analysis results of IOM self-developed algorithms:
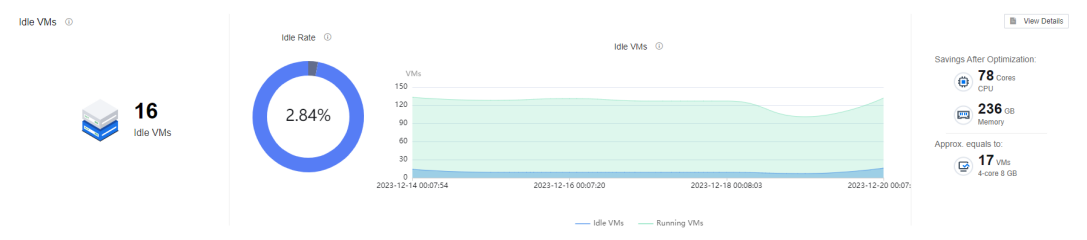
Idle VMs show the total number of idle VMs, the percentage of idle, the trend of the number of idle, and the estimated resource-saving after the optimization.
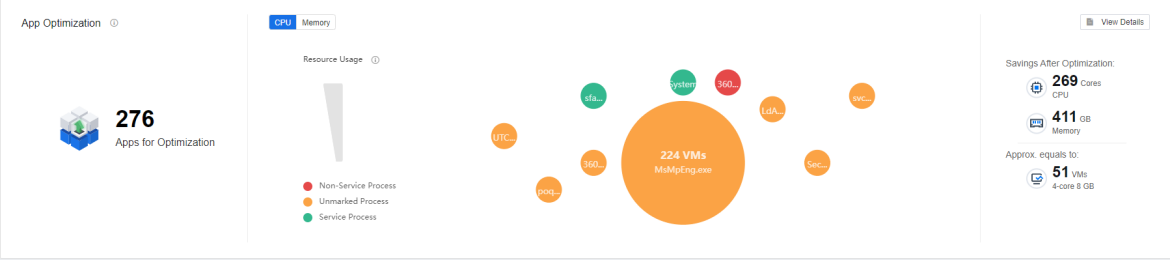
App Optimization shows application details with high resource consumption and resource consumption in CPU and memory in bubble charts, intelligently classifies the application into Service Process, Non-Service Process, and Unmarked Process**, and intelligently estimates the resource-saving after the optimization.
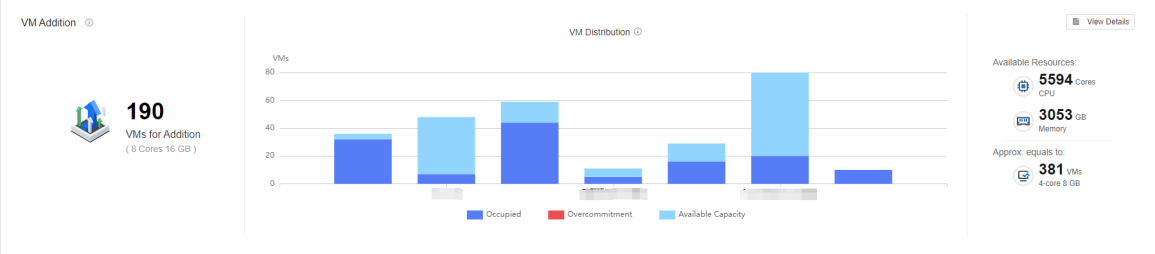
VM Addition shows an estimate of the remaining resources in clusters in the current environment and intelligently estimates how many new VMs can be added.
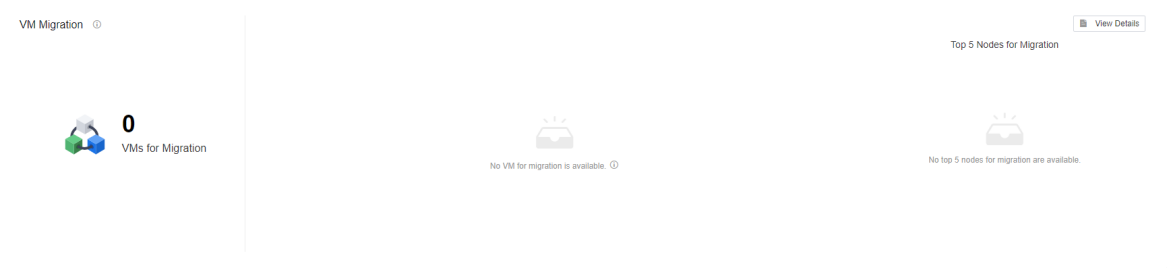
VM migration shows the recommendations for VM migration across clusters and nodes.
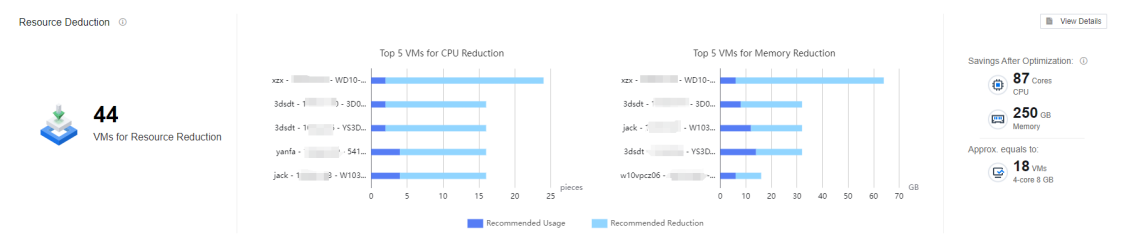
Resource Deduction shows the total number of VMs for Resource Reduction, the Top 5 VMs for CPU Reduction, and the Top 5 VMs for Memory Reduction. It also intelligently estimates the resource-saving after reduction.
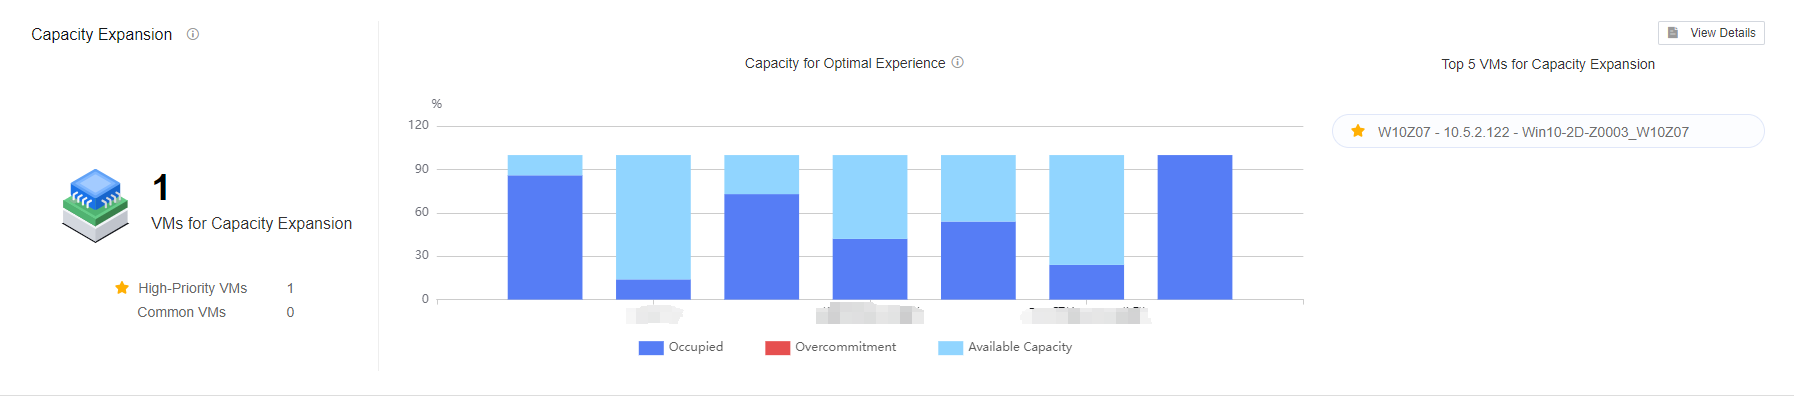
Capacity Expansion shows the TOP 5 list of VMs that need to expand their capacity in the current environment analyzed by the algorithm and gives the distribution of the Capacity for Optimal Experience.
Note: The estimated resource-saving optimization is calculated based on AI intelligent analysis algorithms combined with expert knowledge.
Devices Name Change
Navigate to Homepage > VDC Monitor > Devices. You can rename the VDC devices and HCI clusters to make it easier for administrators to monitor the environment.


VDC Cluster Monitor Details
In Homepage > VDC Monitor > View Details, you can view the corresponding VDC clusters, HCI clusters, Nodes, VMs, and their details.
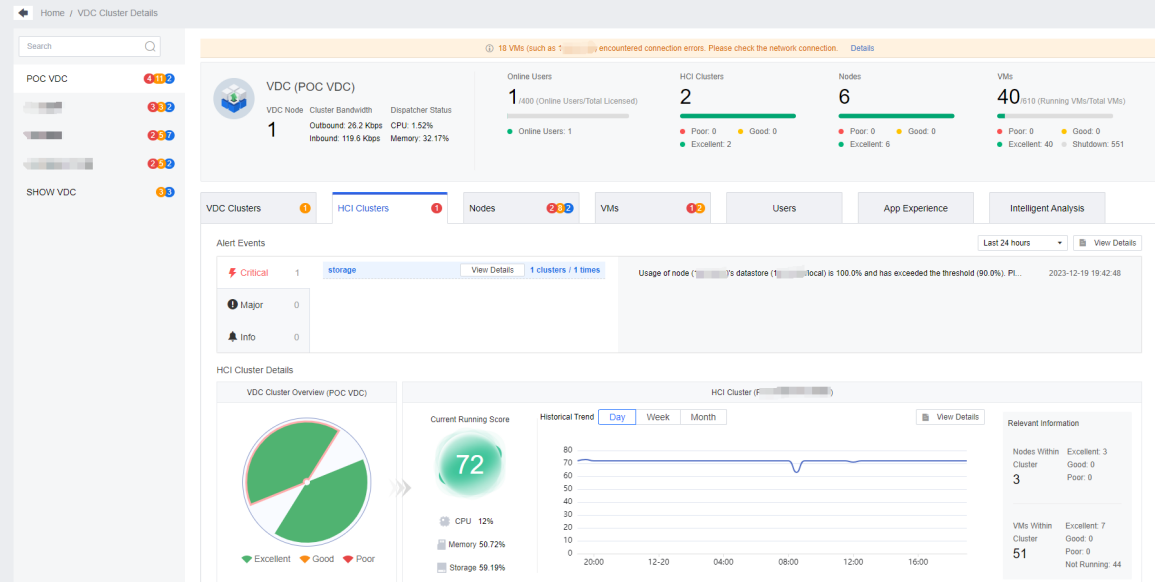
Note: The alerts and related parameters of the VDC cluster are obtained from the VDC.
Alert Center
Click the Alert icon in the lower-left corner of the home page to enter the Alert Center page. The Alert Center page shows the affected objects, occurrences, and last failed occurred. It supports the view of alert information up to the last 24 hours, according to the severity and object type of the filter. The search bar supports the fuzzy search. Click View Details to jump to the device monitoring page to help O&M administrators fully verify the problem situation. Each alert comes with a recommendation, and users can solve the issue by following the recommendations.

Notice: When using the IOM platform for the first time, you need to power on the virtual machine with version 5.9.1 and above. Install and wait for about 15 minutes before monitoring and collecting data (i.e., when using it for the first time, you need to wait for about 15 minutes before you can see the relevant data on the IOM, so remember to associate the IOM on the VDC in advance according to the steps in subsection 2.3.3).
Graph Analysis
Troubleshooting Using Graph (Node view)
-
The graph interface analysis is from the cluster, node, or virtual machine perspective. The corresponding device score is calculated using the AI intelligent algorithm, expert advice, and guidance. Green represents excellent, which can be ignored for the time being; yellow represents good, which is recommended to deal with during off-period time; red color represents poor, which urgently needs to be dealt with.
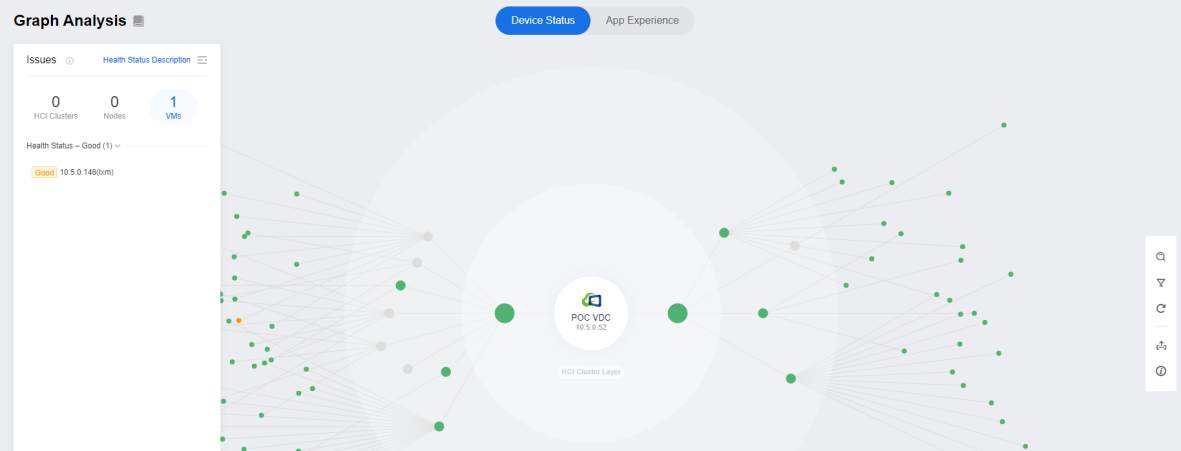
-
In the graph interface, we can observe the overall environment, find the equipment that needs troubleshooting, and click Analyze to be redirected to the troubleshooting interface.
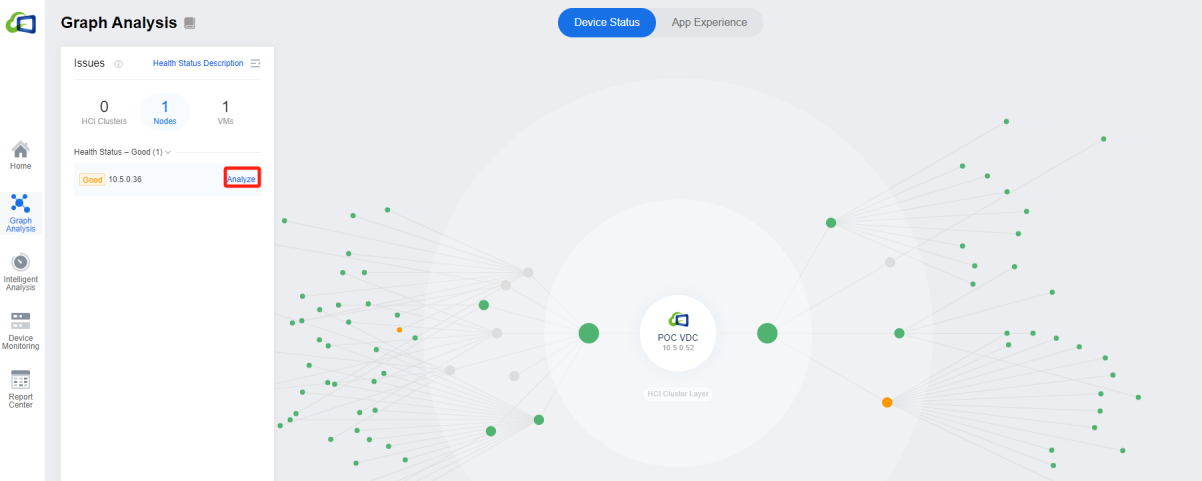
The node troubleshooting view allows you to visualize the components related to the scoring, such as Nodes or VMs.

-
When you click the icon on the honeycomb diagram, the recommendation for that component will be highlighted. Click the icon to expand it, and you will see the details of the corresponding recommendation. The lower the health score, the higher the number of issues, and it is recommended that the issues be prioritized.
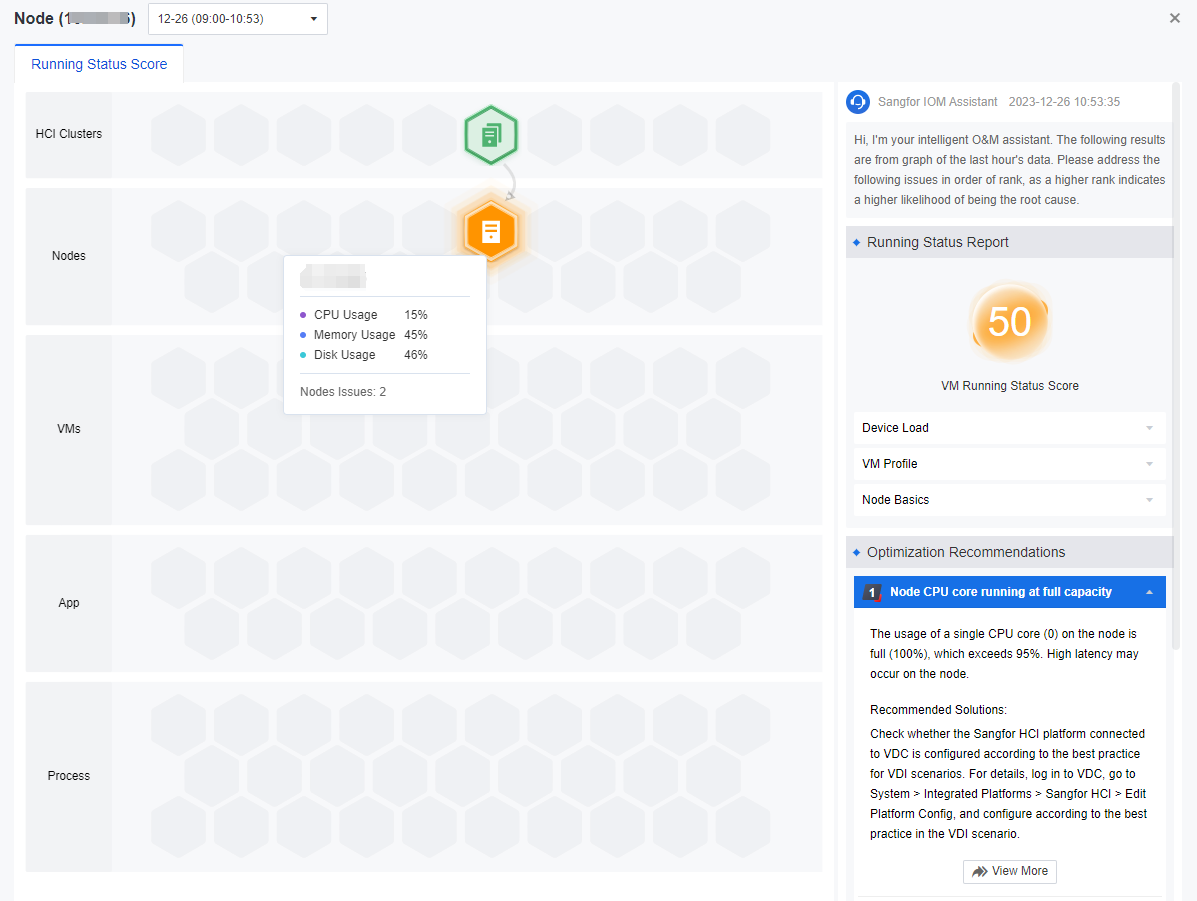
-
As shown above, the direction of the arrow pointing indicates that the point has a more significant impact. Thus, troubleshooting the point that has a significant impact first is recommended.
Troubleshooting Using Graph (VM View)
In the VM view, the status score of applications and processes has been added in addition to clusters and nodes. Administrators can quickly locate and handle a process or application within a VM that is more impactful. Click the icon on the honeycomb graph, and the recommendations on the right will be highlighted.
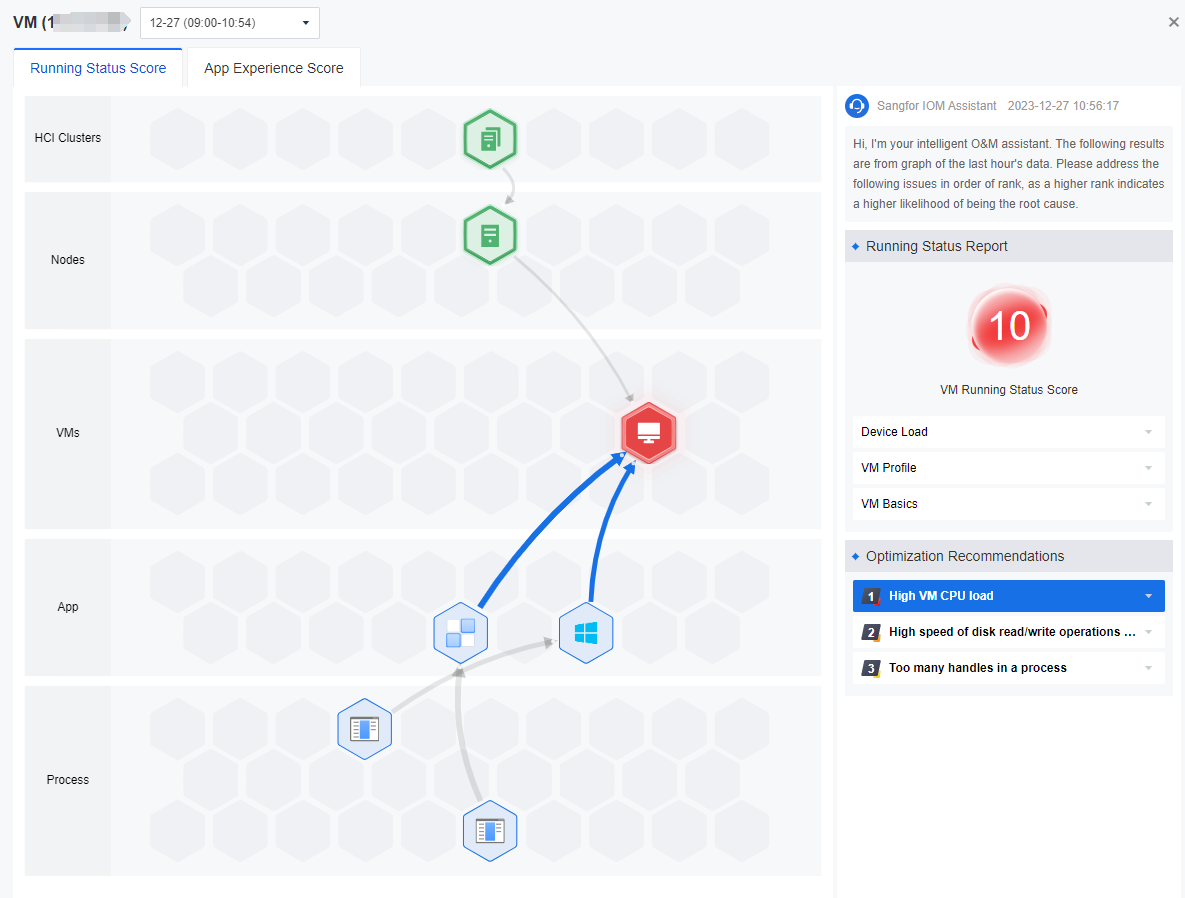
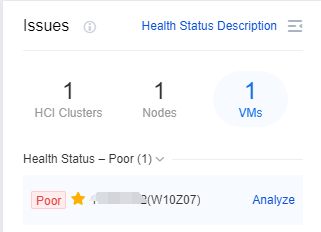
The graph analysis shows that the corresponding HCI Clusters/Nodes/VMs are in poor health status, and we can click Analyze on the Issues.
Troubleshooting Using Graph (App View)
App Experience uses AI algorithms to analyze and quantify the user’s core application experience from the VDI application performance monitoring and application resource management. Provide Optimization Recommendations based on expert experience and knowledge for the applications with poor user experience.
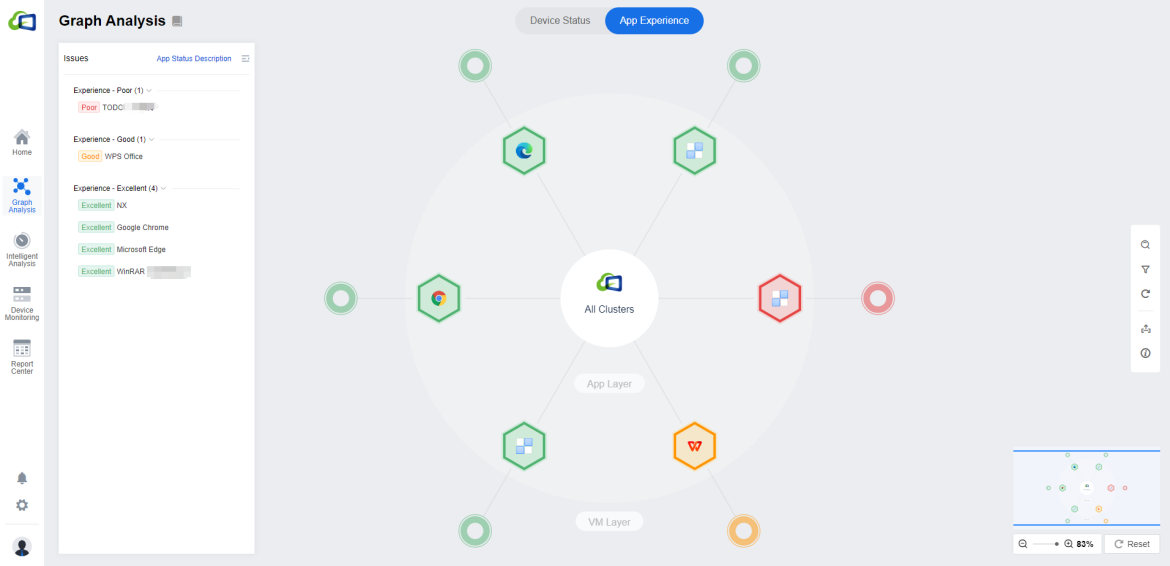
You can click on the app you need to focus on and click Analyze to analyze and handle the individual applications.
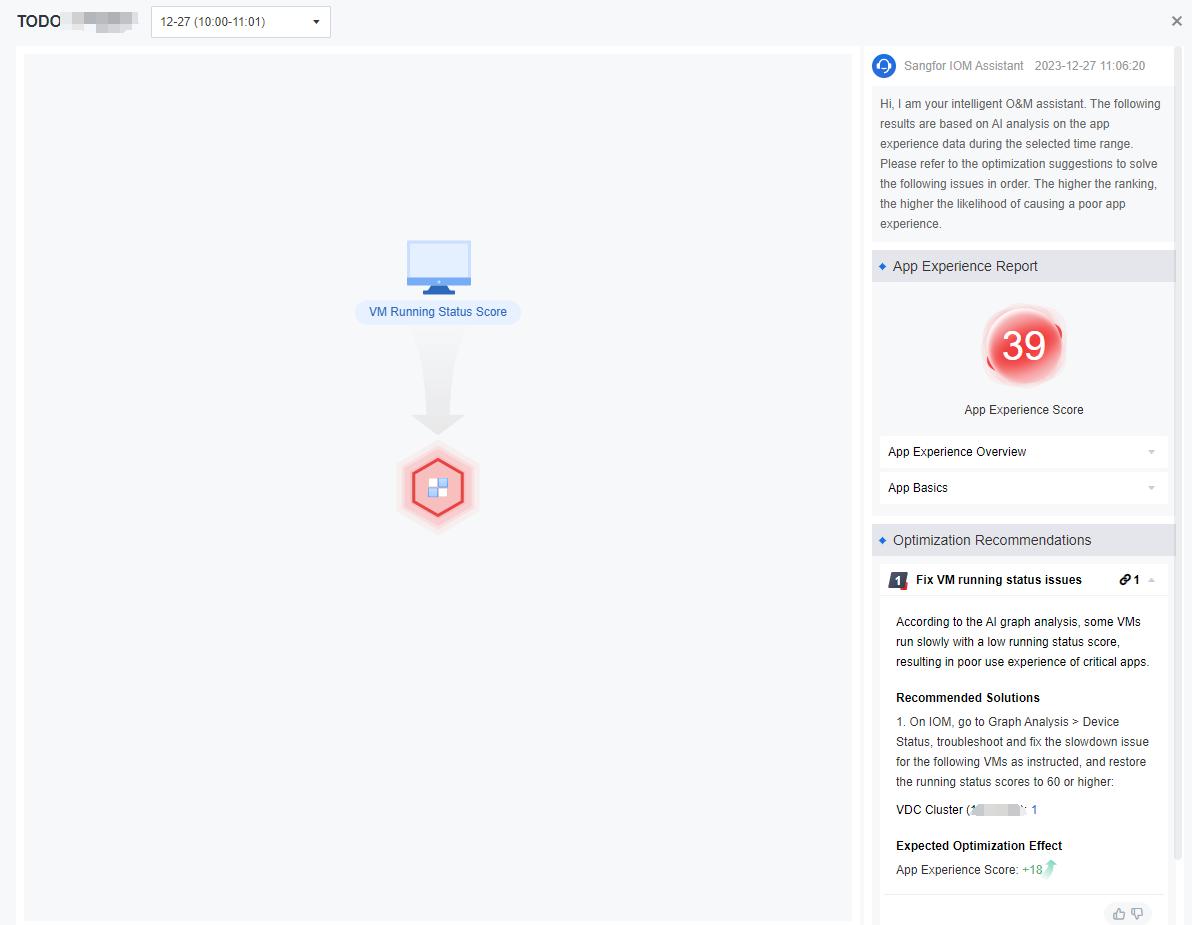
The AI analysis capabilities in the App Experience graph have been used to conduct in-depth model learning for apps prone to poor experience and lag in some desktop cloud scenarios. When the app in the following list appears in the environment, more accurate recommendations will be given:
- AutoCAD 2022
- AutoCAD 2021
- AutoCAD 2020
- AutoCAD 2019
- AutoCAD 2018
- HCCAD
- HCCAD2022
- Autodesk Inventor 2022
- Autodesk Inventor 2021
- Autodesk Inventor 2020
- Autodesk Inventor 2019
- Autodesk Inventor 2018
- CATIA V5, CATIA V6, CATIA 3DEXPERIENCE
- Autodesk Maya, Maya 3D
- Autodesk 3ds Max, 3ds Max
- SolidWorks, SolidWorks Premium, SolidWorks Professional
- Siemens NX, NX Unigraphics
- Autodesk Revit, Revit Architecture, Revit MEP
- Unity, Unity VR
- Adobe Photoshop, Photoshop CC
- Adobe Illustrator, Illustrator CC
- PyCharm
- GoLand
- IntelliJ IDEA
- Microsoft Word
- Microsoft Excel
- Microsoft PowerPoint
- Microsoft Outlook
- Microsoft Edge
- Firefox
- Google Chrome

After deploying the IOM platform for the first time, there may be no data in the graph analysis module because it takes time to collect data. Generally, you need to wait for 24 hours after the deployment, and the homepage data is displayed.
Intelligent Analysis
Idle VMs
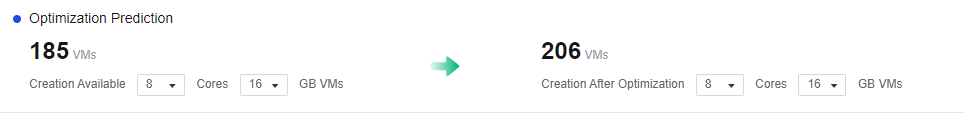
The following figure shows an overview of idle VM identification and a list of identified VMs, where the Idle VMs section shows the number of idle VMs, idle rate, and idle VM trend, and the optimized prediction is estimated by AI algorithms combined with experts’ knowledge & experience. It compares the current VM available to create and the VM available to create after optimization.
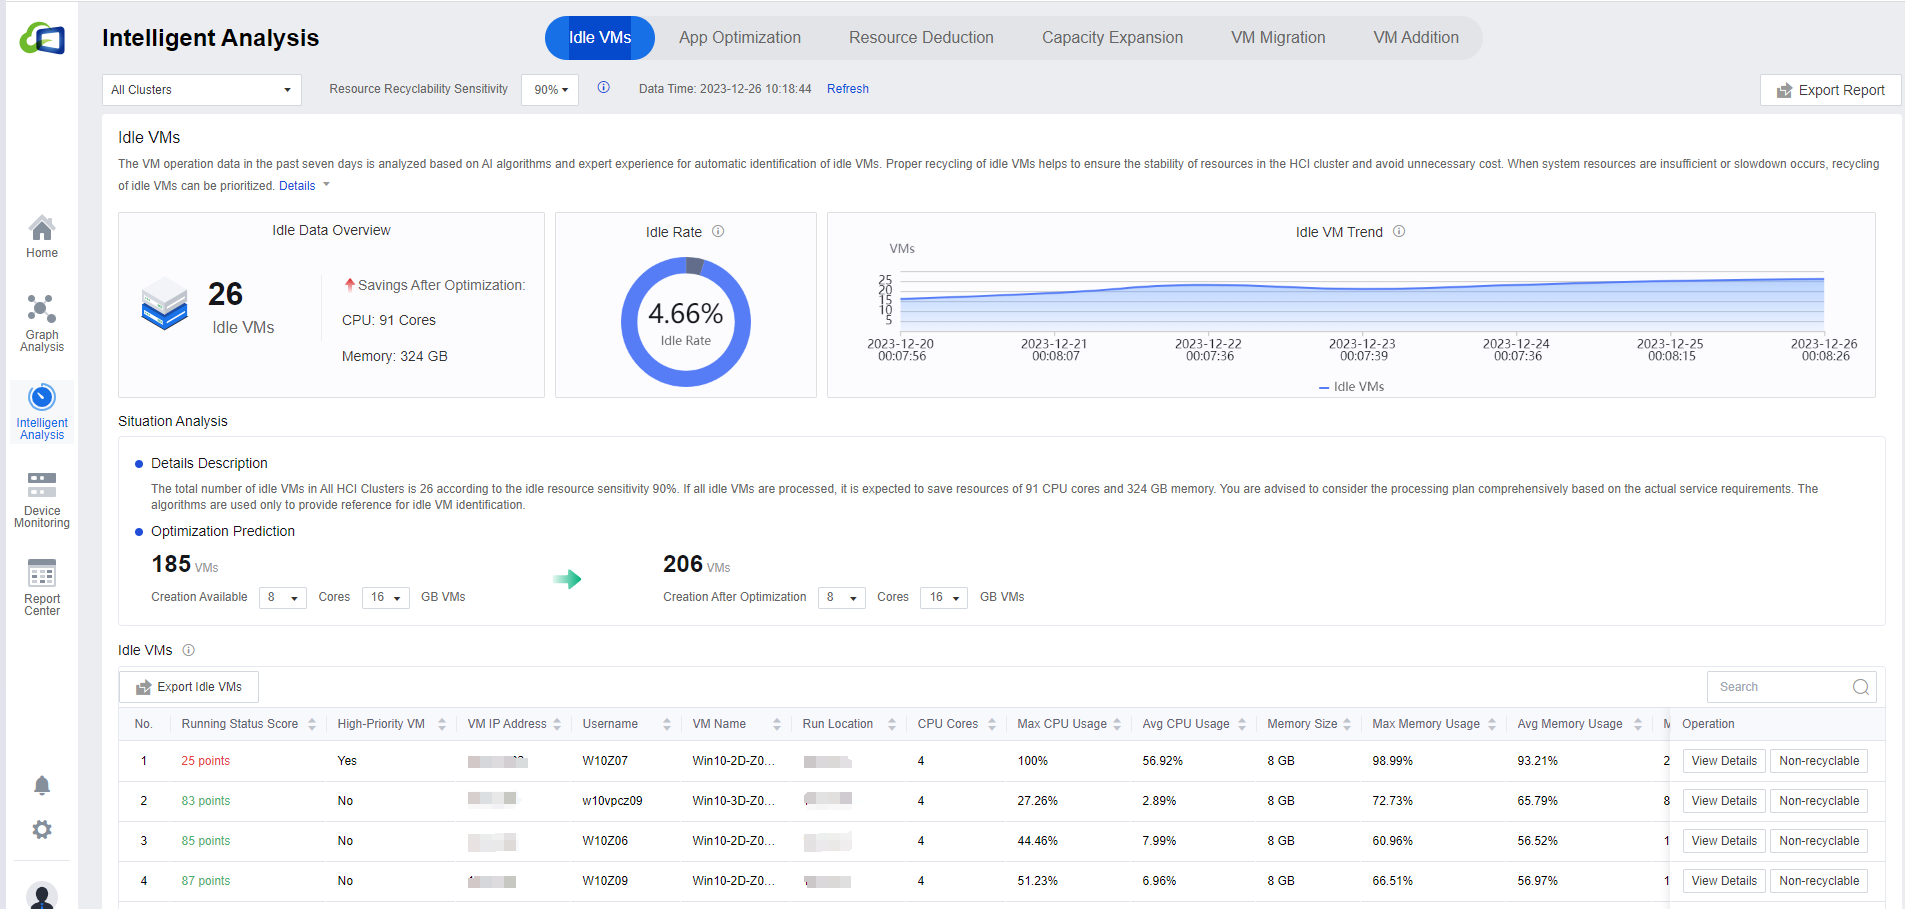
Click All Clusters to show the drop-down list of available clusters.
Click Resource Recyclability Sensitivity to set the sensitivity. The higher the sensitivity, the higher the value indicates higher idle accuracy. In the Optimization prediction module, you can select different configurations of CPU and memory to know the current state and the state after optimization of creating the VM.

In the Optimization Prediction, you can modify the number of cores and CPUs to adjust the prediction data according to the actual environment requirements.
- On the Idle VMs list page, click View Details to jump to the virtual machine details page, which shows the detailed monitoring data of the virtual machine, making it convenient for administrators to analyze the data and confirm whether it is idle. Click Non-recyclable to mark the VMs in the list that administrators think are inaccurately recommended. Filling in the reason can help the platform improve the accuracy of the idle identification algorithm. The search bar supports fuzzy search in all fields. Click the Export Idle VMs button to export the table in an excel format.
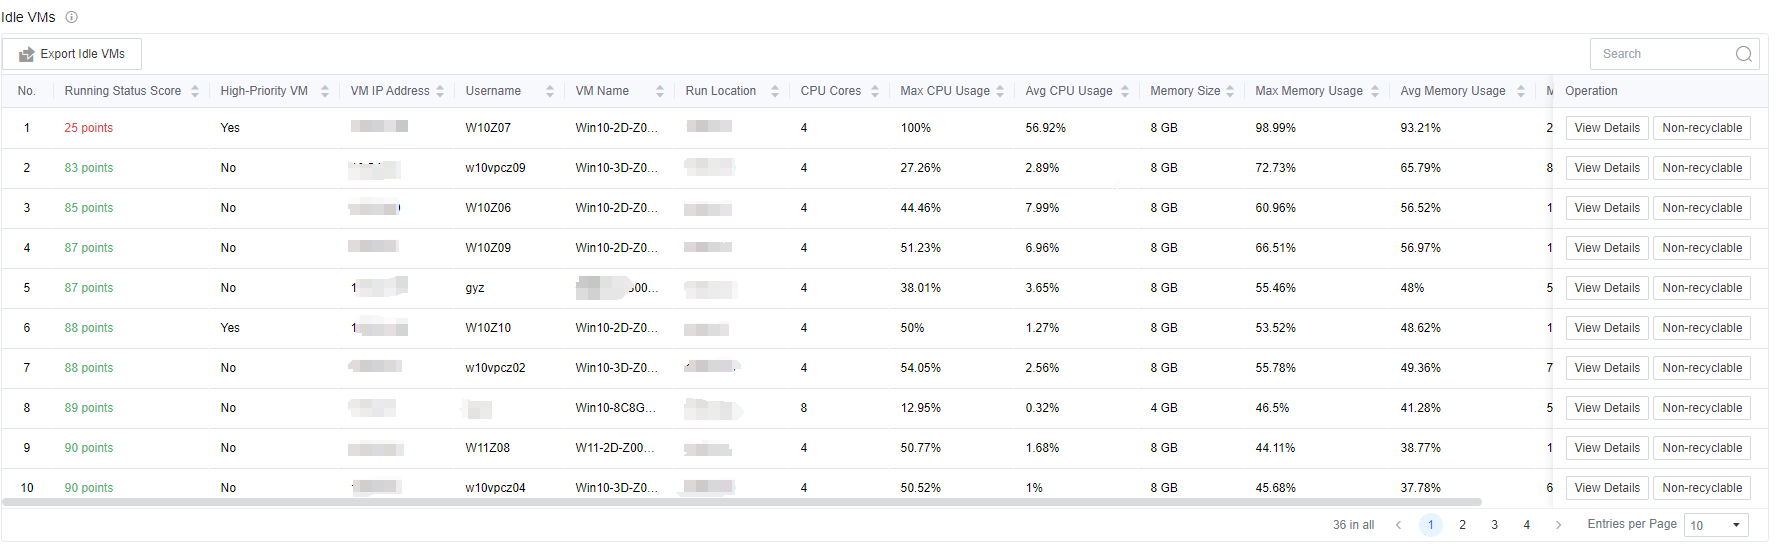
Note: Because of the need to collect virtual machine resource utilization, the list refresh time is 7 days. If you cannot see the specific content in the list, it may be because the connection time with the environment (VDC) is not long enough.
App Optimization
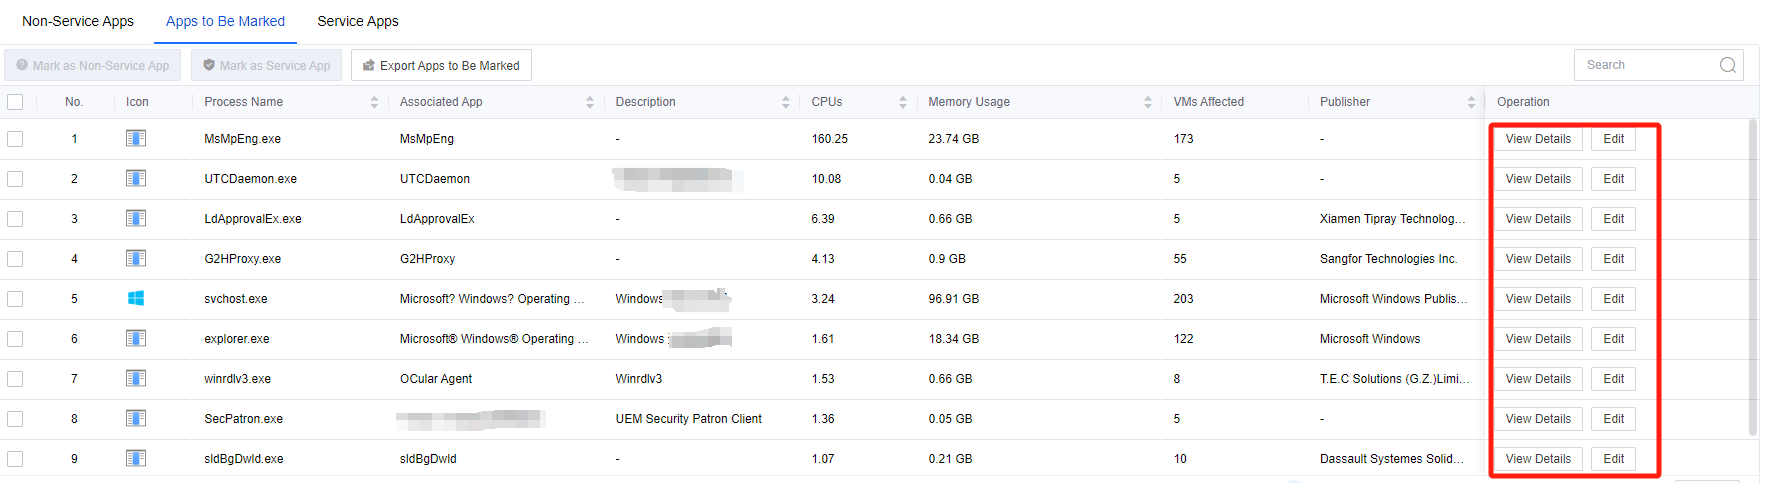
The following figure shows the interface for identifying app to be optimized and calculating resource consumption. IOM intelligently identifies app into three categories: Service Apps, Non-service Apps, and Apps to Be Marked, and counts the number of app in each category, providing the overall resource consumption status (CPU, memory, and the number of VMs affected). The list shows the publisher and description of each app, the specific resource consumption values, and the number of VMs affected. Click All Clusters to show the drop-down list to select the individual clusters.
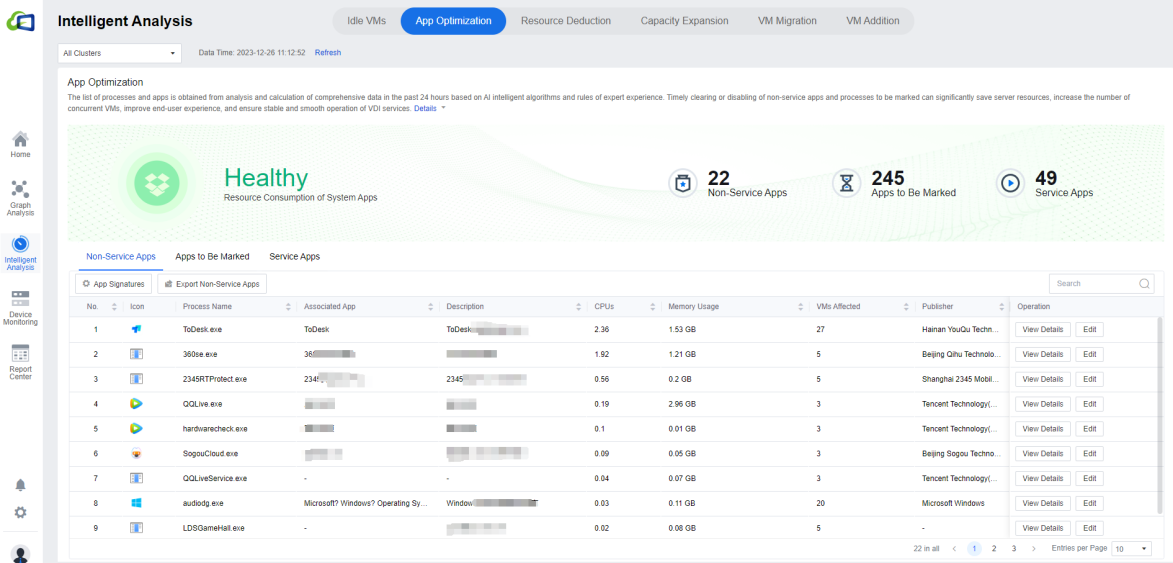
Click App Signatures to enter the application’s system settings page. You can create New or Delete the Service Apps or Non-Service Apps according to the actual scenario. You can Import / Export the corresponding Service Apps/Non-service Apps list in CSV format. You can click Download Sample to download the corresponding sample for reference.
Select Apps to Be Marked,select the app, and mark the app by clicking Mark as Non-service App or Mark as Service App.
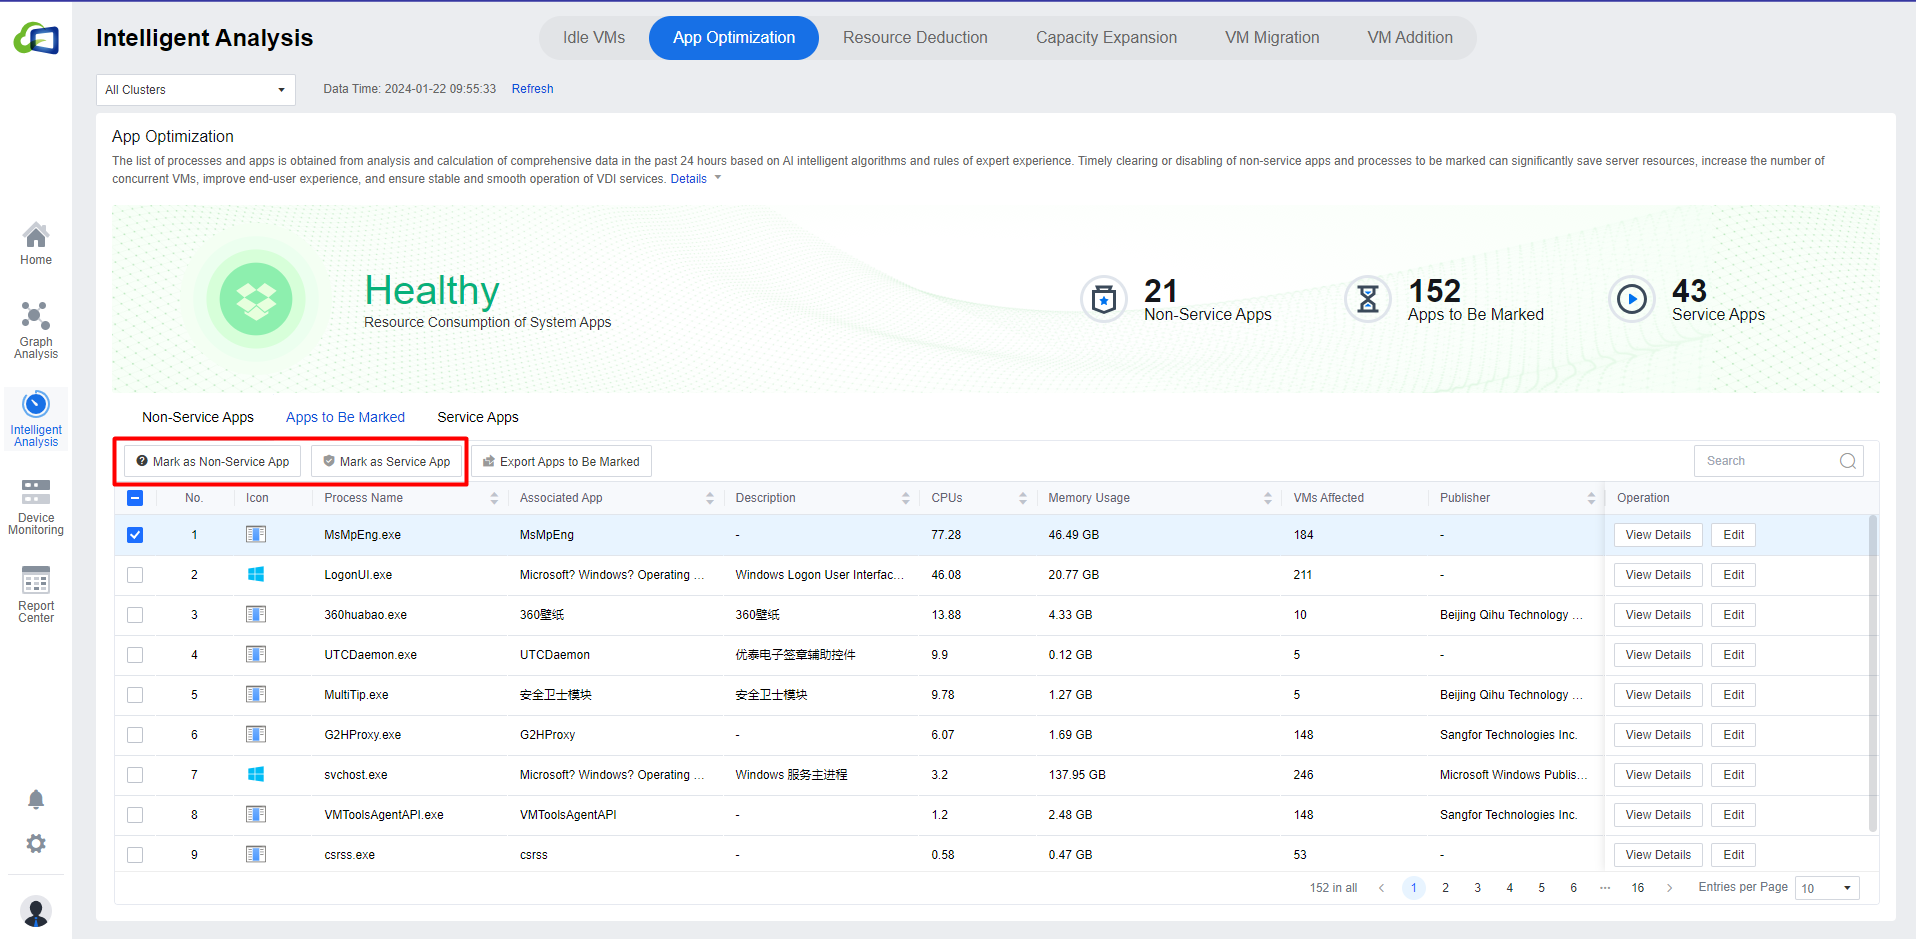
You can click View Details to view the virtual machine using the application. You can click Edit to modify the Associated App, Description, and Type. The search bar of the list supports fuzzy search.
Resource Deduction
- The following figure shows the Resource Deduction recommendation interface, which identifies the number of resource deductions in the current environment and the estimated value of resources that can be saved after optimization. It shows the TOP 5 VMs that can be deallocated from the CPU and memory perspectives, and it estimates the number of VMs that can be created currently and the number of VMs that can be created after optimization by combining the AI algorithm with the experience of the experts.
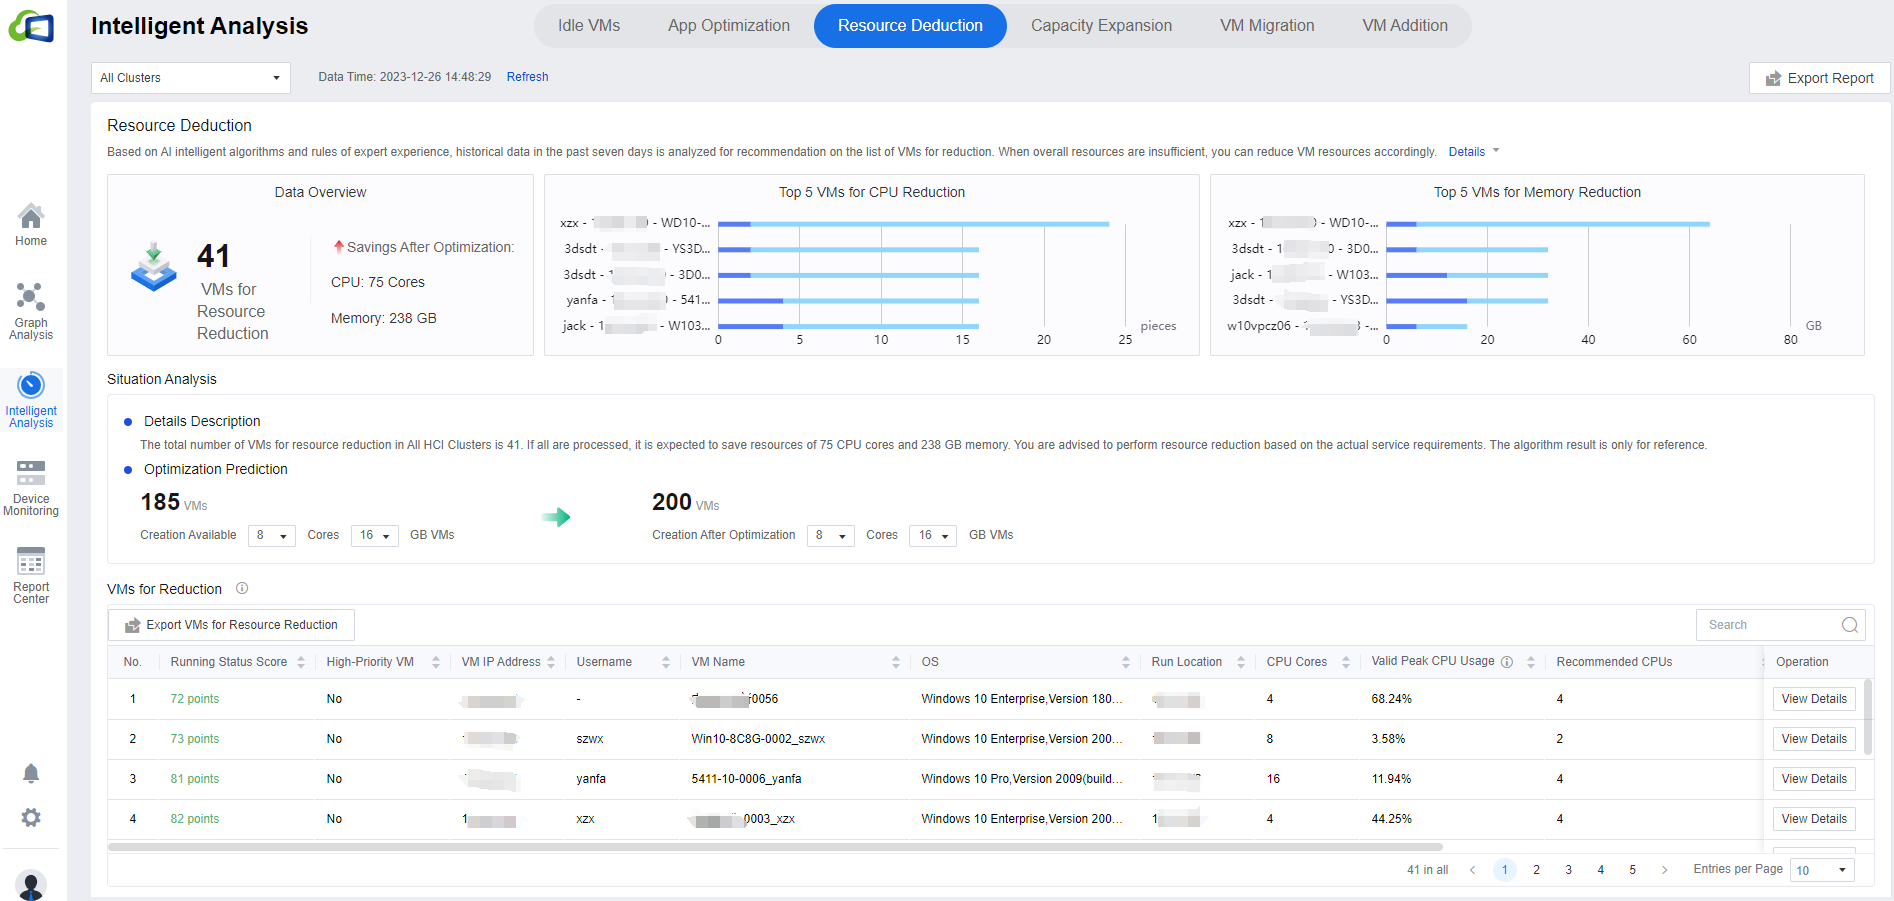
Click All Clusters to show the drop-down list to select a single cluster. In Optimization Prediction, modify the number of cores and CPU according to the actual environment for the prediction results.
In the VMs for Reduction list, you can view the virtual machine’s current configuration and Recommended CPUs for targeted provisioning. Click Export VMs for Resource Reduction to export the list; click View Details to view the corresponding virtual machine details. The search bar supports fuzzy search.
Note: Because of the need to collect virtual machine resource utilization, the list refresh time is 7 days. If the list can not see the specific content, it may be because the connection time with the environment (VDC) is not long enough.
Capacity Expansion
The following figure shows the Capacity Expansion recommendation interface, which identifies the number of capacity expansions in the current environment and the distribution of VMs in the cluster view. The Capacity Expansion Solution is divided into High-Priority VMs and All VMs.
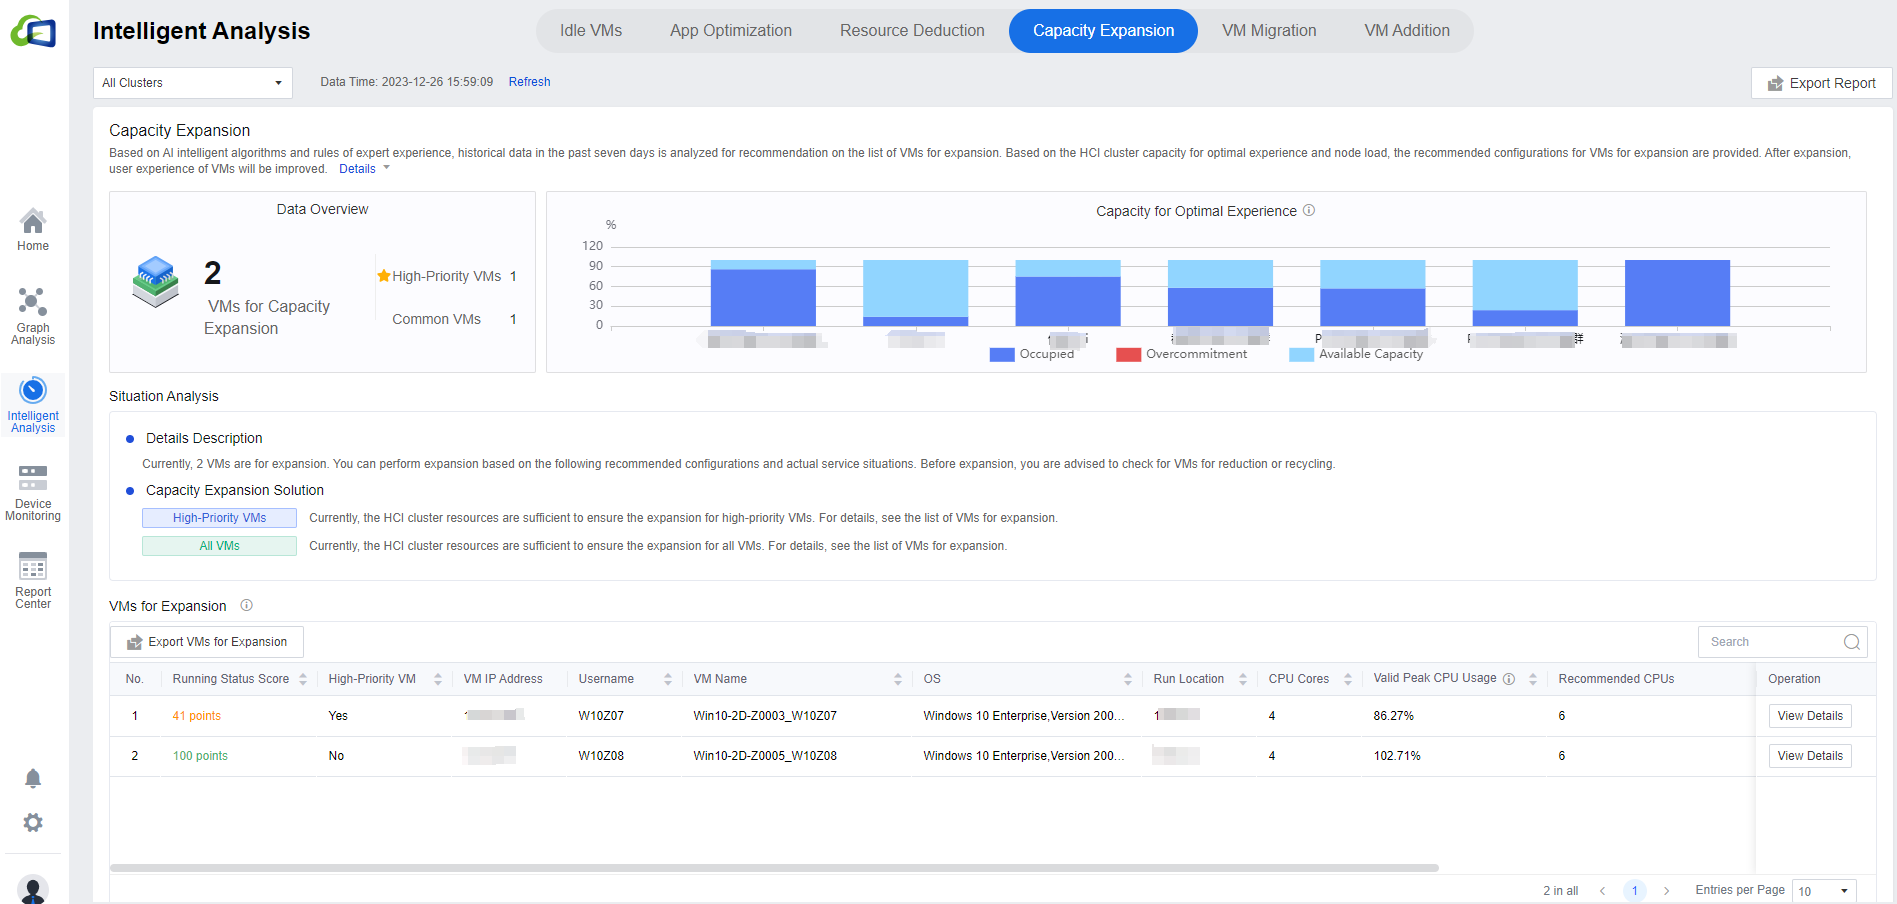
Click All Clusters to show the drop-down list to select a single cluster. In the VMs for Expansion list, you can view the current and recommended configurations of VMs for targeted expansion, click Export VMs for Expansion to export the list locally, and click View Details to view the details of the corresponding VMs. The search bar supports fuzzy search.
Note: Because of the need to collect virtual machine resource utilization, the list refresh time is 7 days. If the specific content is not visible in the list, it may be because the connection time with the environment (VDC) is not long enough.
VM Migration
The following figure shows the VM Migration recommendation interface, showing the number of VMs for migration and Recommendations for Migration Between Cluster. Click All Clusters to show the drop-down list to select a single cluster. The interface will display the selected cluster nodes’ migration recommendations. The search bar in the Nodes for VM Migration list supports fuzzy search.
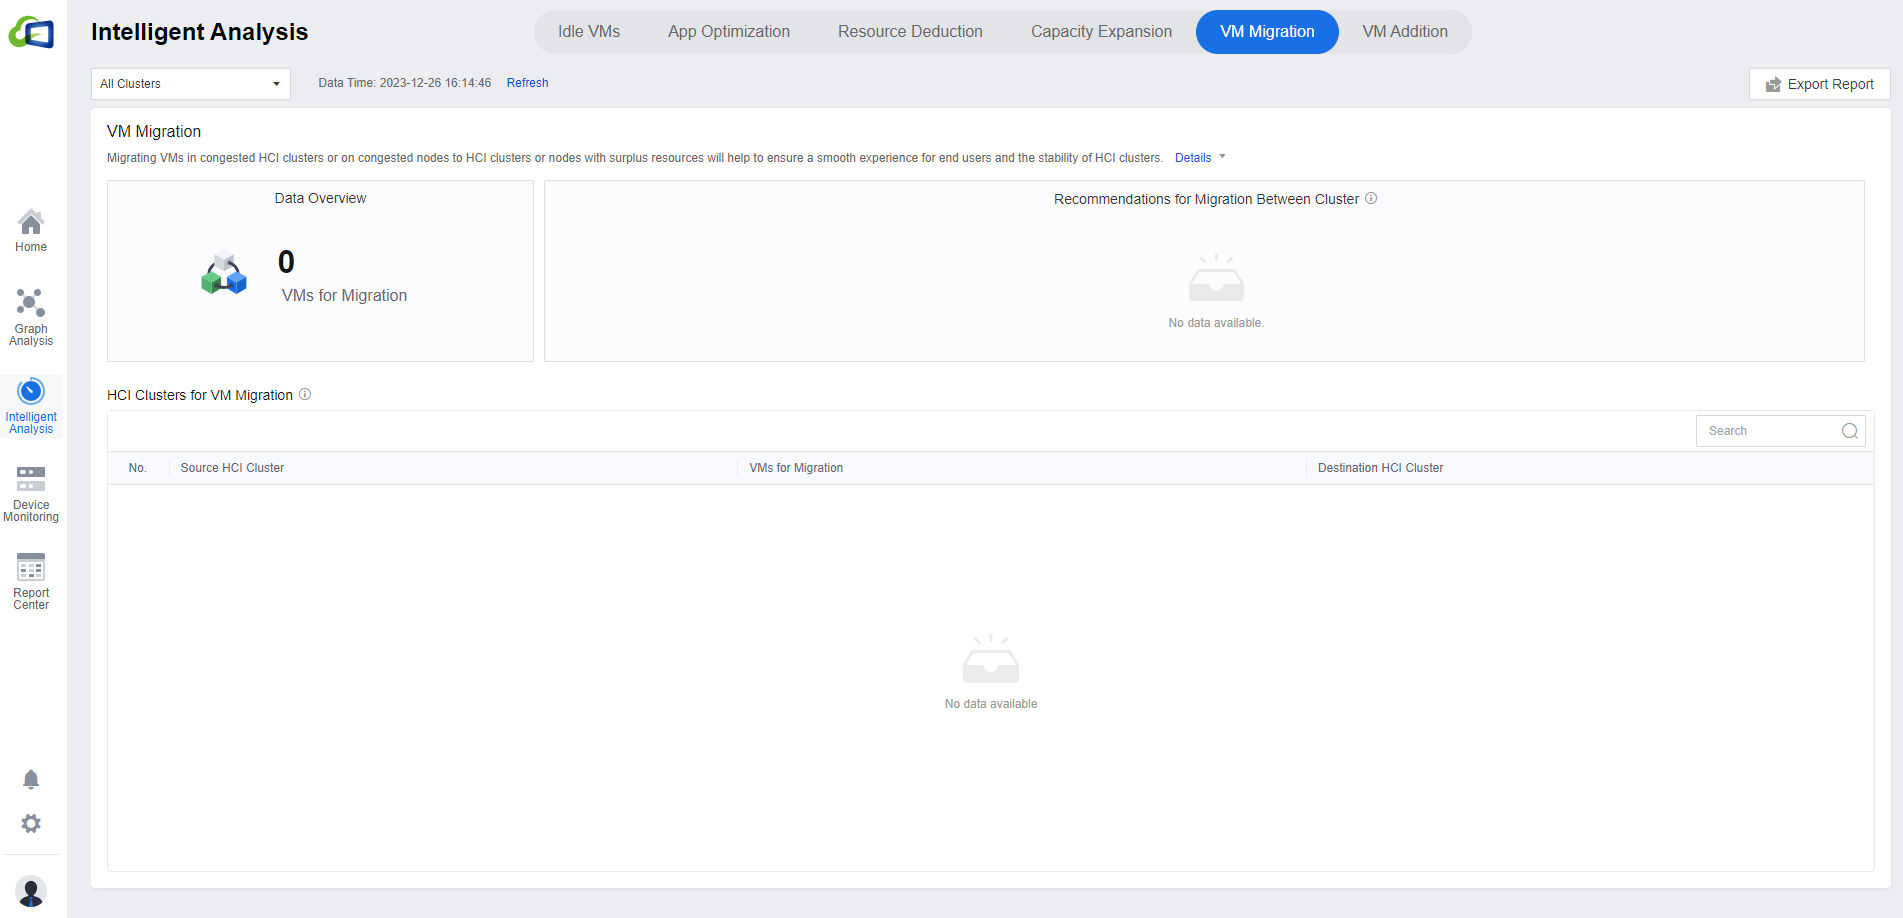
Note: Because of the need to collect virtual machine resource utilization, the list refresh time is 24 hours. If the specific content is not visible in the list, it may be because the connection time with the environment (VDC) is not long enough.
If the cluster resources are abundant and the load on the physical machine is low, the module may show an empty page.
VM Addition
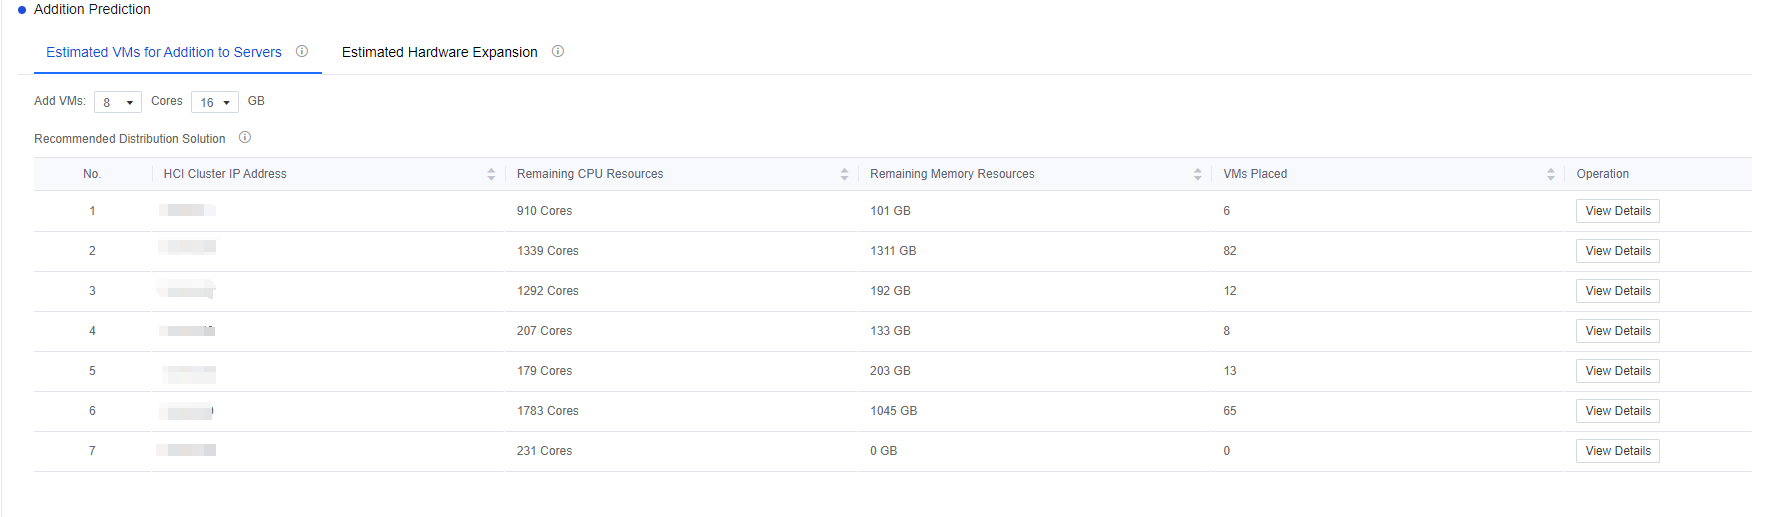
VM Addition shows the current VM distribution of best-experience capacity for clusters with the number of VM additions, hovering over the histogram to view the Available CPU Capacity, CPU Usage, Available CPU Capacity etc., for each cluster.
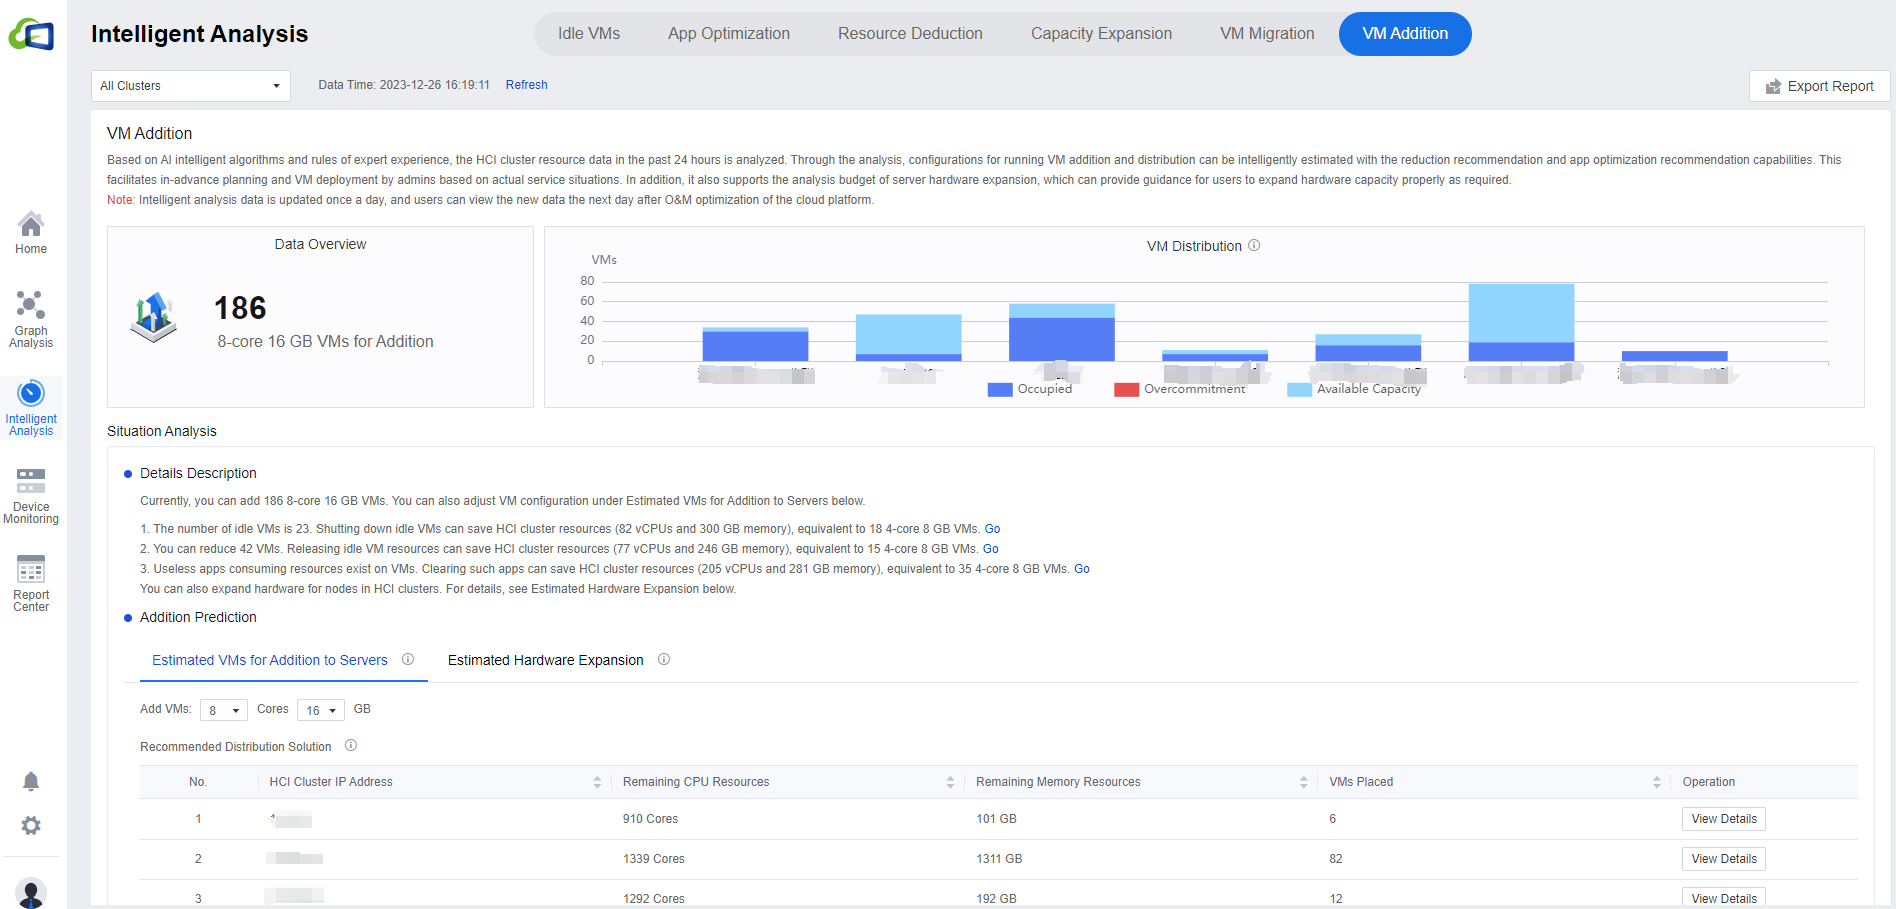
In Details Description, you can read the resource optimization effect of the Idle VMs, Resource Deduction, and App Optimization. You can click Go to enter the relevant page.
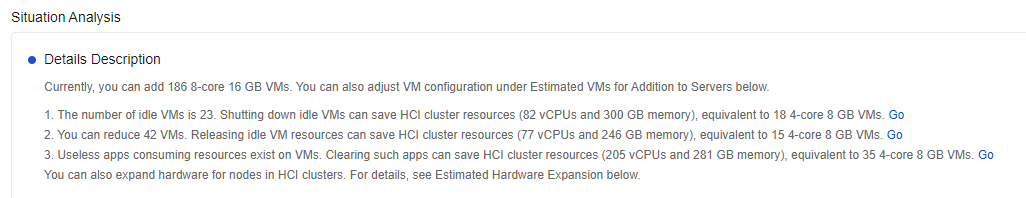
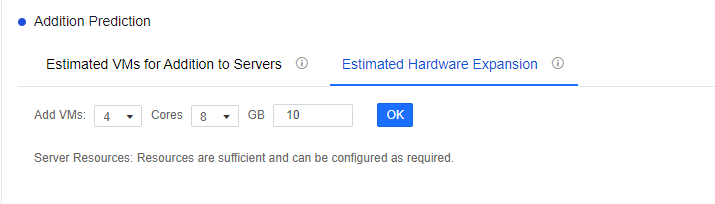
- Addition Prediction consists of Estimated VMs for Addition to Servers and Estimated Hardware Expansion. In Estimated VMs for Addition to Servers, click on the number of Cores and Memory to see the prediction result.
You can click All Clusters to show the drop-down list to select a single cluster. It will show the remaining resources at the node level and the Recommended Distribution Solution under the Estimated VMs for Addition to Servers tab. Click View Details to go to the specific cluster/node details interface. Click the Estimated Hardware Expansion tab to select a new plan and click OK to see whether the server resources are sufficient. If not, it will provide a specific suggestion.
Note: Because of the need to collect virtual machine resource utilization, the list refresh time is 24 hours. If the specific content is not visible in the list, it may be because the connection time with the environment (VDC) is not long enough.
If the cluster resources are too abundant and the load on the physical machine is low, the module may show an empty page.
Device Monitoring
VMs
- This page contains information about the overall status of the VM, such as VM ID, Marked as High-Priority VM, Connection Status, Username, VM Name, CPU, Memory, etc.
In the upper right corner, you can click Export to export the list locally.

- Select/deselect allows you to mark/unmark important VMs, making it easy for administrators to prioritize their environments.


If you feel confused about using the platform for the first time, in addition to the user manual, you can also click the Help Center in the upper left corner to read the guidance on using the platform.

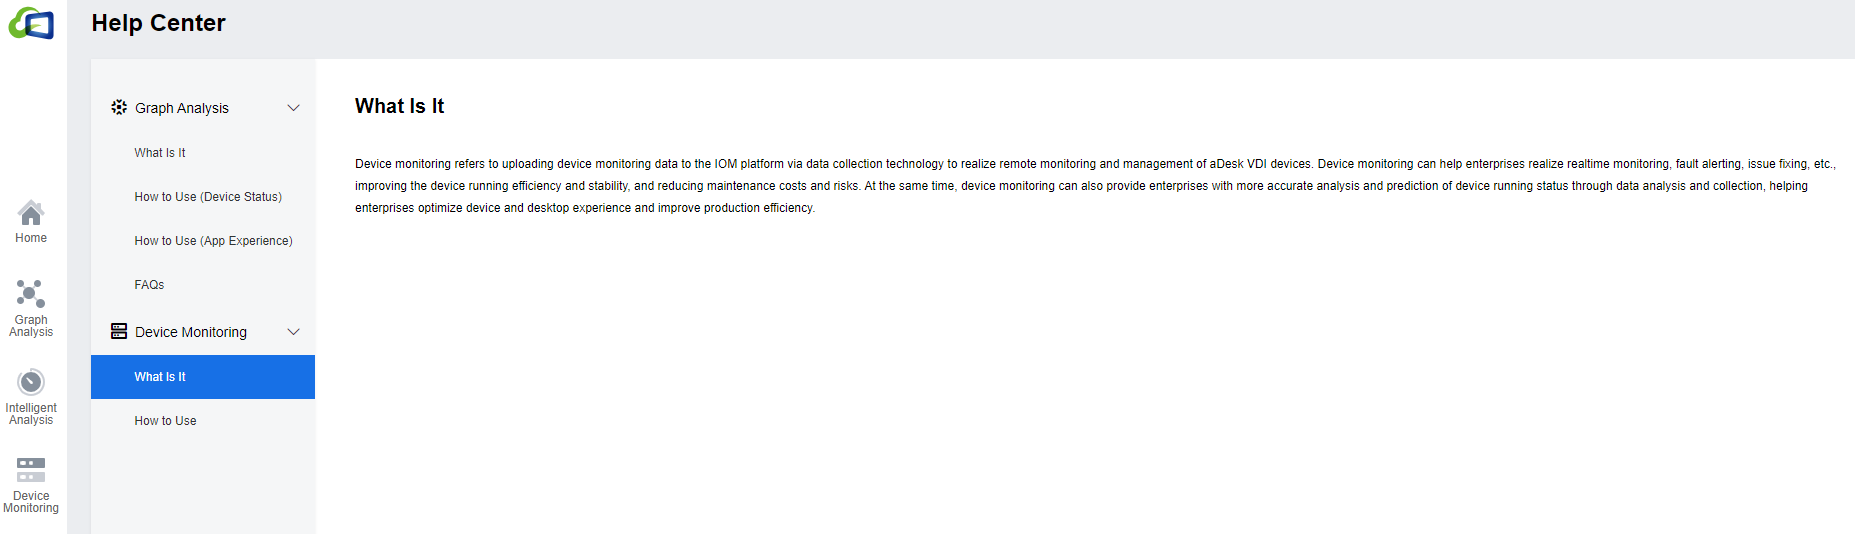
Note: You can find the Help Center icon beside the module title if the particular module has a guide within the platform.
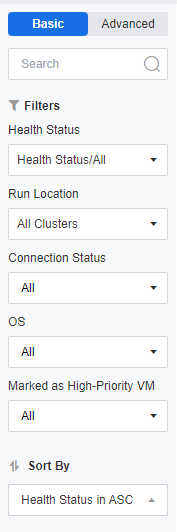
The left sidebar has two viewing modes, Basic and Advanced. In Basic, you can filter the overall VMs by Health Status, Run Location, Connection Status, OS, Marked as High-Priority VM, and you can also search for VMs by keywords and fuzzy search is supported.
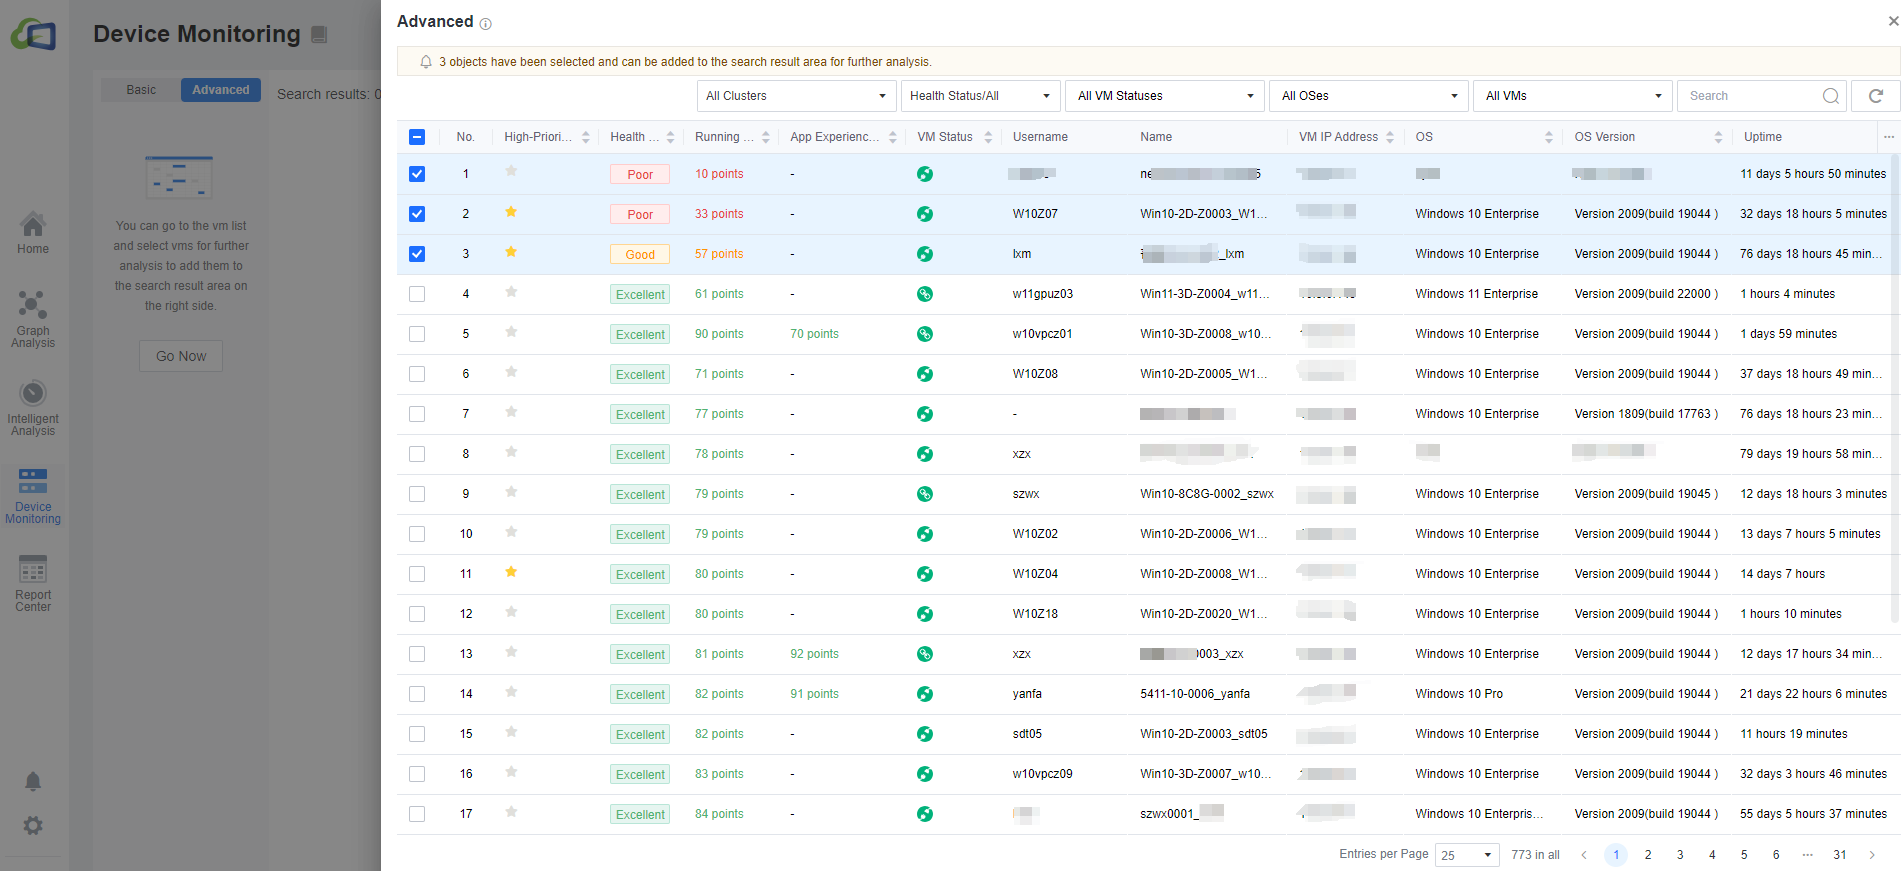
Under Advanced, we can check the virtual machines you need to analyze in the list of virtual machines and click Analyze to add these machines to a new list.
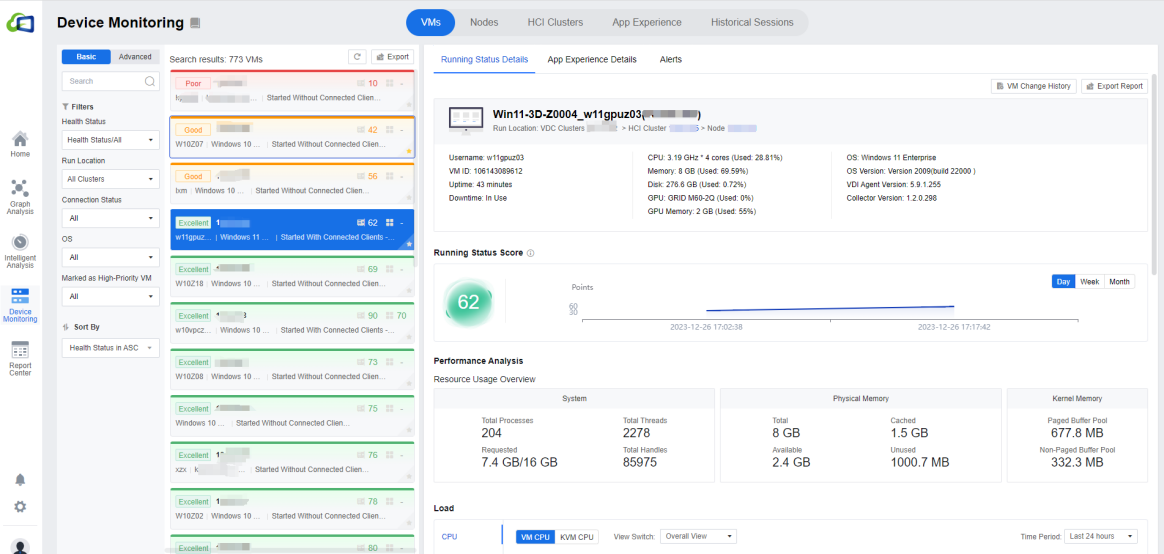
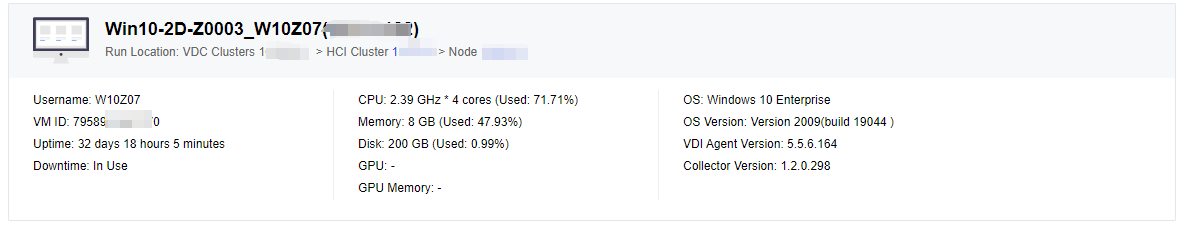
After selecting a VM, the status bar on the right shows that each virtual machine has corresponding Running Status Details, App Experience Details, and Alerts. In Running Status Details, you can see specific information about the virtual machine, including login username, VM ID, CPU, memory, graphics memory, hard disk size, OS, OS version, VDI agent version, etc.
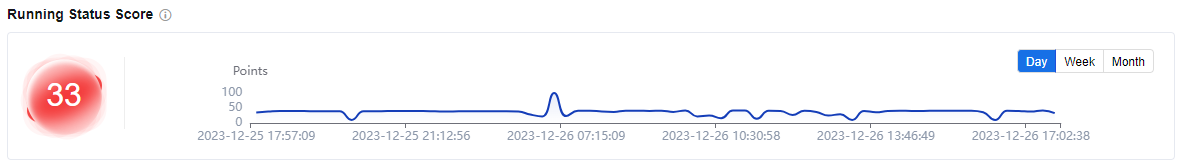
In Running Status Score, you can see the details of the running status score of this virtual machine according to the Day/Week/Month. The lower the score, the greater the possibility of slow running. Please pay attention to high-load and low-score VMs requiring capacity expansion or app optimization.
Note: Due to the performance impact, the collection policy uses different collection cycles for different metrics, so there is a delay of 1-5 minutes for real-time data and about 1 hour for static data. It is recommended to wait about 1 hour for all data to stabilize if startup or shutdown the VM.
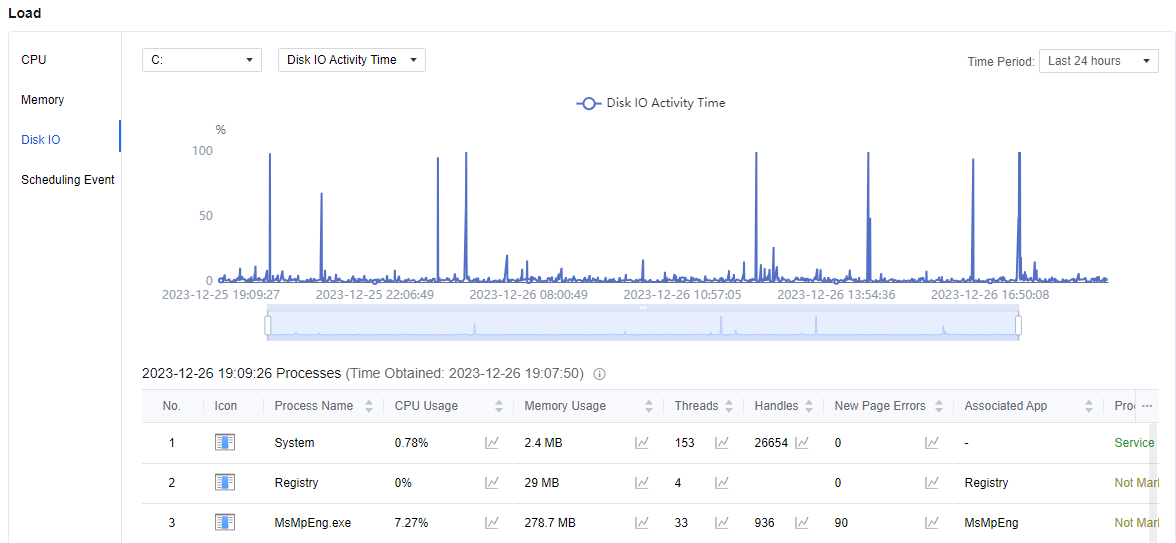
At Performance Analysis and Load, we can see some specific resource usage of this virtual machine, and the administrator can also analyze the virtual machine based on this particular information. The maximum time period is 24 hours. Mouse over and scroll to zoom in and out of the line graph for a detailed view.
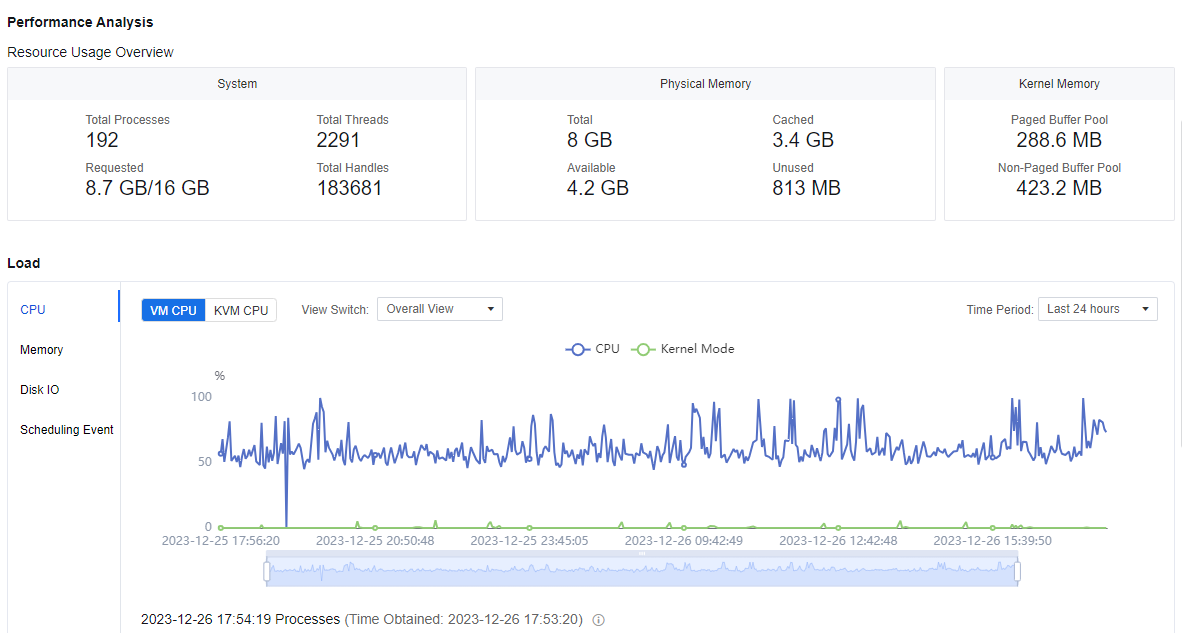
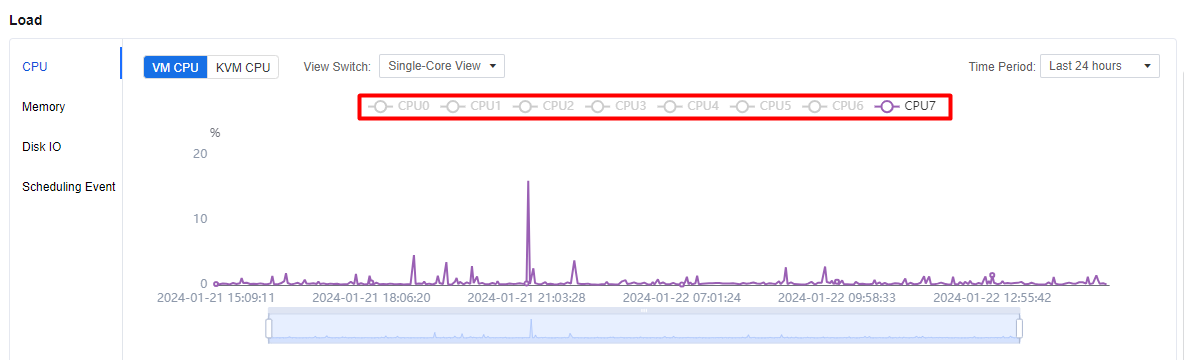
Under Load > CPU, you can view both the VM CPU and KVM CPU. You can switch the Overall View / Single-Core View for the VM CPU. If you only want to see one core in the single-core view, you can hide it by clicking on the CPU that you do not want to see.
Under Load > Memory, you can view this virtual machine’s Physical Memory and Kernel Memory. In the Processes list below the chart, you can see the memory used by all the processes in the virtual machine, such as CPU Usage, Threads, Handles, Page errors, Associated App, Read and Write times, Read and Write speed, etc.
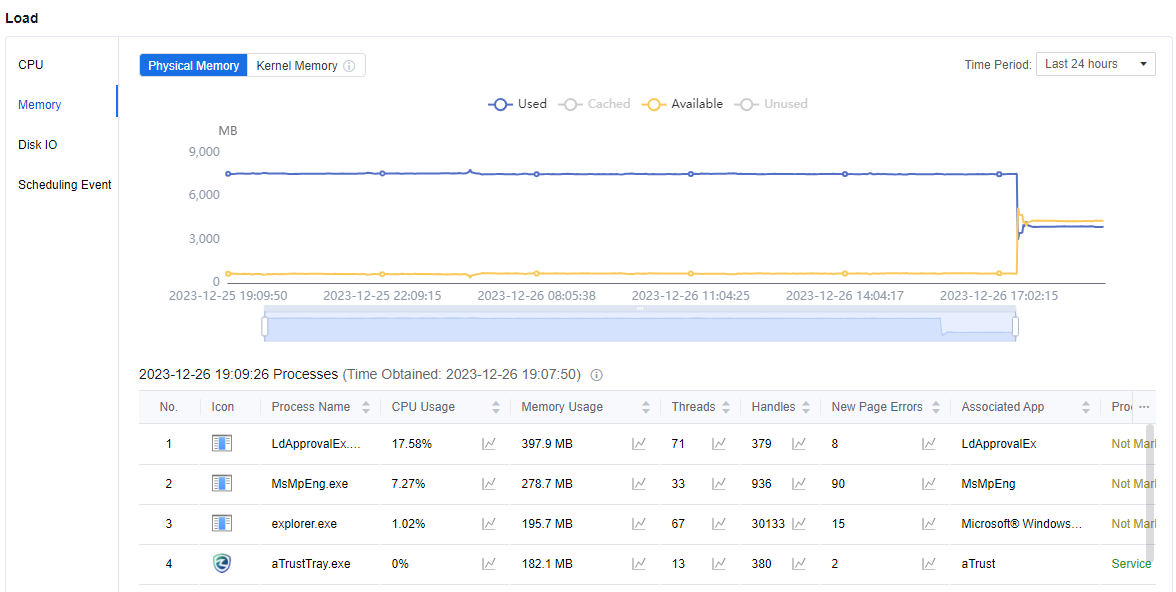
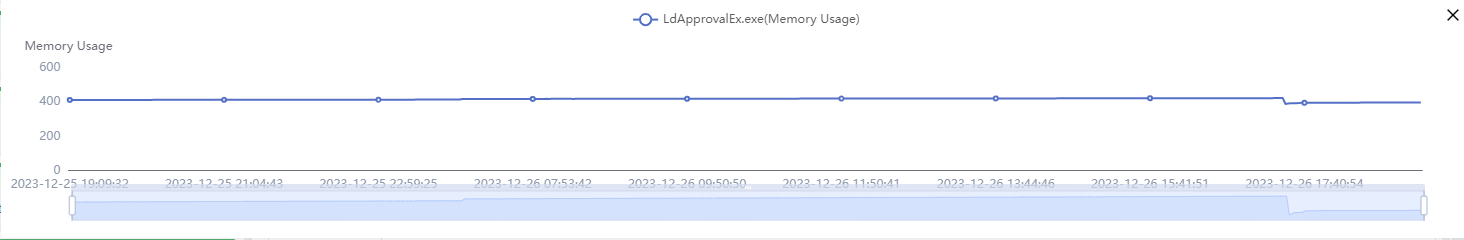
- To the right of each valid parameter, there is a small line graph icon. Click the corresponding line graph to expand the view of a particular data line graph table.

Note: Kernel memory: Memory occupied by system processes and the system kernel.
The Load > Disk IO view allows you to see the reads and writes of each disk within the virtual machine, and you can switch the data source. There is a small line graph icon to the right of each process. Click on it to expand the view of a particular data line graph table.

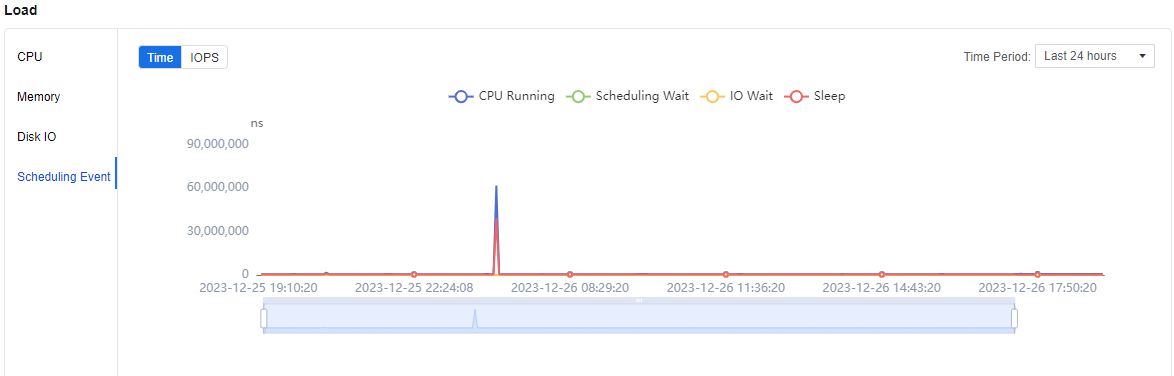
Under the Load > Scheduling Event view, you can see the various types of scheduling wait times within the virtual machine. If the virtual machine has an unknown lag at some point, you can use this module to see if the time is too long and causing the lag.
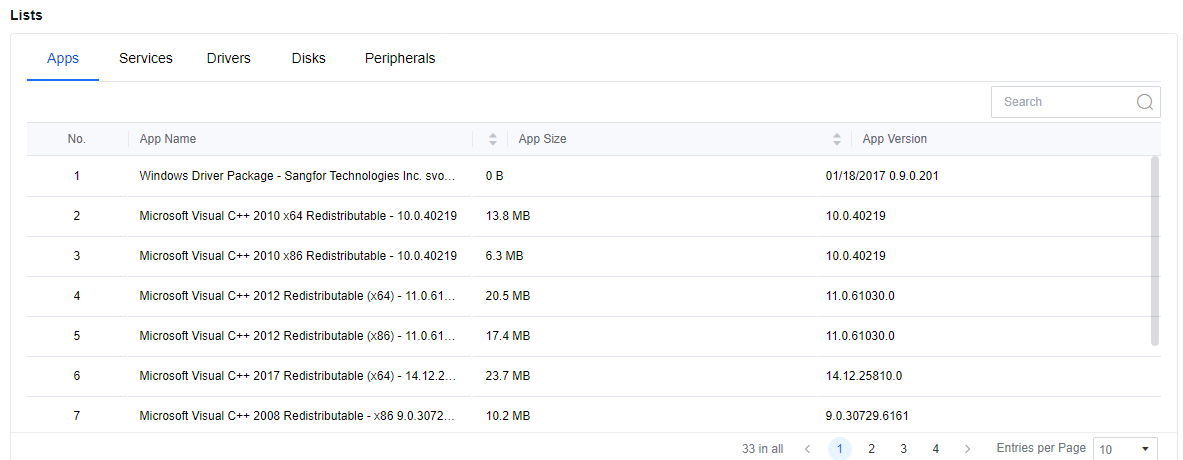
In the Lists > Apps, we can see the overall apps installed in the VM and show the size and version of the apps.
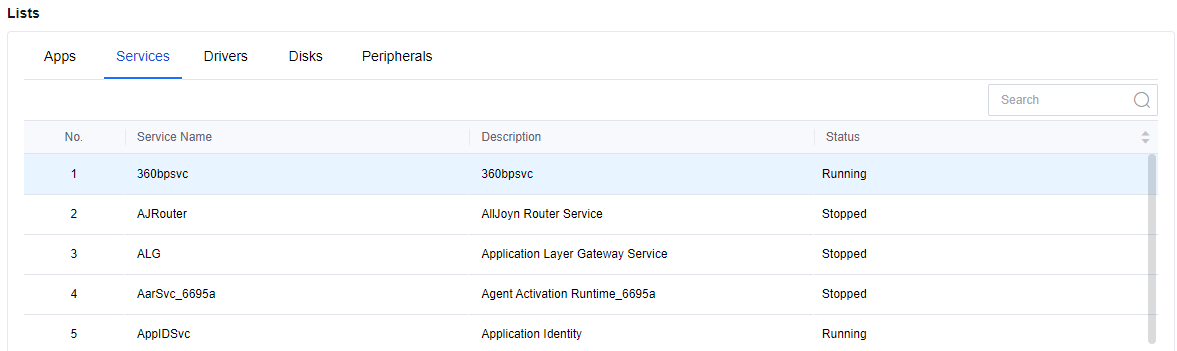
In the Lists > Services, you can see all the services and their status in the virtual machine.
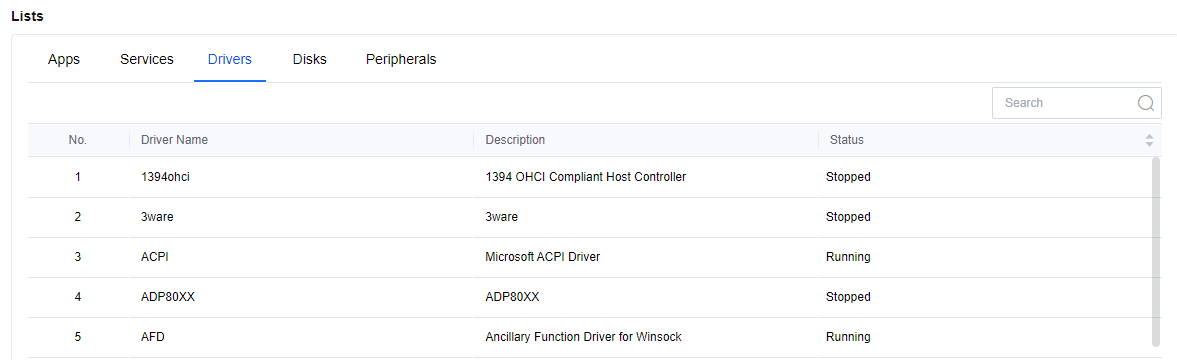
In the Lists > Drivers, you can see the virtual machine’s current installed driver and status.
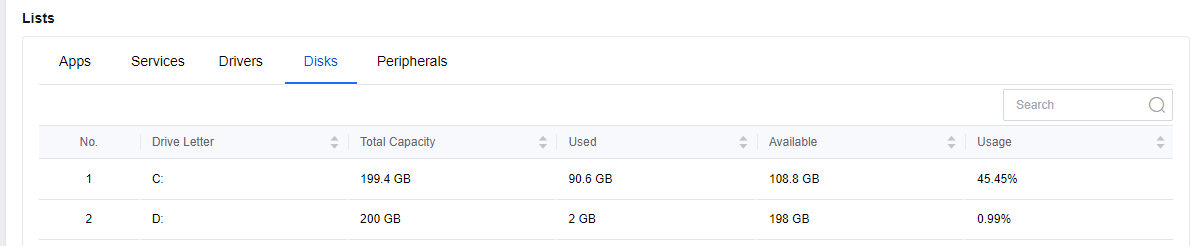
In Lists > Disks, you can see the hard disk usage, including the total capacity, usage, remaining space, and percentage of utilization for each hard disk.
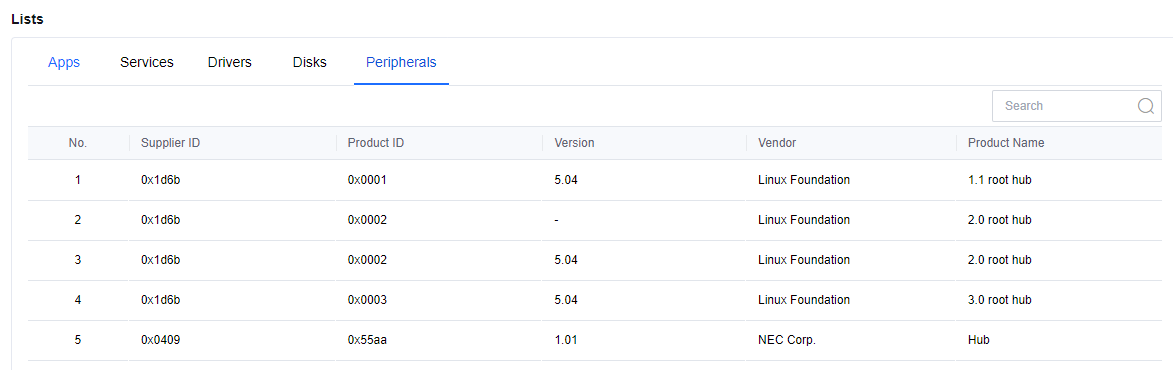
- In Lists > Peripherals, you can view the peripherals currently used in this virtual machine, including the Supplier ID(Vendor ID), Product ID, Version, Vendor, and Product name.
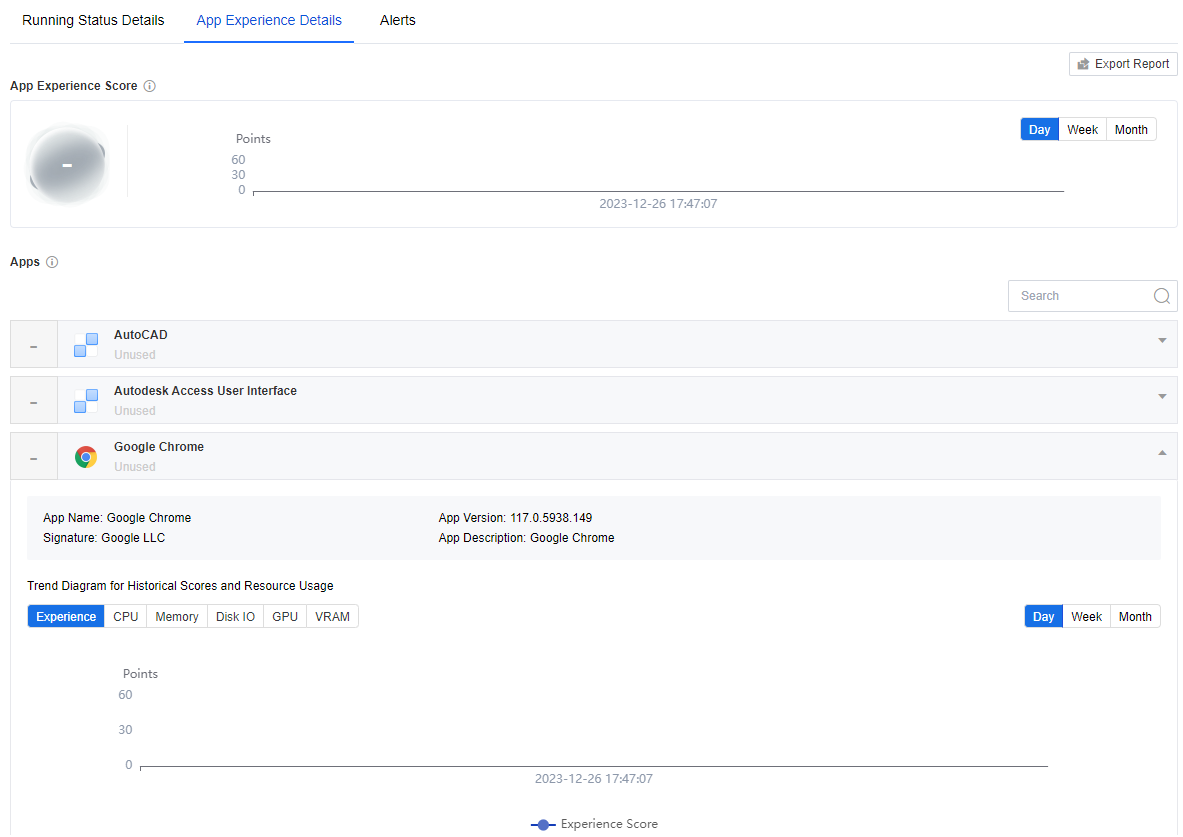
App Experience Details lists the applications running on the VM in the current environment and rates individual app. The interface also supports querying each application’s historical rating and resource utilization graphs.
On the Alerts page, you can see all the current alerts for the virtual machine, which are sorted by default according to the severity level. The three severity levels are Critical, Major, and Info.
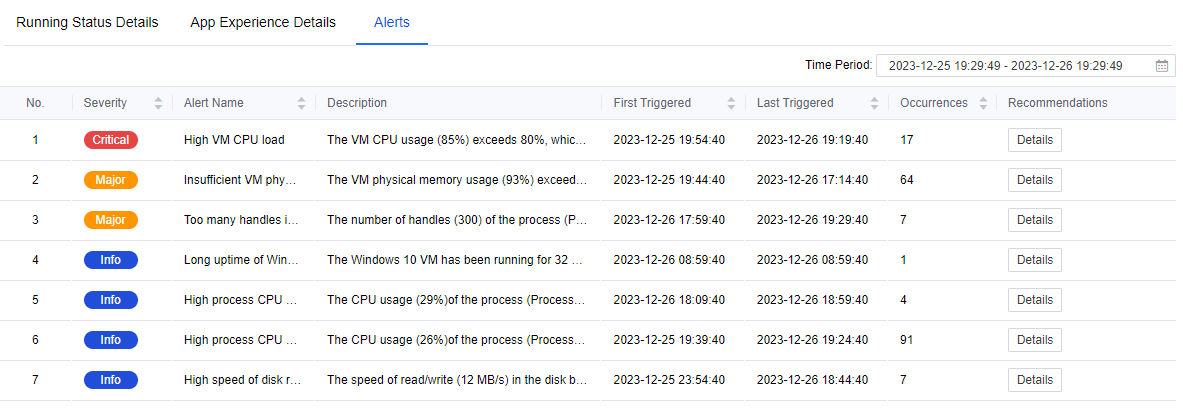
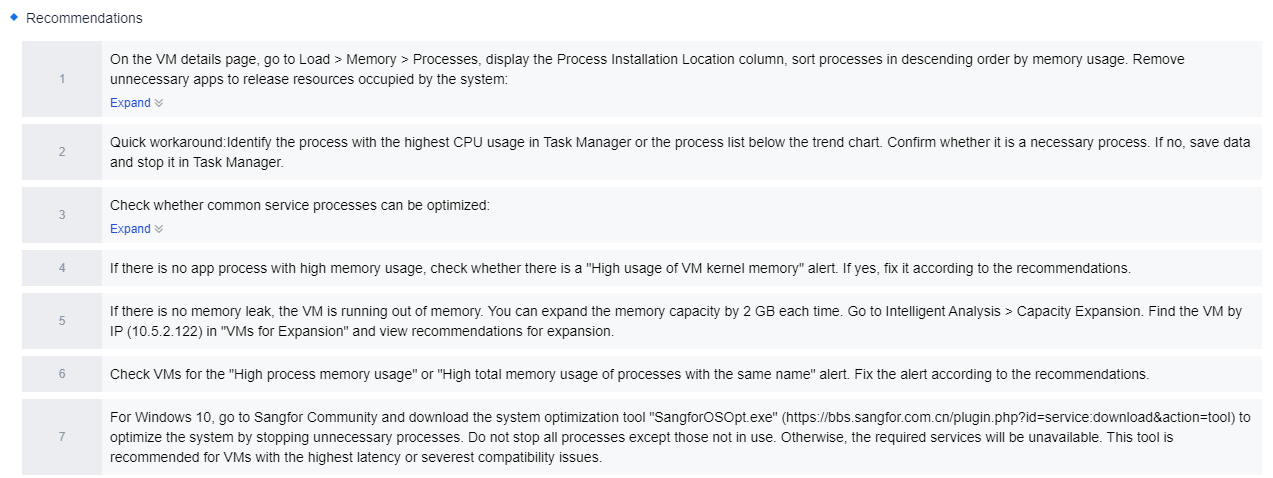
Click Details under Recommendations, and you can view the detailed description of the alert.
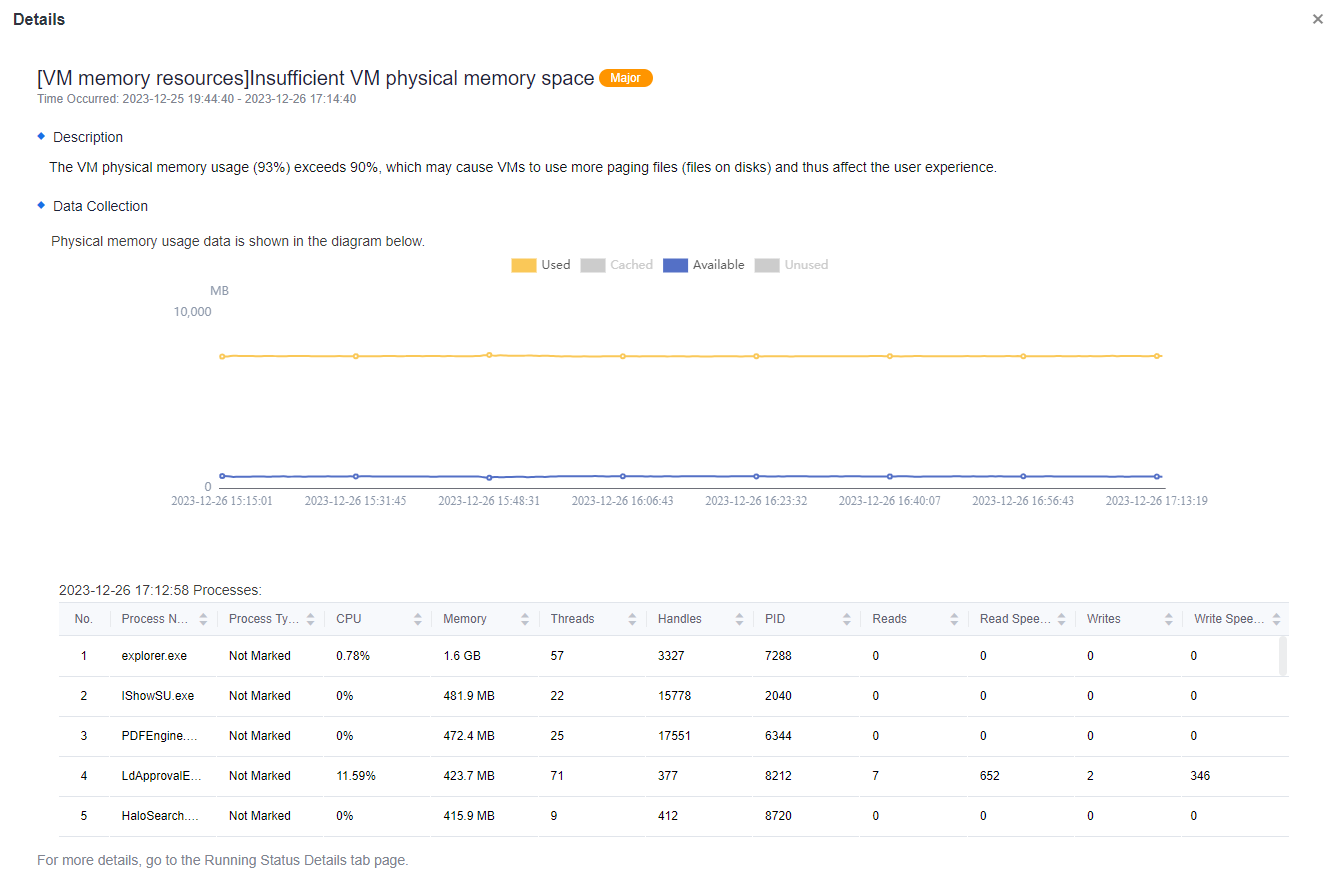
- Scroll down the page to see the recommendations IOM gave based on the AI intelligent algorithm for this alert and the actual environment. Each step has corresponding steps to process, so the administrator can operate step by step according to IOM’s recommendations to solve the problem.
Note: If there is missing data, please check whether the node and VM times are correct.
The data on this page can be queried for up to one month.
Nodes
The Nodes page contains the overall status information of the node, including the node IP, the HCI cluster it belongs to, the number of powered-on connected/not connected VMs, the total server memory, the size and usage of the data disk, the size of the cache disk, the cache ratio, the CPU overcommitment ratio, the CPU model and the details of CPU configurations, the RAID card, the Graphics card, the NIC, etc. Like the virtual machine status interface, the node status also supports viewing in Basic or Advanced mode.
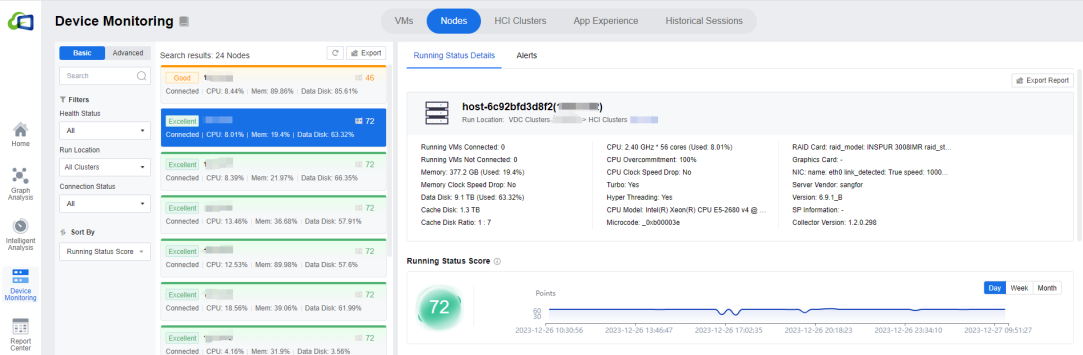
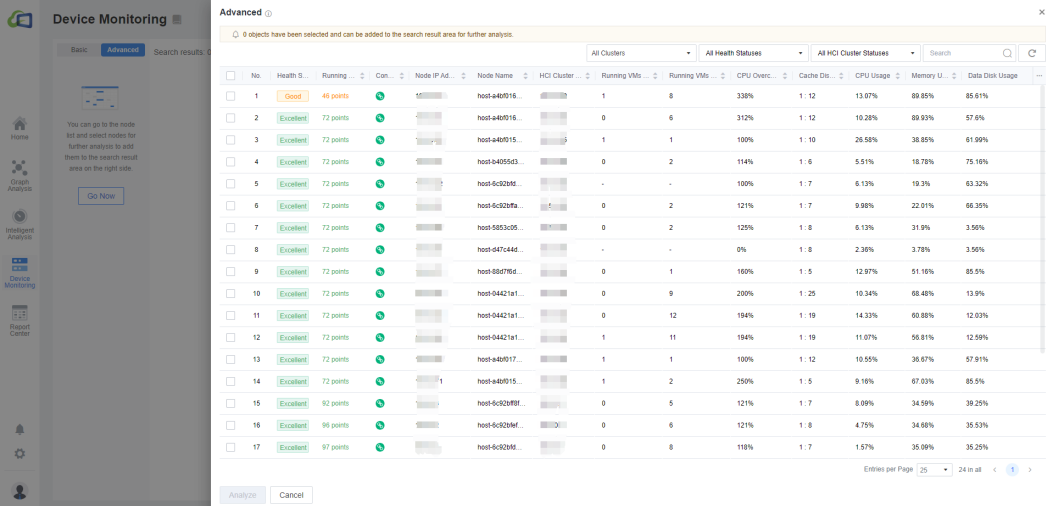
In the Alerts page, you can see the optimization items for this node/cluster with the time and number of triggers.
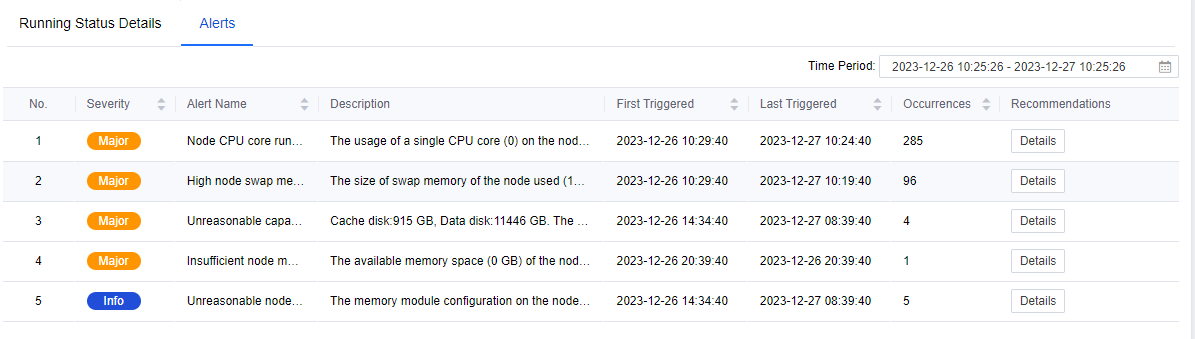
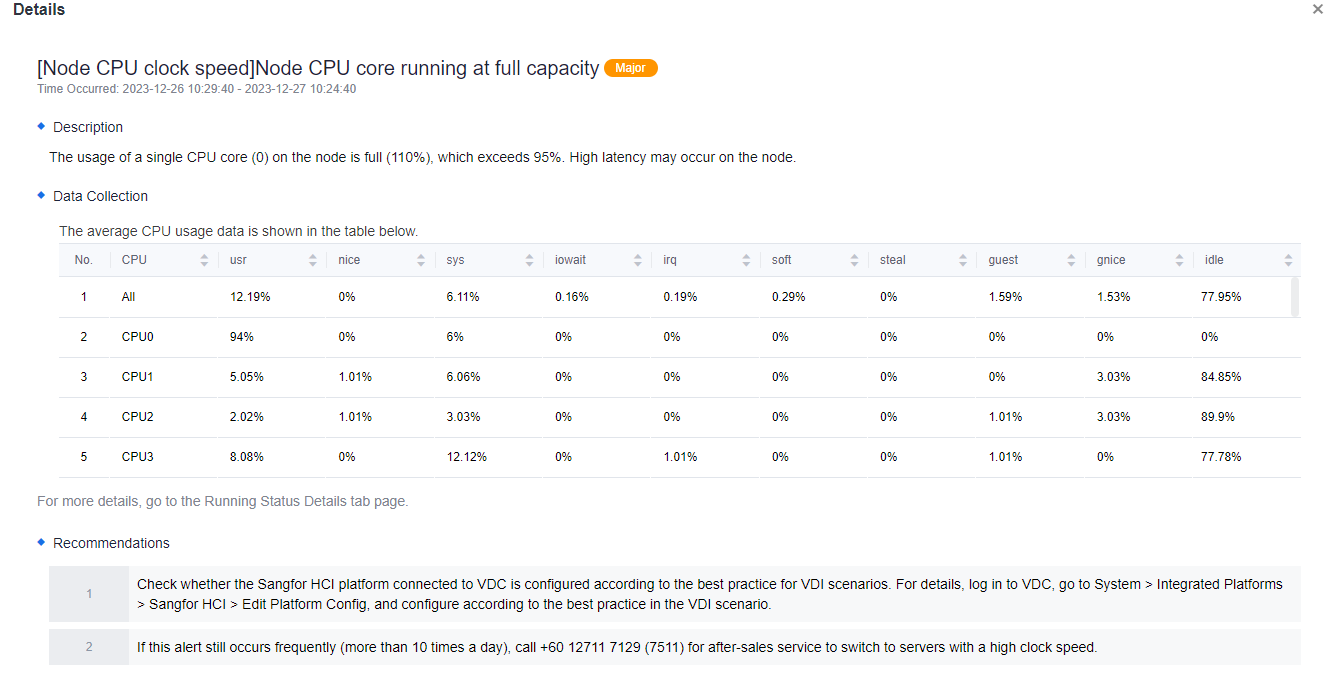
After clicking on the Details, the specific Description, Data Collection, and Recommendations for the issue will be shown.
HCI Clusters
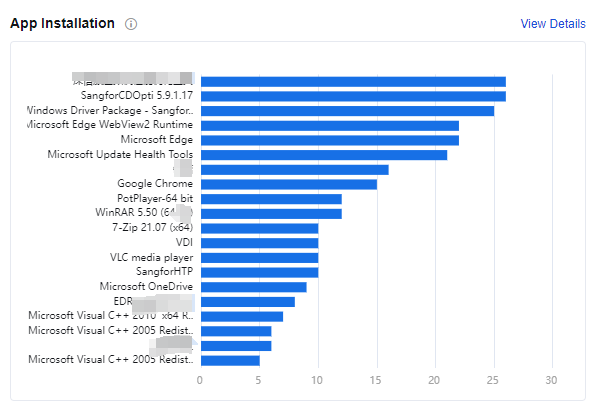
- This page contains information about the status of the HCI cluster as a whole, including the number of nodes, the number of VMs, the storage space of the cluster as a whole, the number of Running VMs Connected/ Not Connected, the total memory of the servers, the installation of applications in the cluster, and the running status scores.
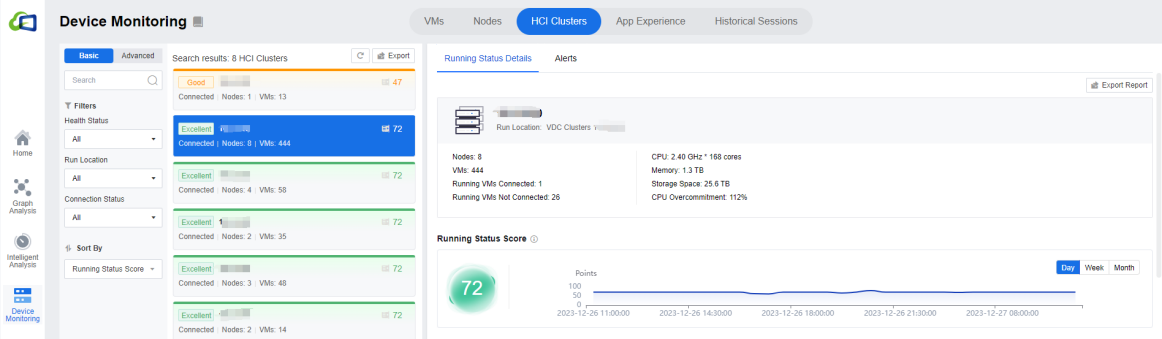
This interface has an App Installation module, which provides statistics on the app installation in the entire cluster, making it convenient for administrators.
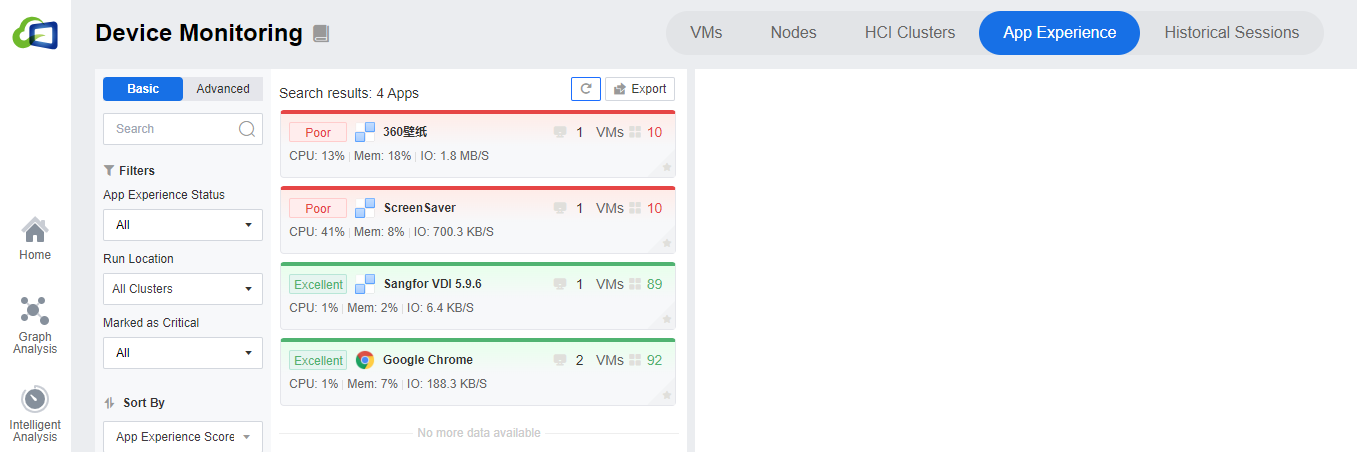
App Experience
In the App Experience interface, we can view the application’s specific use in the virtual machine, including the average Disk IO Throughput, Average CPU Usage, Average Memory Usage, App Experience Score, and specific virtual machine distribution. Through this module, you can quickly see which application in the overall environment is poor, and you can perform specific operations and optimization according to the actual situation.
Historical Sessions
- On this page, the administrator can view the user access status of the overall environment. The administrator can view the username, the user access status, the user group to which the user belongs, the Endpoint type, the Endpoint IP address, the Endpoint MAC address, the Endpoint SN, the session start time, the session end time, the session duration, the login result, and the Resource Access Count.
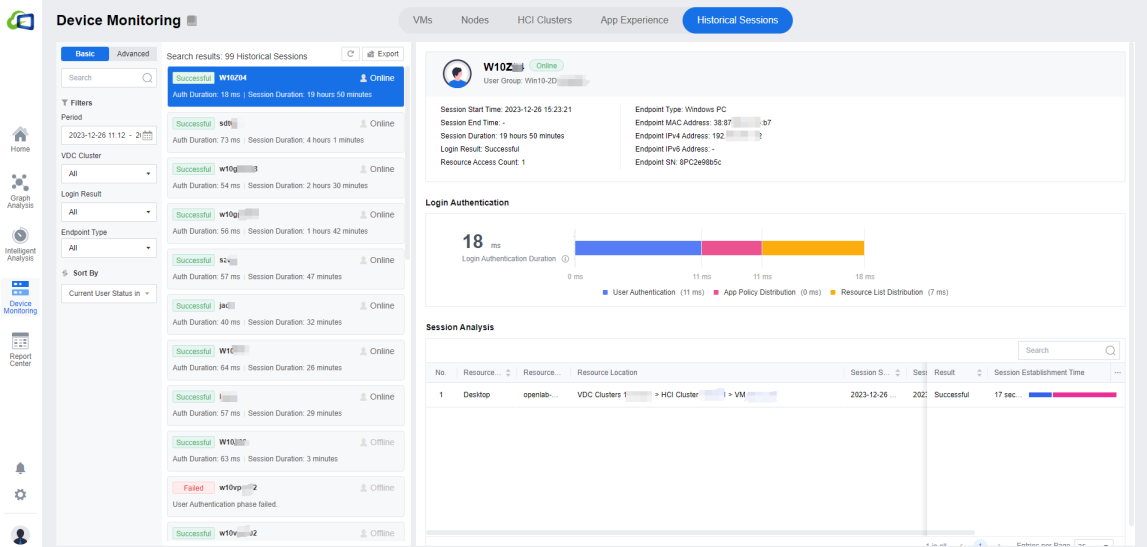
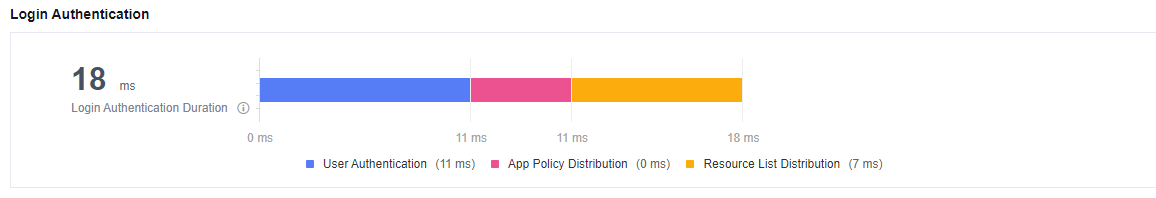
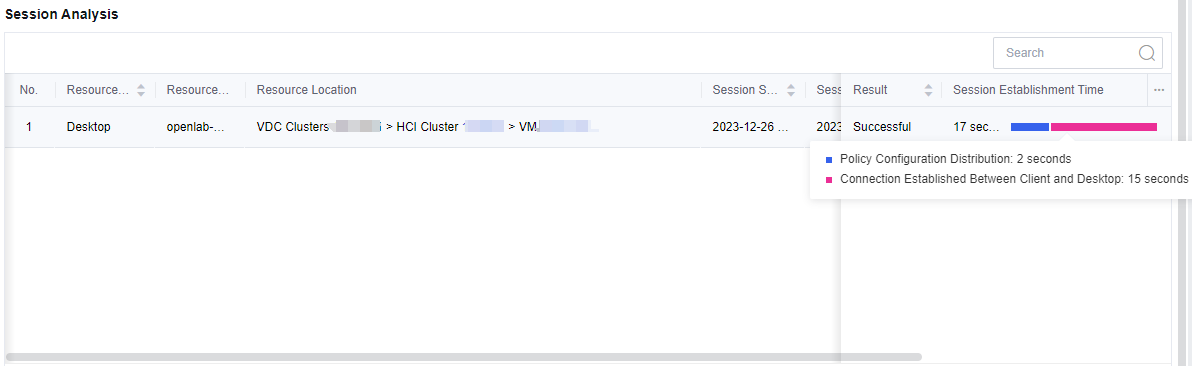
In Login Authentication, the authentication phase is divided into three parts: User Authentication, App Policy Distribution, and Resource List Distribution. There is a corresponding legend at the bottom. The time consumed in each phase is listed beside the phase.
- In Session Analysis, you can see the overall login process. The user’s login journey to the desktop can also be viewed in Session Establishment Time. Similarly, the session establishment process is also divided into Policy Configuration Distribution and Connection Established Between Client and Desktop. It is convenient for administrators to check users’ overall login time and count the session start and end times. A record will be logged every time a user establishes a session.
Report Center
IOM Reporting Center can help administrators summarize the use of the overall desktop environment. You can understand the use of each desktop through specific statistics and quickly locate the desktop’s activeness. Secondly, the application statistics can reflect the application usage, making it easier for the administrator to manage the applications. You can set different statistical policies for different scenarios.
The Reporting Center has two major modules, Desktop Usage and App Usage.
Note: After the IOM is integrated into the VDC, it is necessary to set the policy immediately in the Report Center > Statistics Policies. Otherwise, there will be no data in the desktop usage module.
Reporting center data needs to be collected and will not be available on deployment day. Please check back at least 24 hours after the policy has been set up.
The maximum query period for the report center is 31 days.
Due to the need to collect and organize data, the same-day data in the report center will not be shown. You can only view the previous day’s data.
Desktop Usage
Desktop Usage will count desktop access time, active time, idle time, and time not defined in the statistics policy according to the VMs selected in the policy group. Therefore, you need to set up the statistics policy in advance.
Desktop Statistics Templates
Report Center Policy has two modules: Statistics Policies and Desktop Statistics Templates. Statistics policies need to be associated with statistics templates, so it is recommended that you configure statistics templates in advance.
IOM2.0 has six default built-in statistics templates: Template for Development, Template for Testing, Template for Office Scenarios, Template for Interaction and Visual Design, Template for 3D design, and Compact Desktop Statistics Template. You can edit the built-in templates but not delete them.
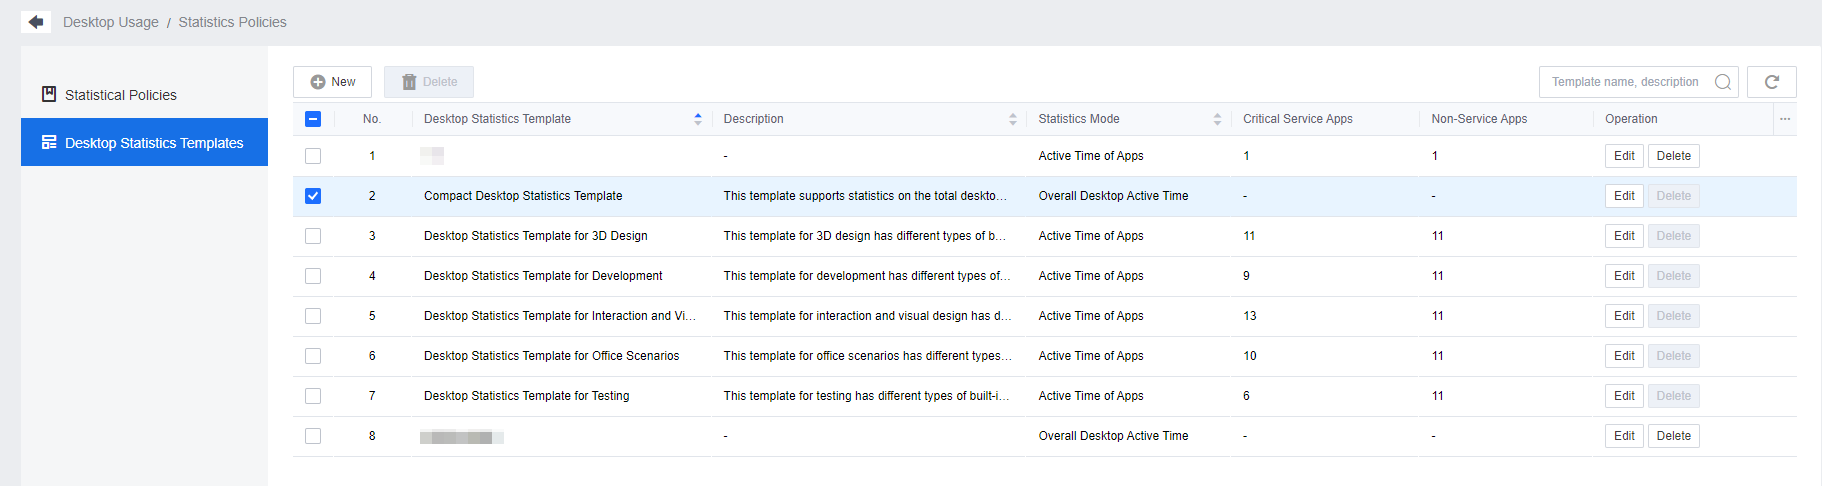
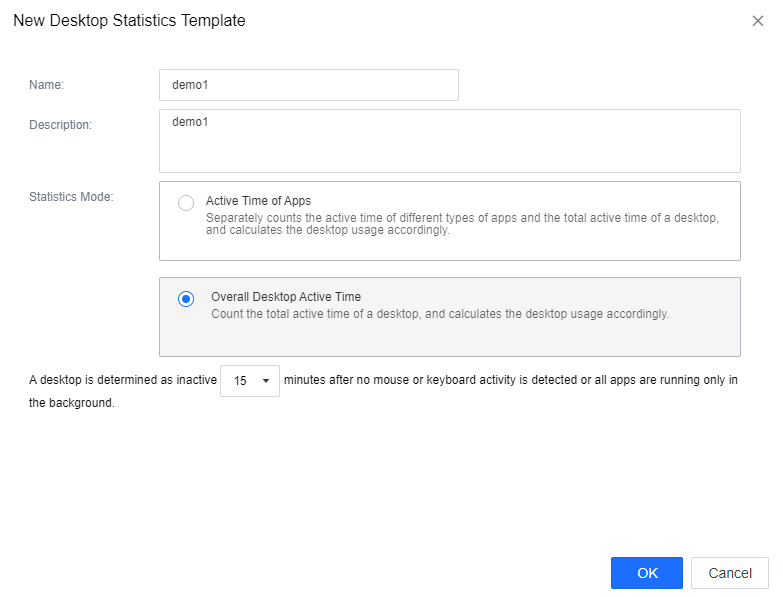
Administrators can modify the content of the policy template or add a new policy by clicking the New button in the upper left corner. When editing the desktop statistics template, enter the policy Name and Description and choose the desktop Statistics Mode. There are two types of statistics: Active Time of Apps and Overall Desktop Active Time.
Active Time of Apps can be calculated based on application usage, and applications can be categorized into Critical Service Apps and Non-Service Apps, with a maximum of 20 applications defined per policy support. Those that are not within these two ranges are categorized as General Apps. After the setup, you can set the interval between mouse and keyboard inactivity to recognize the active status. The interval time can be defined as 15 or 30 minutes.
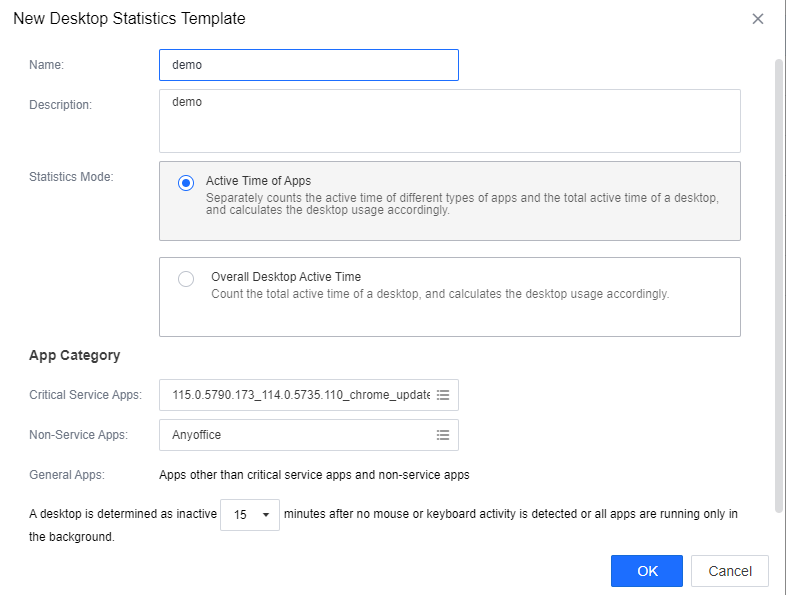
For Overall Desktop Active Time, there is no need to add applications; only define the desktop inactive time interval. Click OK to save the settings.
Statistics Policies
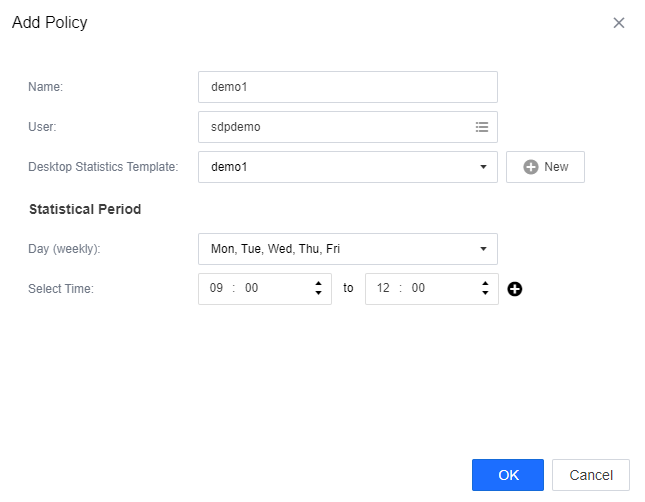
After making a good statistics template, you can go to Statistics Policies to add and set up policies.
Click New, fill in the name, and select the user that needs to be included in the policy. You can select all users in a user group and select users from different clusters or user groups.
After selecting the users, select the statistics template created in Chapter 3.6.1.1 and associate the policy. Finally, set the Statistical Period. Set the day and time (in hours) according to your needs. You can set a maximum of 10 statistical periods in one policy.
Desktop Usage
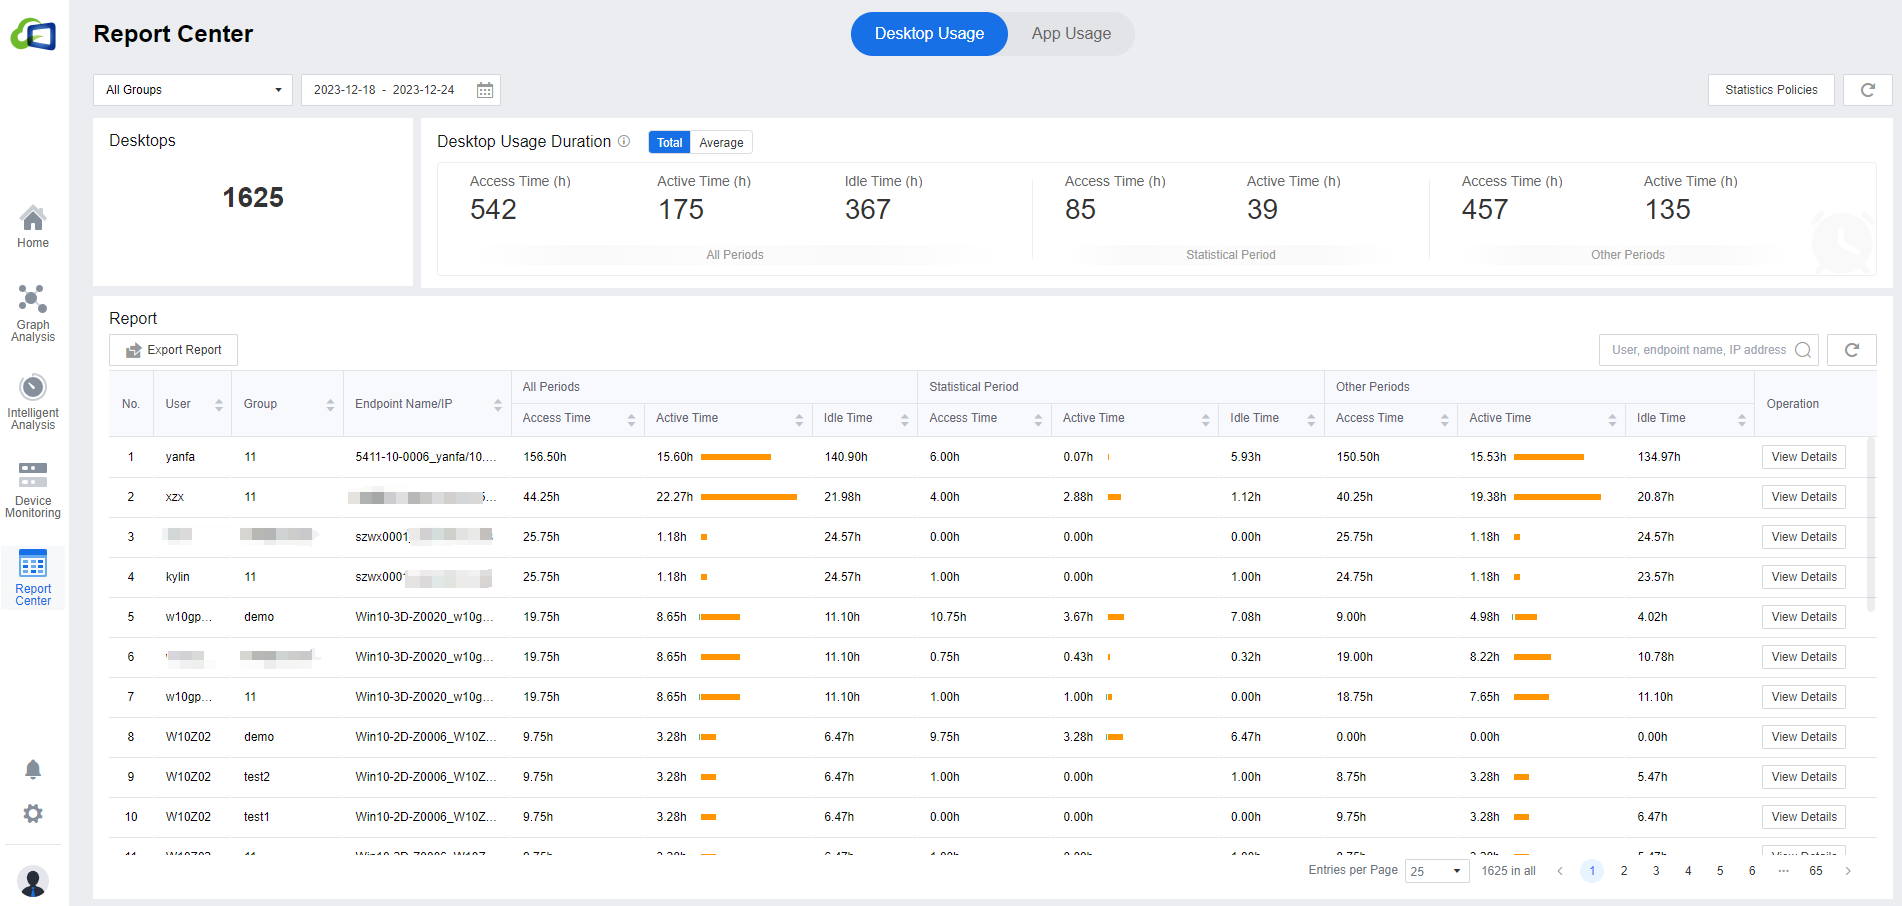
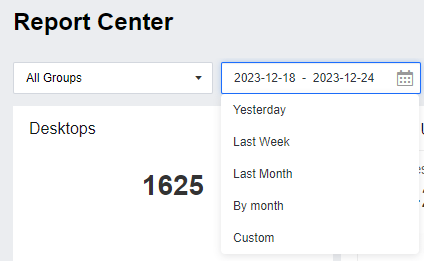
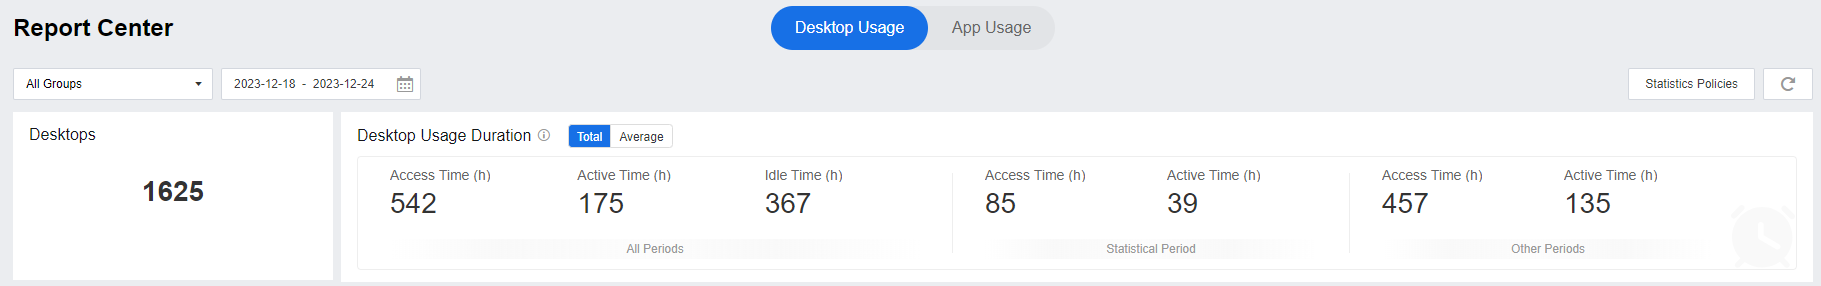
The Report Center > Desktop Usage page shows the statistics according to the policy. You can select the preferred policy by clicking All Group in the upper left corner if there is more than one policy. The Desktop Usage page will show all policy group statistics by default. You can select the time on the right; the default time is Last Week. You can select Yesterday, Last Week, Last Month, By Month, or Custom according to your needs, and the maximum time length is 31 days.
The number of Desktops shows the total number of desktops associated with the users selected in the policy. The Desktop Usage Duration is the result of combining the mouse and keyboard activities with the defined periods in the policy. The desktop usage time module is divided into three parts: the first part is the All Periods, which refers to the Access Time,Active Time, and Idle Time of all periods within the selected time. The second part is the Statistical Period, which is according to the time set by the policy to count the access time and active time. The third part is Other Periods, the access time and active time not defined in the policy.
In Report Center > Report, you can see each user’s specific access time, active time, and idle time. It will also show the info of the User, Group, and Endpoint Name/IP. If necessary, you can click Export Report to export the report. The search bar on the right can search the data list, and it supports fuzzy search.

User Usage(not a default function)
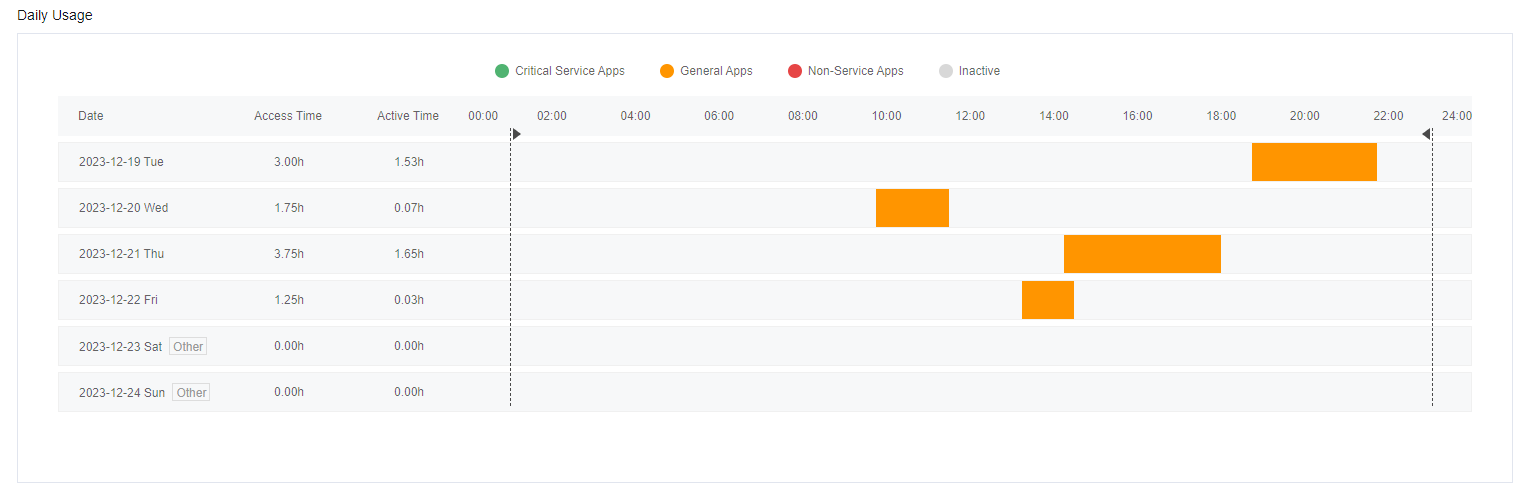
In the user data within the Report, you can click View Details to see the specific desktop usage of the user. In addition to some of the report interface statistics, you can also see the statistics based on the user’s application usage. In the policy template, we have set up the Critical Service Apps and Non-Service Apps, and you can view the use time and percentage in the Daily Usage.
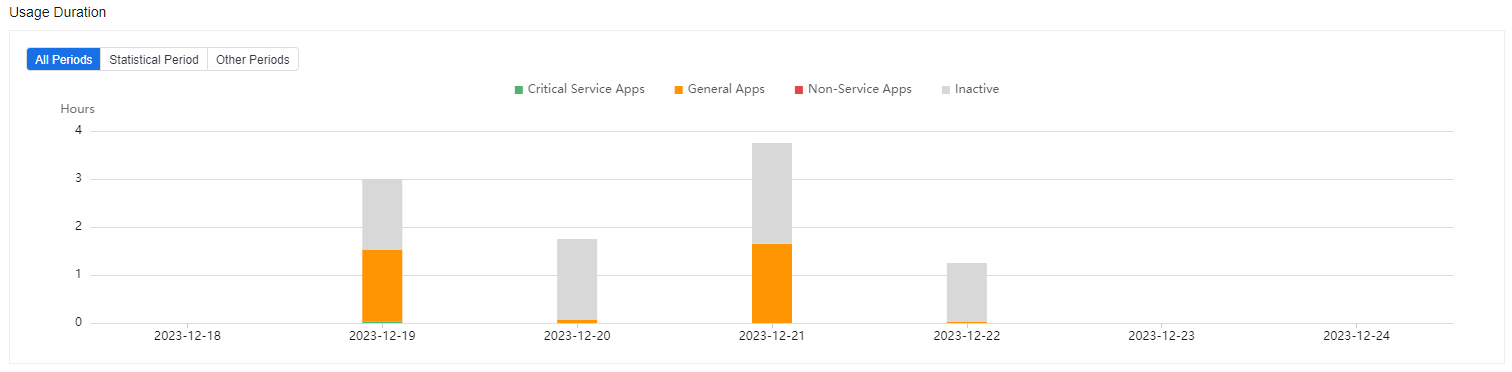
In Daily Usage, the report center shows the app usage every hour. The area between the dashed lines within the chart is the defined statistics time in the policy. Critical Service Apps, General Apps, Non-Service Apps, and Inactive are set for the policy template.
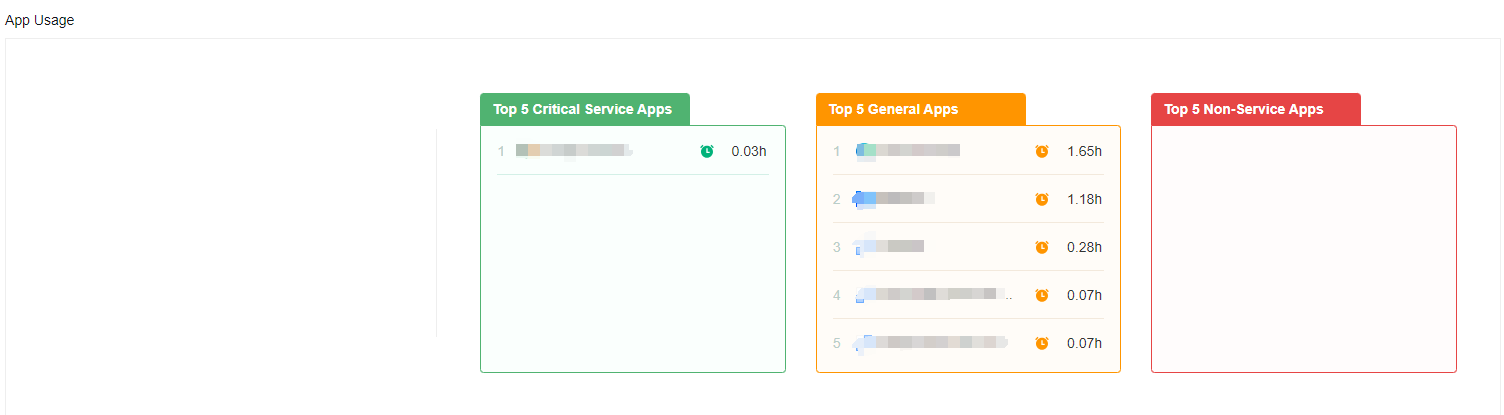
The App Usage shows the specific applications and times of the Top 5 Critical Service Apps, Top 5 General Apps, and Top 5 Non-Service Apps.

If this module is required, please contact Technical Support.
If the policy does not clearly define the parameters, it may lead to an inaccurate report. Please check the parameters carefully when setting up the policy template.
App Usage
This module will sort each application’s Total Usage Duration and Accumulated Uses. Administrators can understand which applications belong to the high-usage and low-usage categories in the desktop cloud environment. It is also convenient for administrators to know what unauthorized app has been used in the environment to avoid unnecessary legal risks.
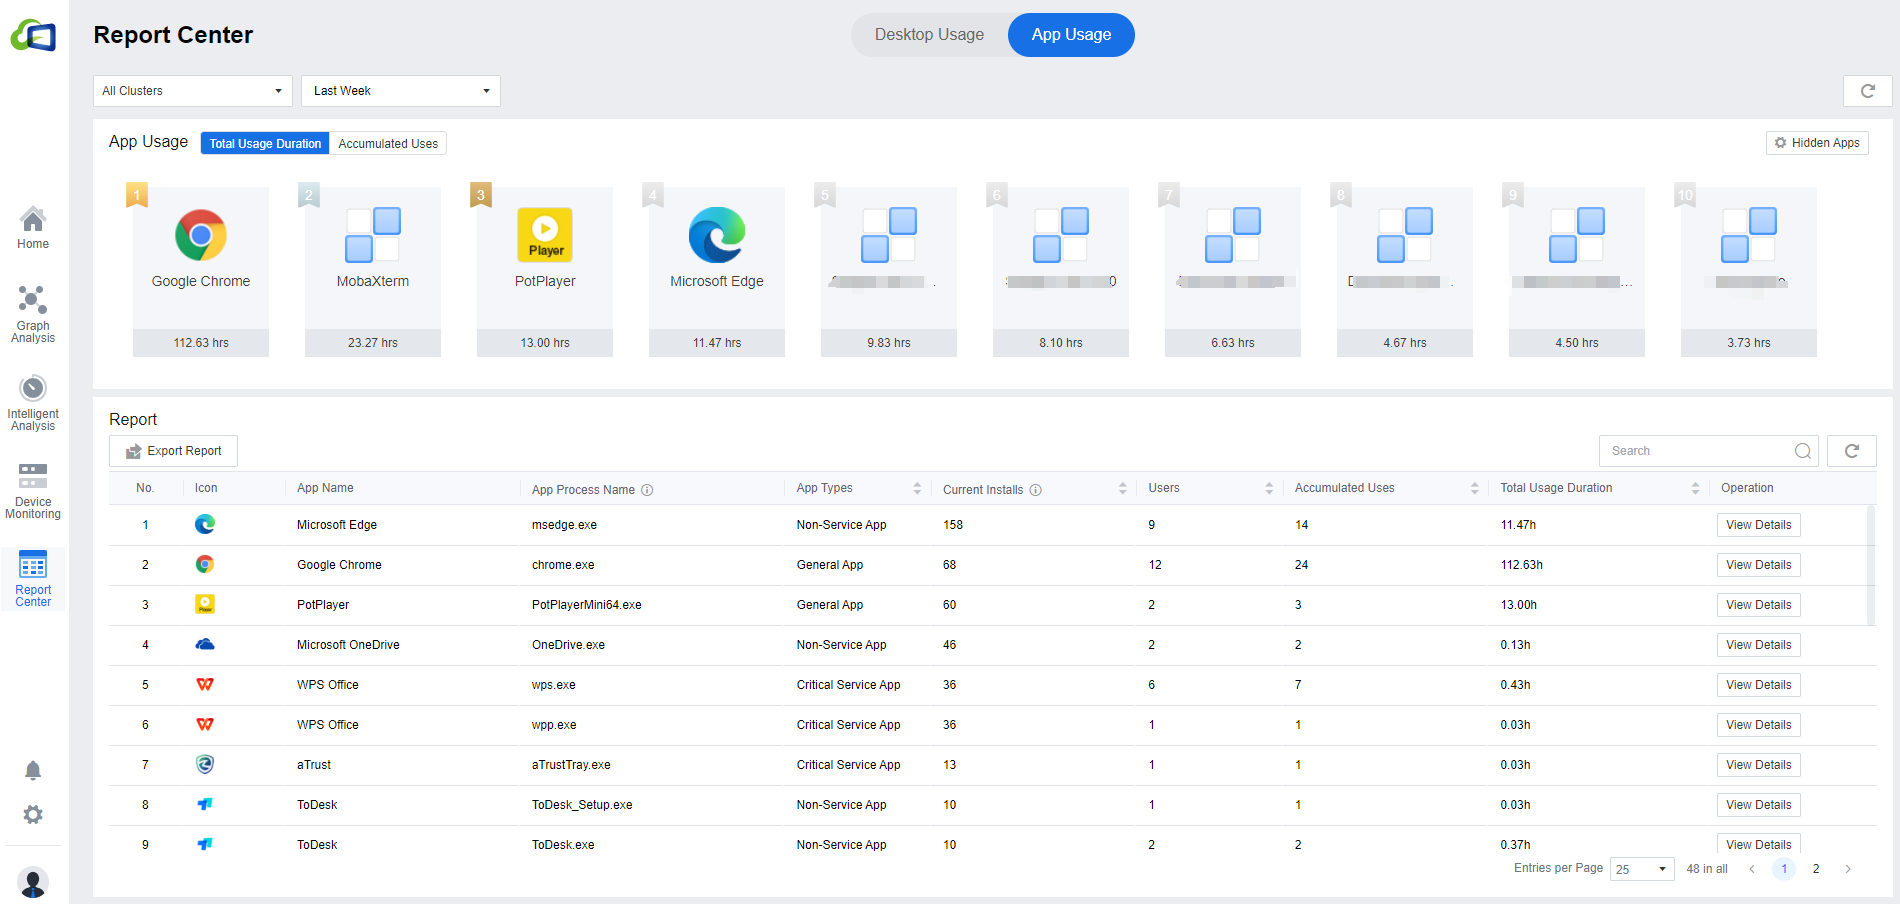
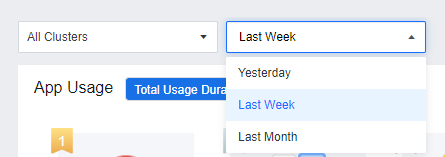
Unlike Desktop Usage, App Usage does not require policy setting. As long as the Virtual Desktop Controller is integrated, the app usage of all VMs will be collected automatically. The default display scope of the data is All Clusters. You can manually select all user groups from a VDC cluster or a specific user group in the VDC cluster. It will show last week’s data by default, and you can select to view Yesterday, Last Week, or Last Month. However, you cannot customize the data viewing time in App Usage.
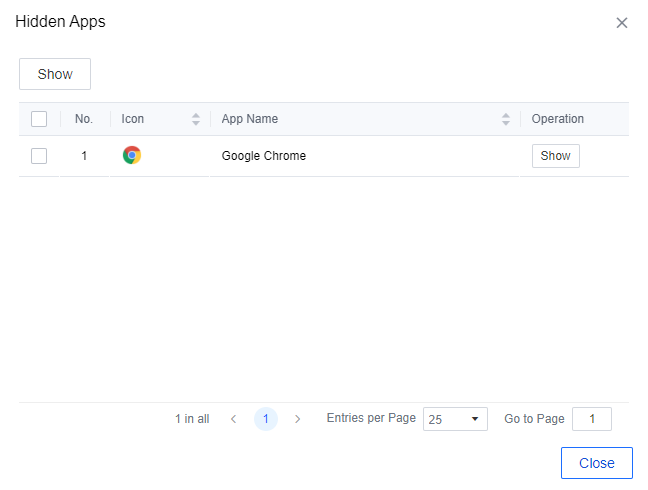
- The main section of the Application Usage will list the top 10 apps in the environment in terms of Total Usage Duration or Accumulated Uses. If there are some apps you do not want to be shown, you can click the on the particular app to hide it.


If you want to re-display the app later, please click the Hidden Apps button, select the app, and click Show.
The list in the Report shows all the apps that are in use in the environment, which can be exported as an Excel table by clicking Export Report. Suppose you need to know who is using a particular application. In that case, you can click View Details to view the details, which will list the User, User Group, VDC Cluster, VM Name, VM IP Address, Installation Status, and Total Usage Duration. Similarly, you can click Export Report to export the list locally.
System Settings
Alerts
The Alert Rule interface shows the details of all alerts configured in the current environment, including name, type, description, severity, etc.
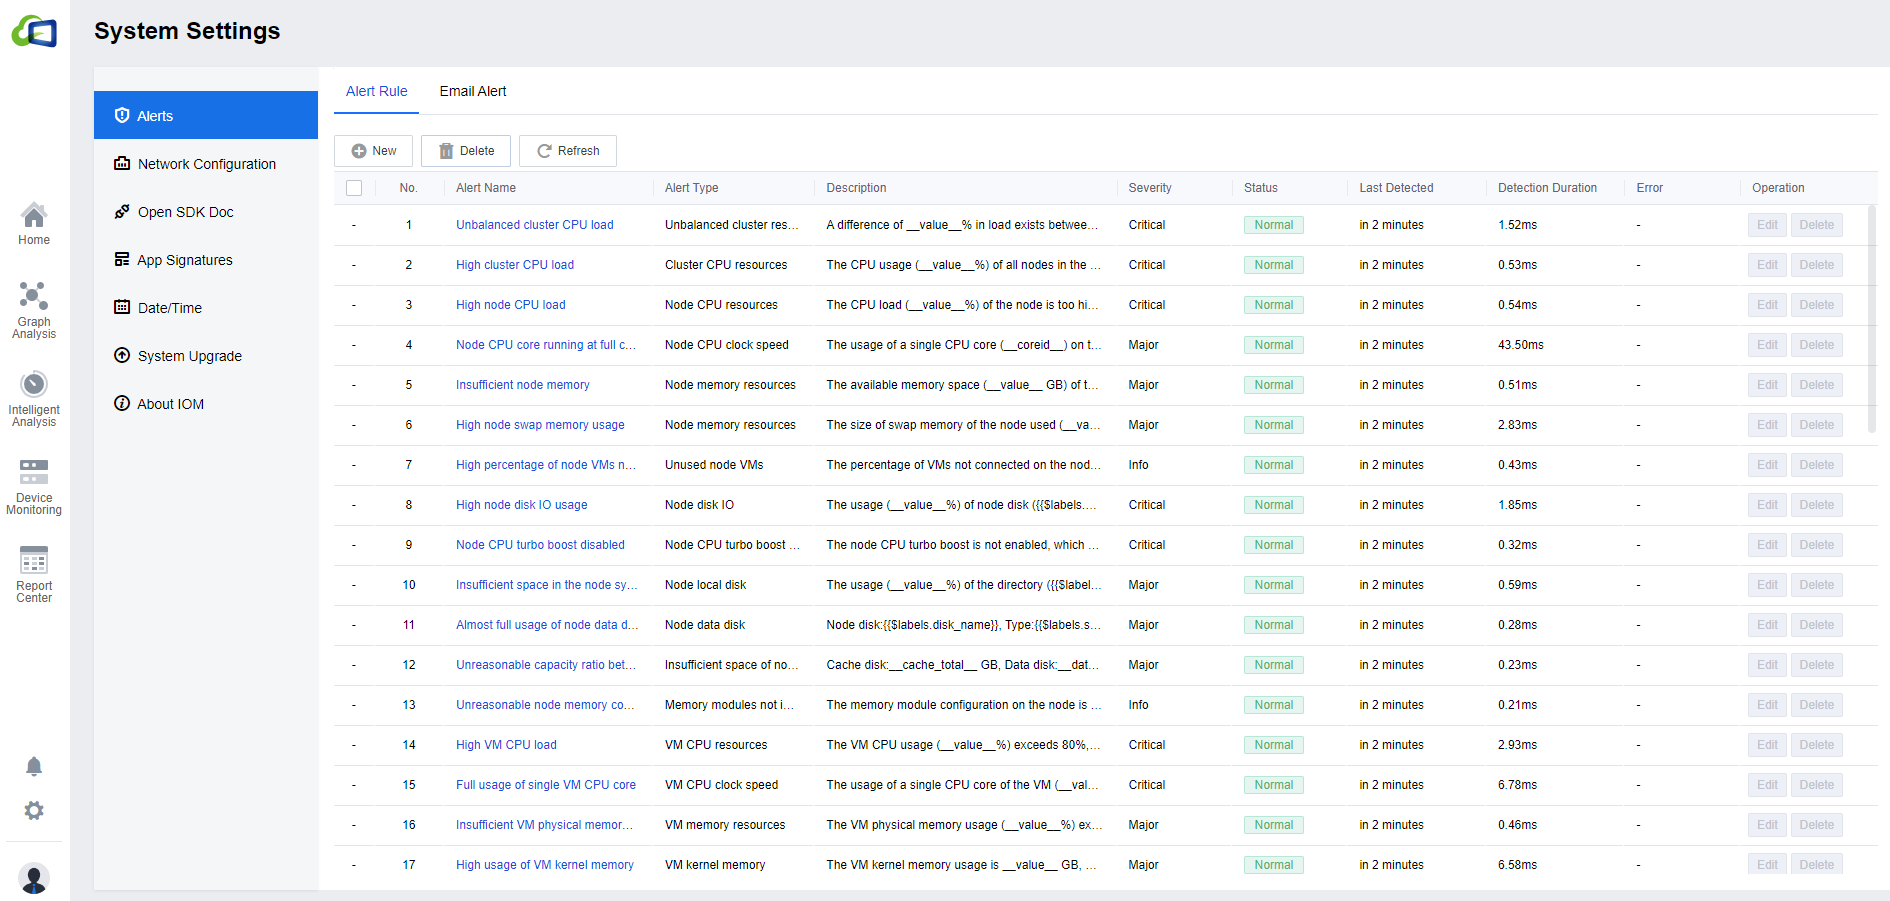
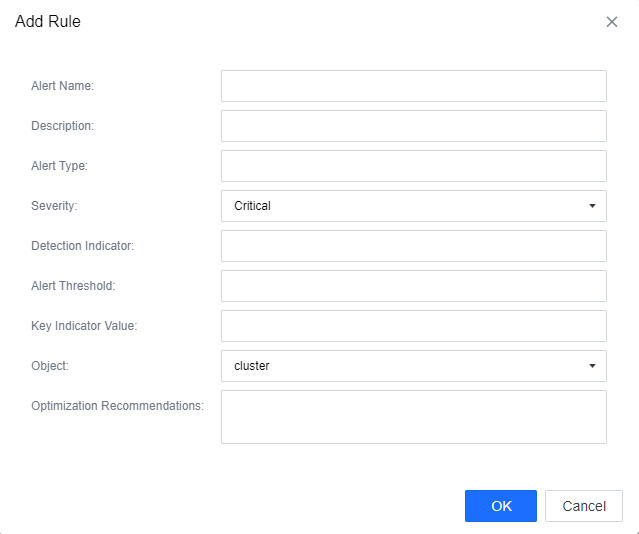
Click Delete to delete the alert rule, and click New or Edit to create a new alert rule or edit the alert rules.
Notice: Please keep the default settings of the alert rules; do not modify them to avoid problems such as inaccurate alerts.
None of the default rules can be deleted or edited.
If you need to add alerts, please contact the Technical Support engineers. Please do not add them by yourself to avoid data confusion.
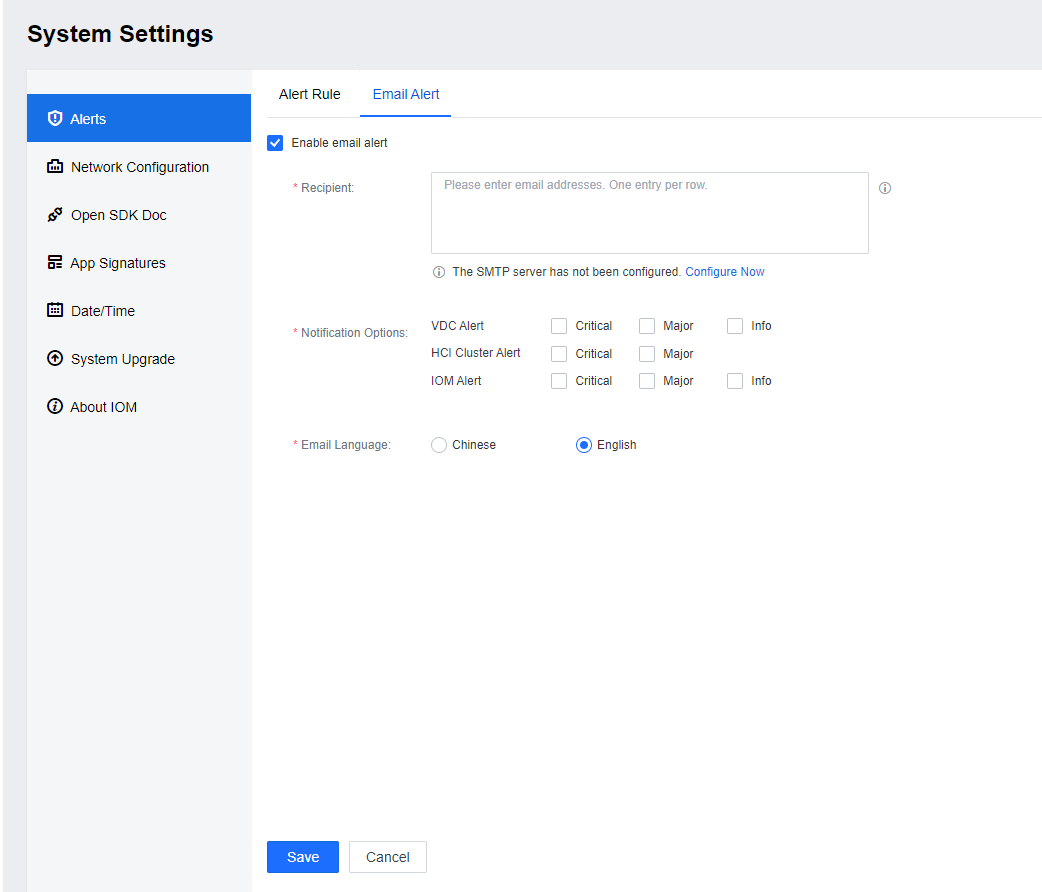
Email Alert
You can configure the email alert in the Alerts > Email Alert interface after configuring the SMTP server. After the configuration, you can click Send Test Email to test the function.
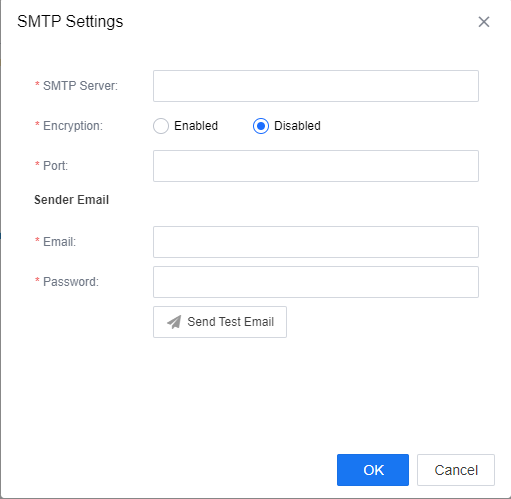
you can select the Notification Options according to the actual demand to avoid too many alert emails. Click Save after configure all the necessary parameters.
Note: Email sending only supports SSL-encrypted transmission.
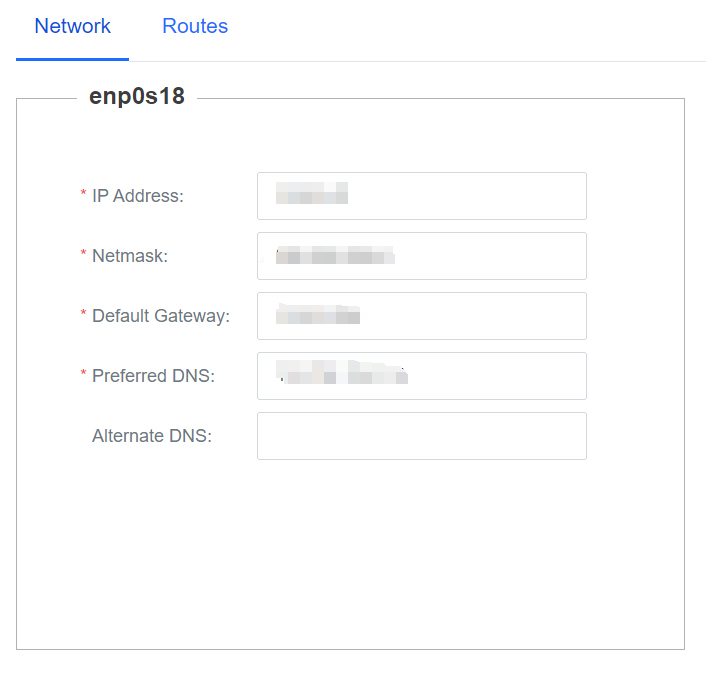
Network Configuration
The administrator can set the IP address in the initial deployment or subsequent modification in the System Settings > Network Configuration > Network. Routes can also be configured according to actual needs.

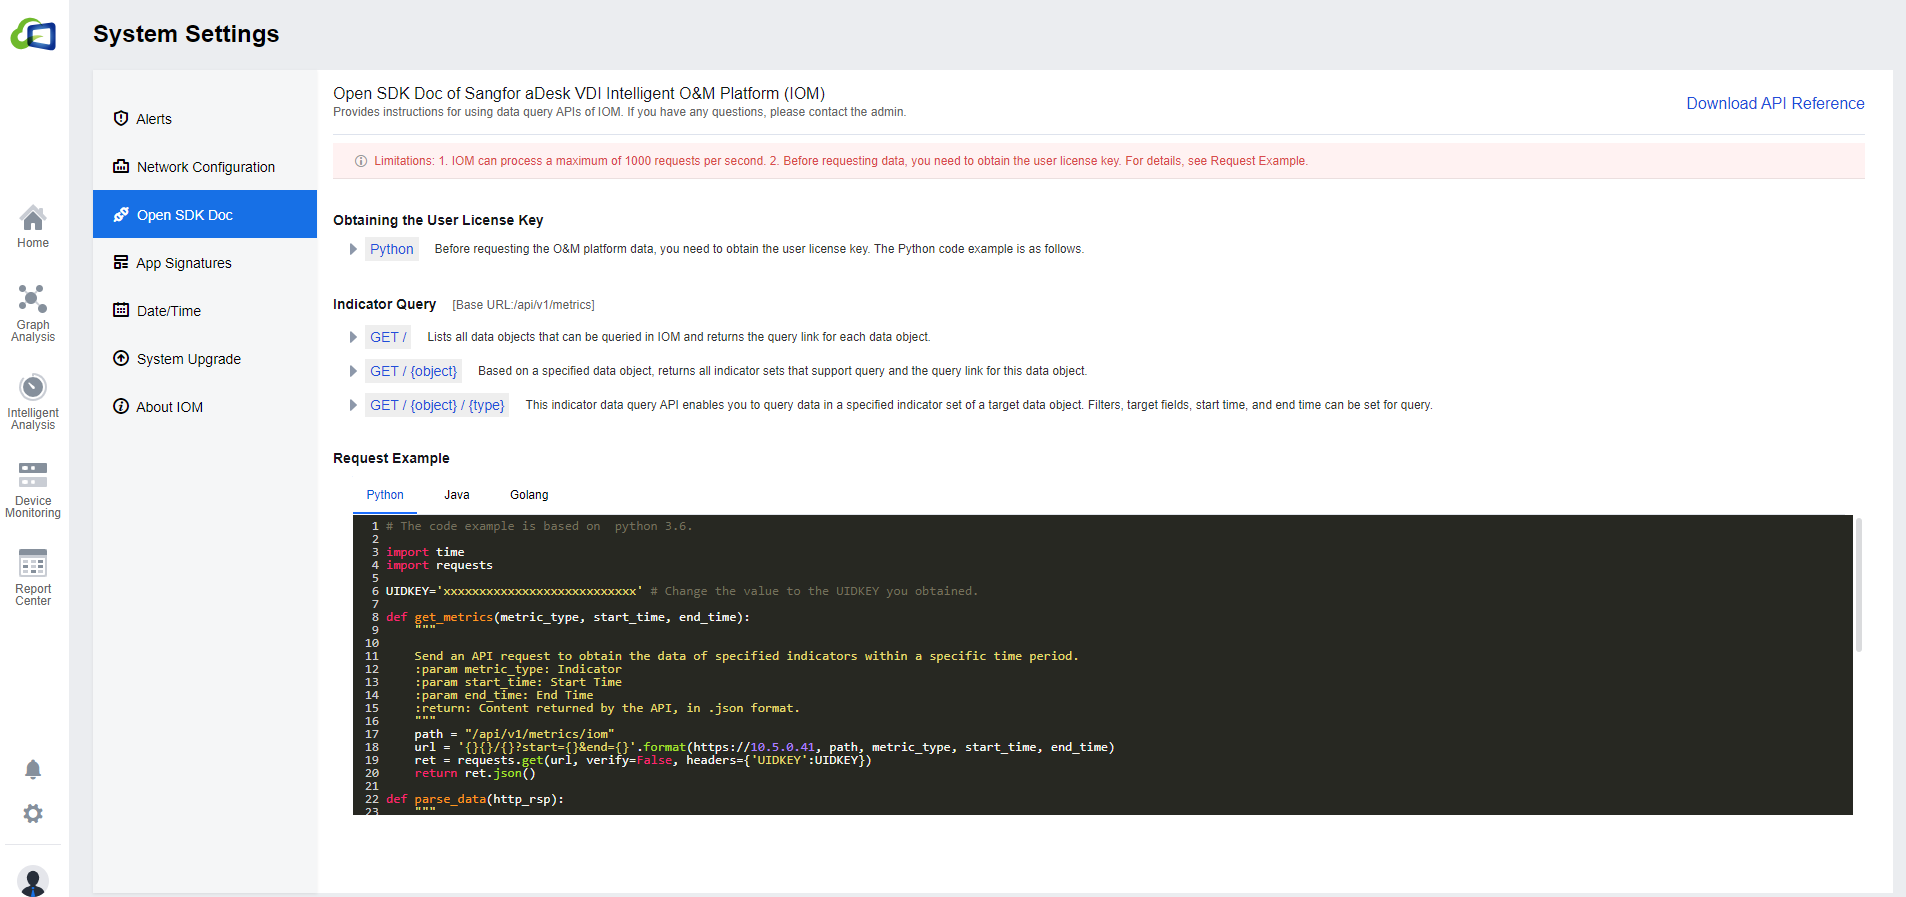
Open SDK Doc
Provides instructions for using data query APIs of IOM for users to integrate with third-party platforms. The default Request Example is Python, and you can click Java, or Golang to switch the corresponding sample code. You can also download the API reference by clicking Download API Reference in the upper right corner.
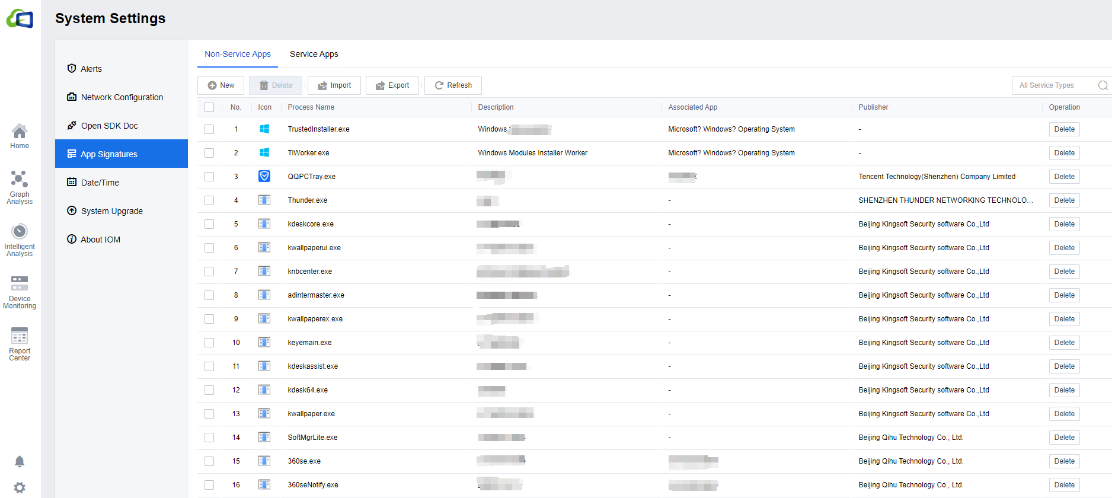
App Signatures
This module is an app signatures setting interface. The IOM platform has a built-in part of the process rule base to differentiate processes within the environment into Non-Service Apps and Service Apps, and the search bar supports fuzzy search.
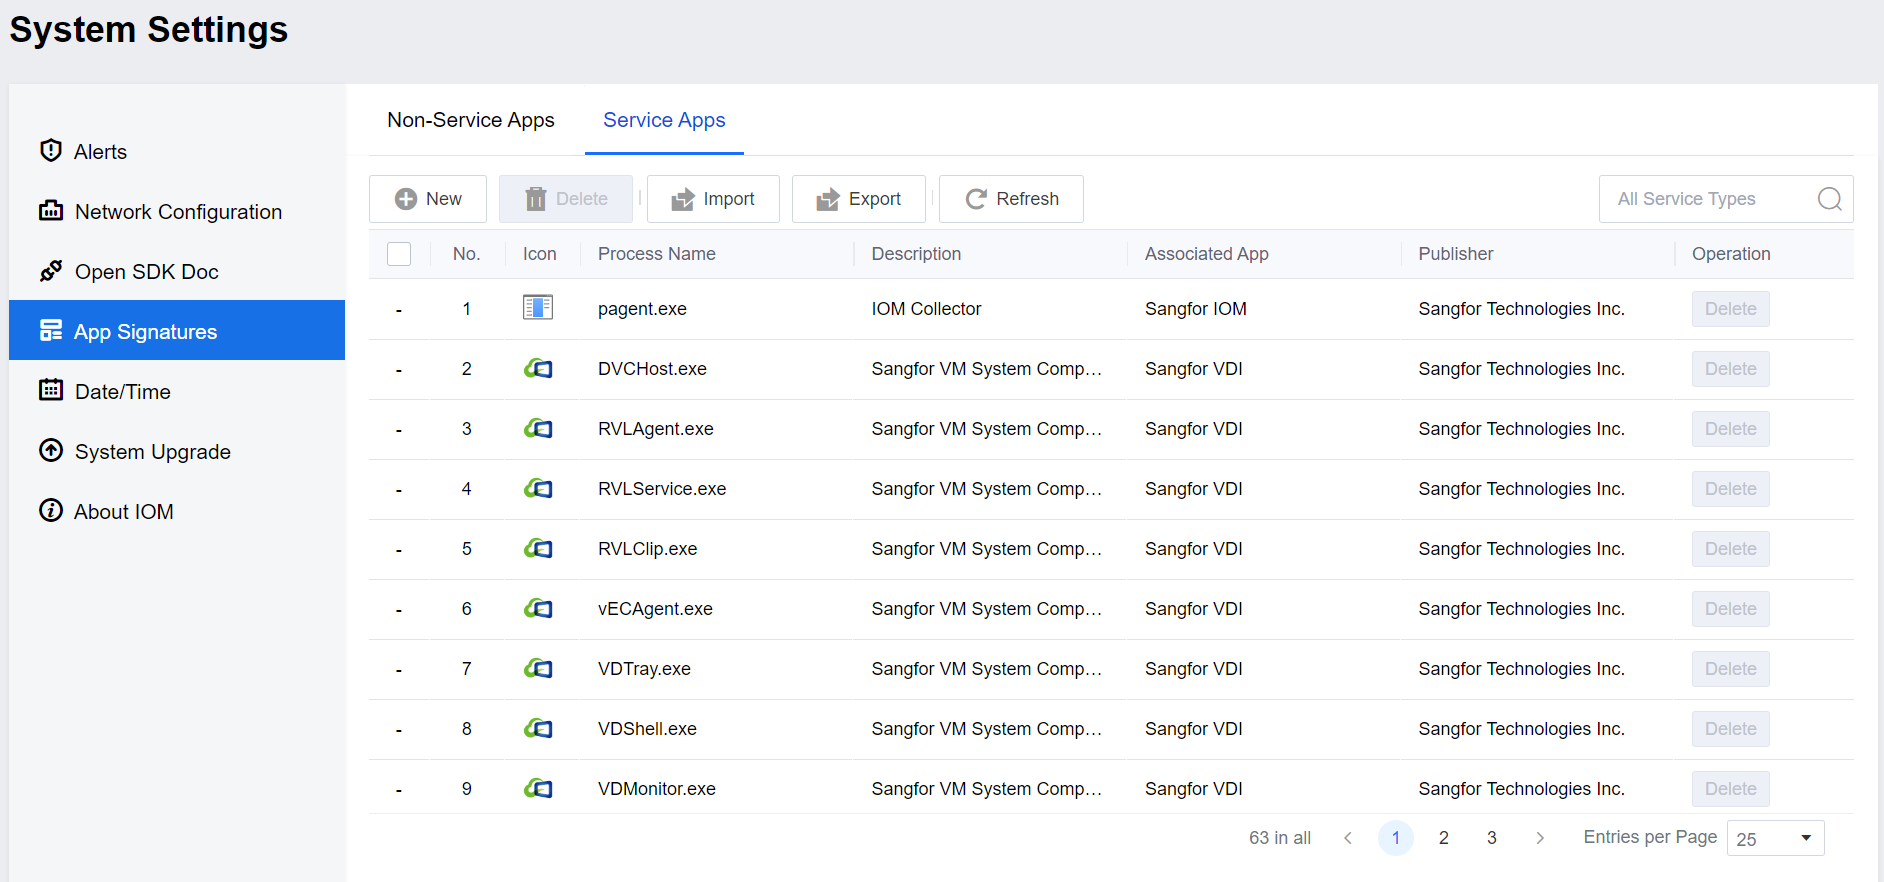
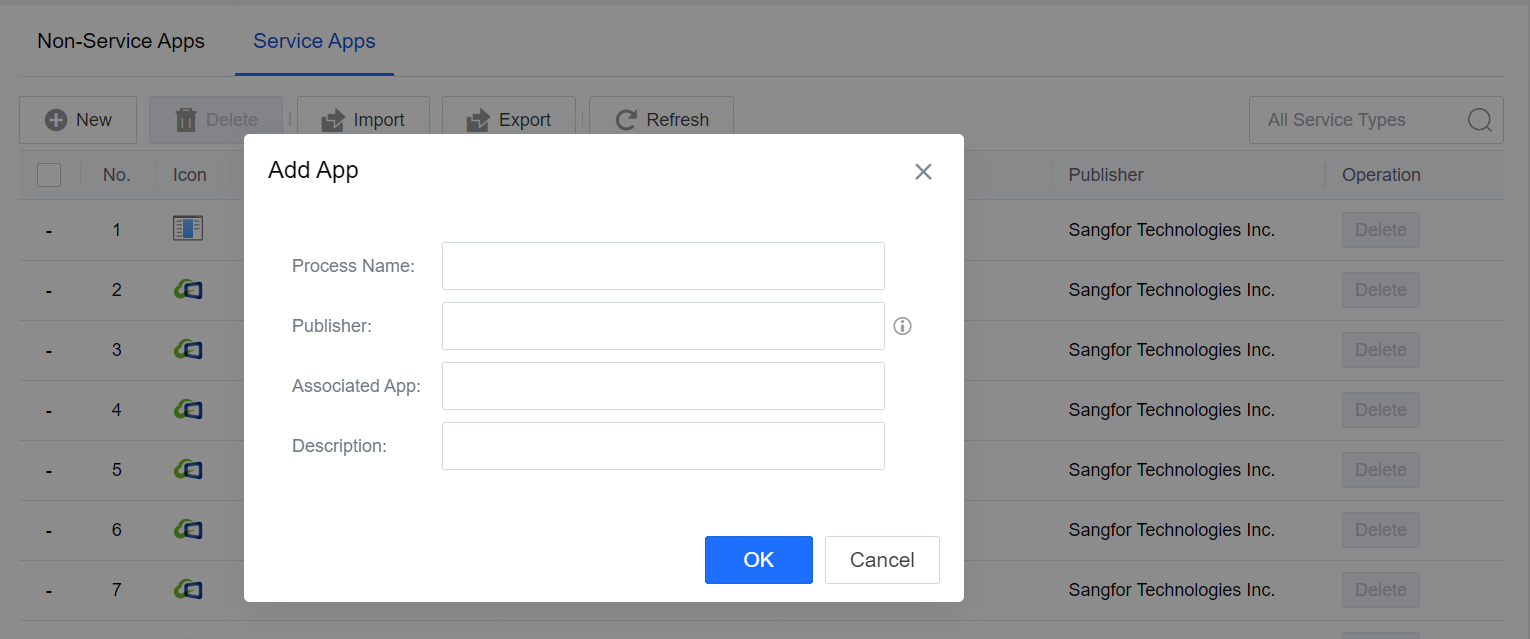
Click New to add an app to the corresponding signature.
Select the Process Name and click Delete to delete the signature.
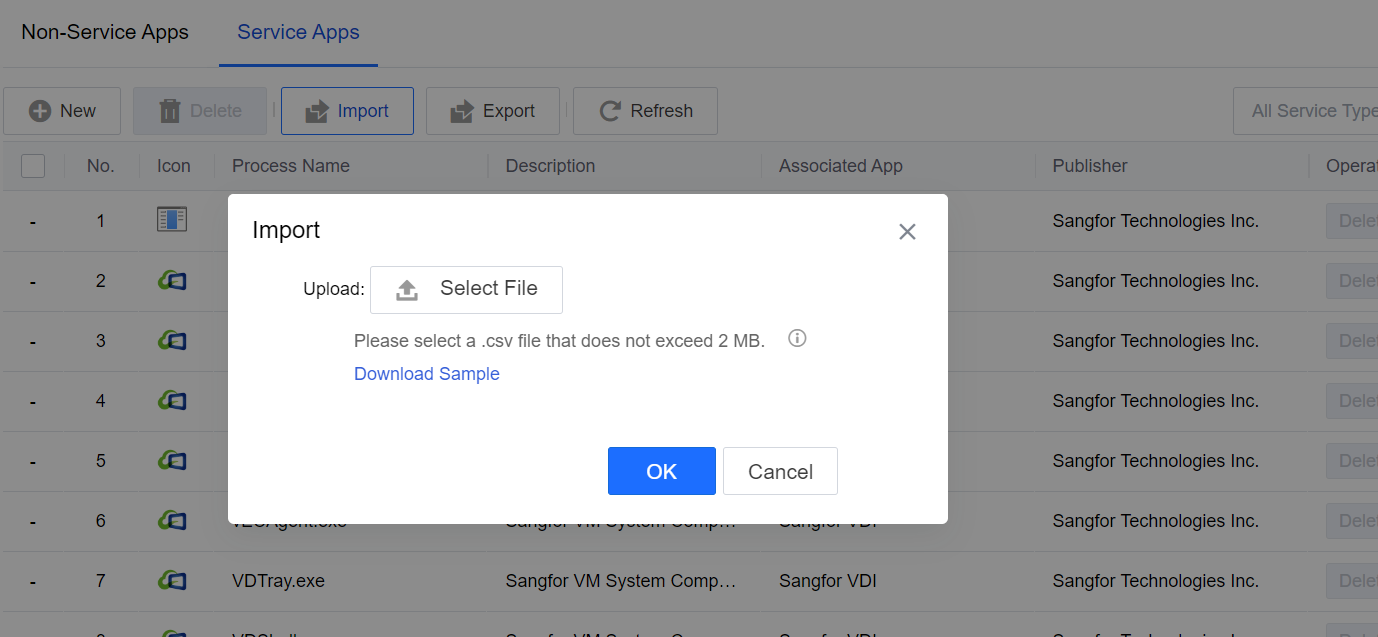
Click Import to import CSV format files. You can click Download Sample to refer to the import format.
Click Export to download the CSV file of the corresponding app signature locally.
Click Refresh for a real-time refresh.
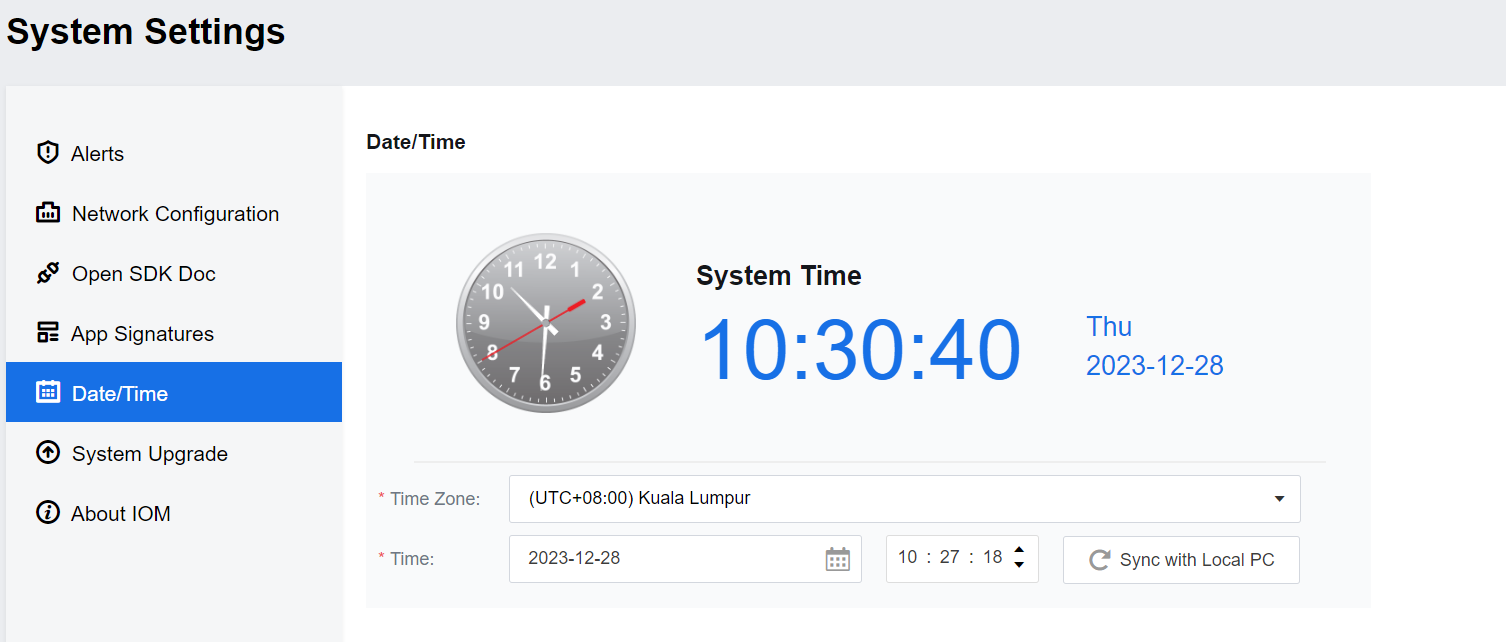
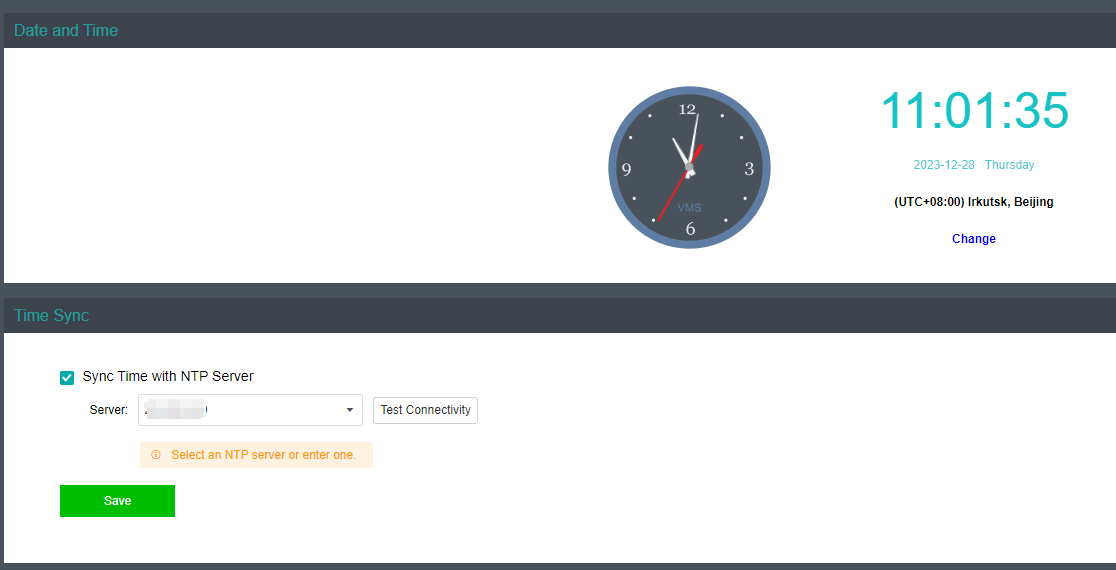
Date/Time
You can set the IOM system’s Time and Time Zone on this page. It also supports Sync with Local PC.
System Upgrade
Click Upgrade Now to upgrade your platform.
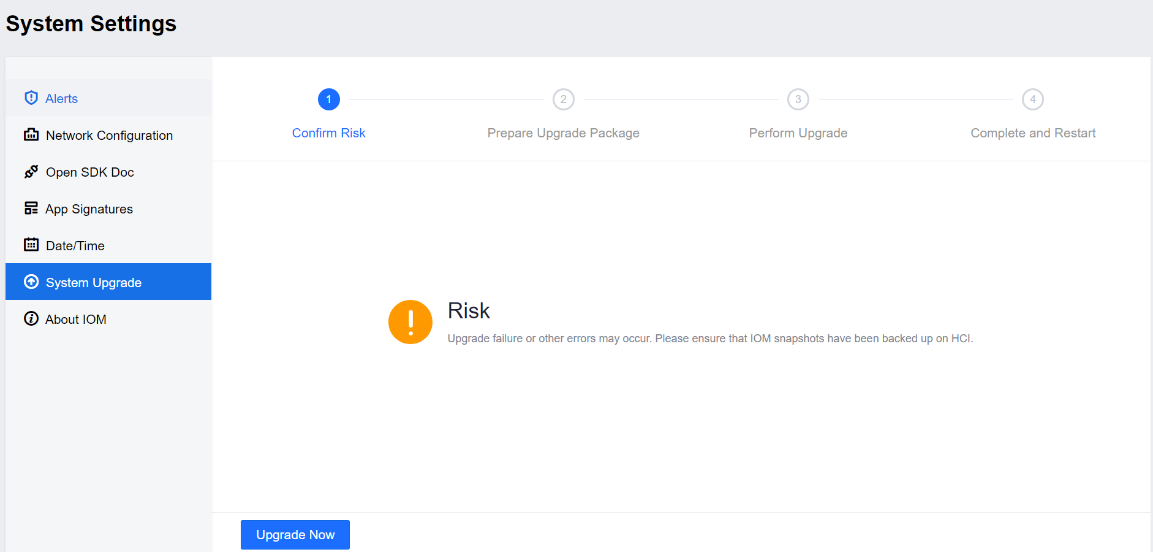
Note: Taking a snapshot backup of this VM before upgrading for quick rollbacks is recommended.
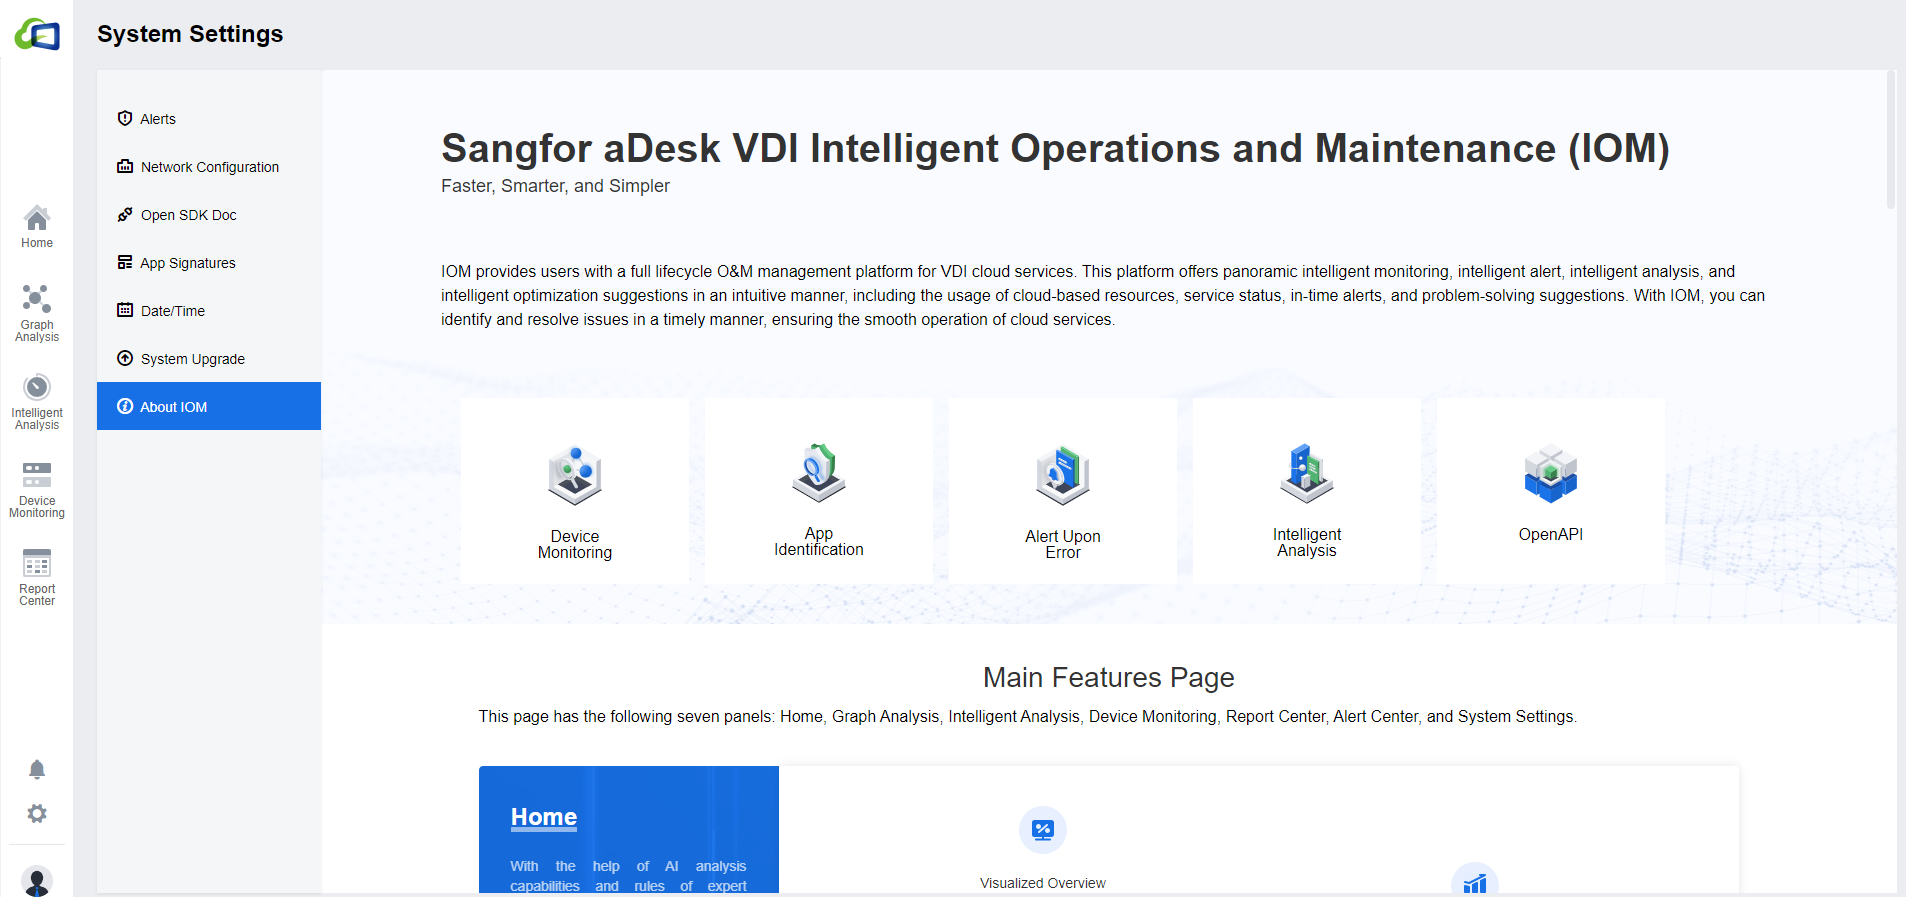
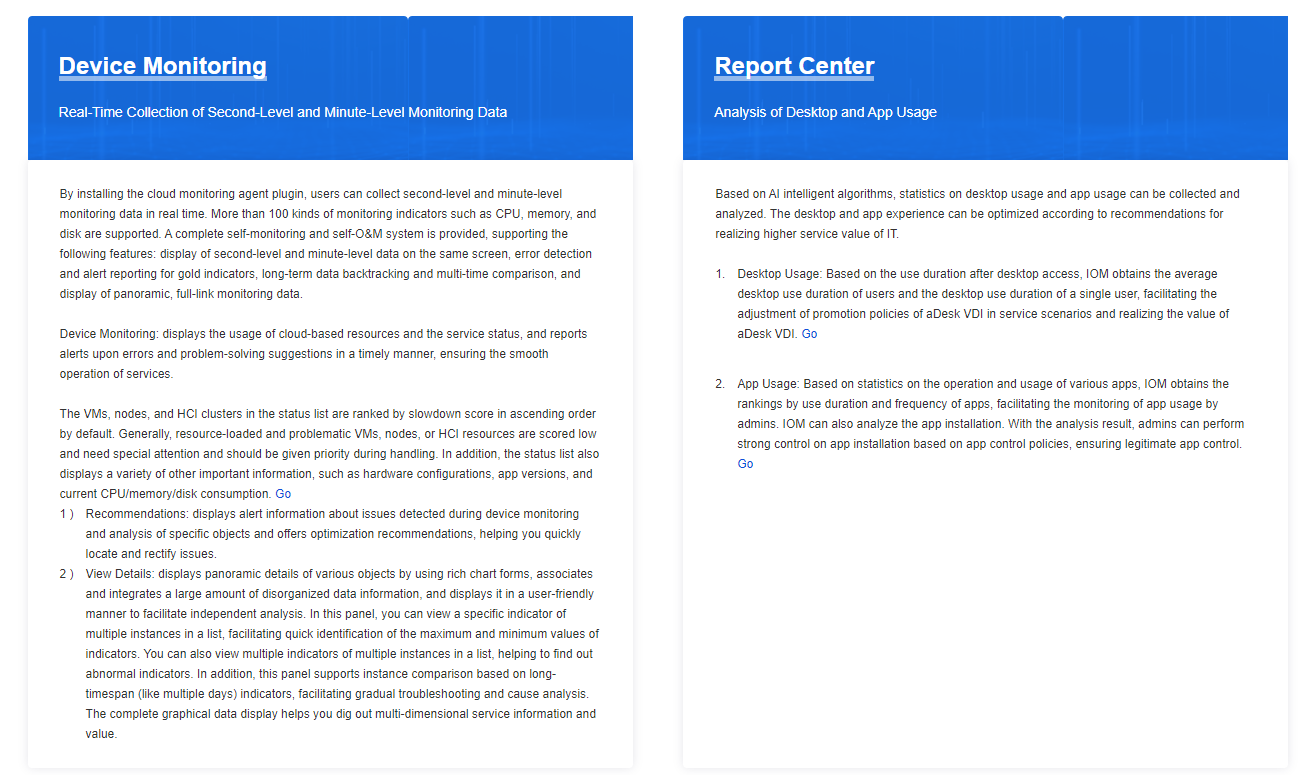
About IOM
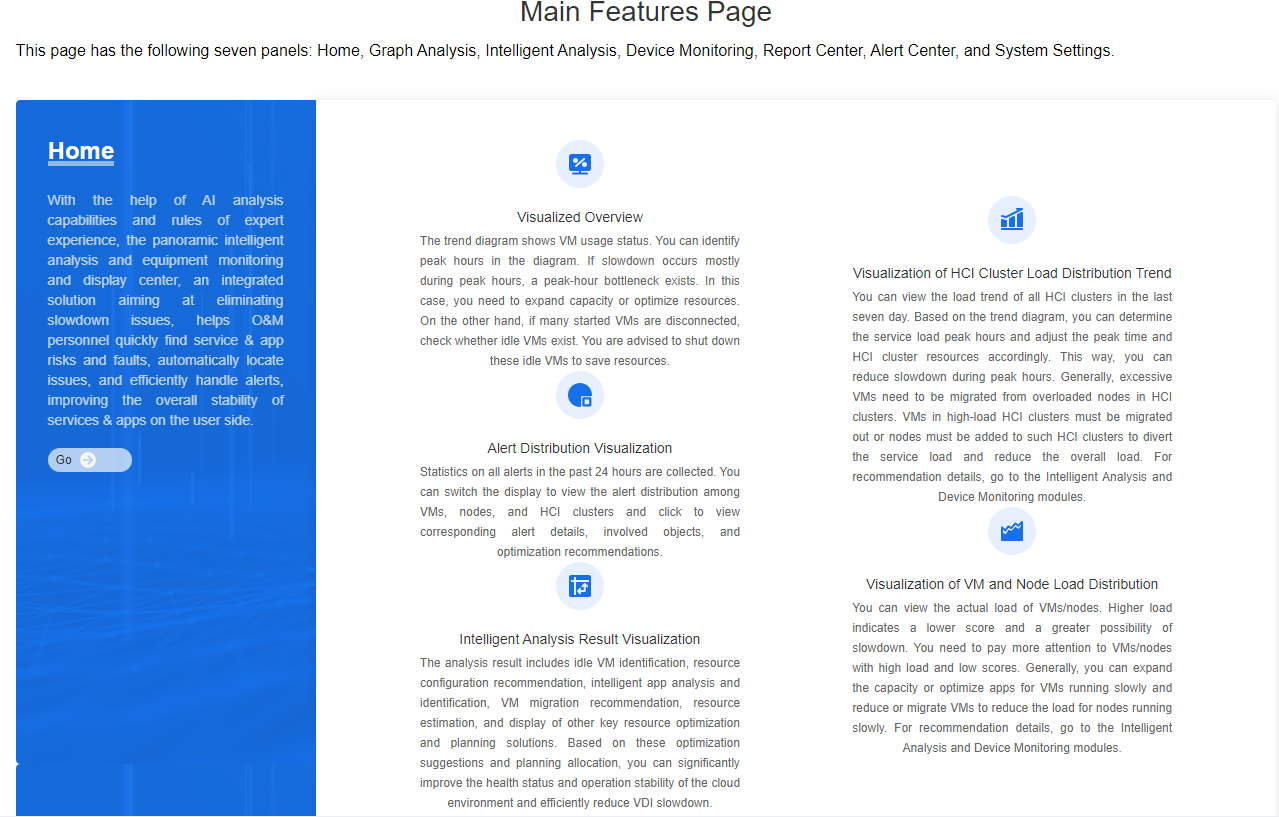
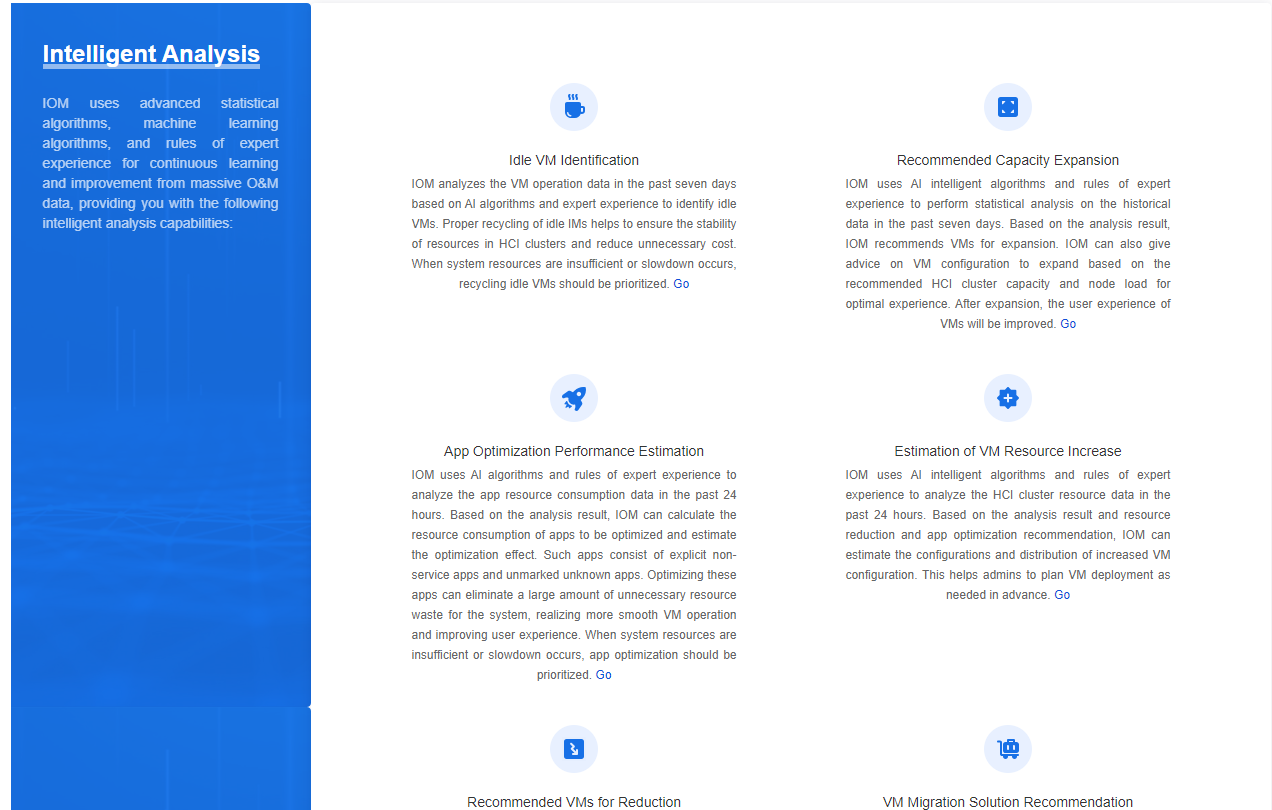
This page introduces the IOM functions and features. The Main Features Page has seven panels. Click Go on the corresponding panels to enter the corresponding function interface.
Deployment Precautions
IOM Upgrade
- After the upgrade, restarting the service takes about 10 minutes. During these 10 minutes, access to the IOM may be unstable.
- Pagent is upgraded one after another. Therefore, it can take up to 12 hours for all VMs to be upgraded.
- Do not turn off or power off the VM during the IOM upgrade. If something goes wrong, you need to contact technical support for assistance.
- Other FAQs:
- Cannot proceed to upgrade if Pagent signature validation error. Contact technical support to check whether the package is normal.
If Pagent is not working after the upgrade, you need to check the Pagent logs at C:\Program Files (x86)\Sangfor\SSL\VDI\Logs\pagent.log. Also, check whether the VM is normal.
Time synchronization issues
Suppose there is a situation where IOM can’t issue an alert. In that case, the most likely reason is that the system time is out of sync with the VMs and the Prometheus container strictly depends on the accurate time. At this point, you need to rebuild the Prometheus container:
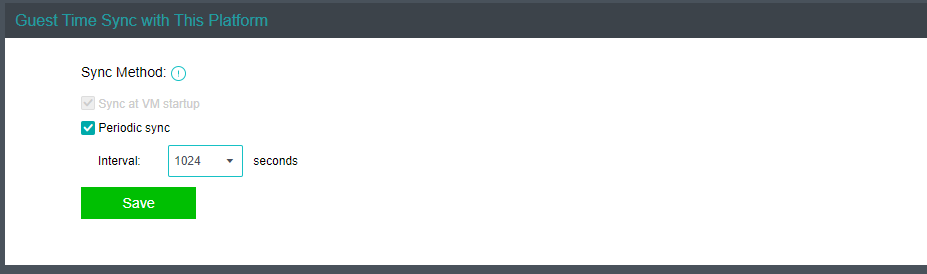
- Suppose the user has a unified time sync server. In that case, you can point the Hyper-Converged Infrastructure, Virtual Desktop Controller, user VMs, and IOM platform VM to that time sync server and then restart the IOM platform VM.
Alternatively, use HCI’s time synchronization mechanism and select Periodic sync to ensure that the time of all virtual machines on the HCI platform are synced.
Pagent Installation & Uninstallation
Pagent comes with the virtual machine’s agent, so you do not need to install it manually. If you need to uninstall and reinstall due to special circumstances, refer to the following ways.
Windows VM Pagent Installation and Uninstallation
You can manually install IOM’s Pagent inside the virtual machine (the virtual machine needs to have Pagent installed to be included in IOM’s monitoring and analyzing), and the Pagent download address is as follows: Pagent download address http://iom_ip:8023/package/.
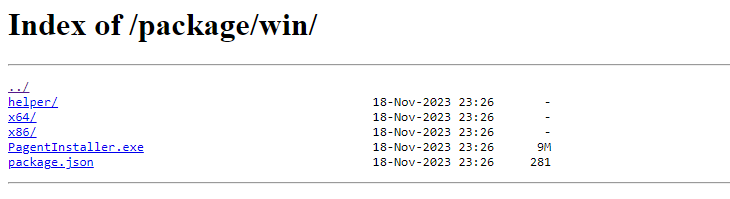
- Download PagentInstaller for Windows according to VM os.
- After successfully installing Pagent on a virtual machine, you can see the monitoring and analysis of the virtual machine’s data in the IOM platform after some time.
To uninstall Pagent, go to the folder C:\Program Files (x86)\Sangfor\SSL\VDI\pagent and execute uninst.exe to uninstall Pagent.
Other Issues
The web page gets stuck, or the request fails after being inactive for a while.
New requests get stuck, mostly because the session has expired, and you need to wait or press F5 to refresh the page.
Suppose the new requests report errors, mostly because someone upgraded the IOM platform from the backend. Press F5 to refresh the page and log in again.
- There are too many concurrent users, and they all make many time-consuming requests, resulting in server overload. You need to wait a while for the system to recover. After that, expand the IOM platform according to the actual situation.
- Wrong login password. Make sure the password is correct.
Someone may be upgrading the IOM platform from the backend, and you need to press F5 to refresh the page to resynchronize the secret key.
- Incomplete or mismatched data
Some devices have no data or show 10 VMs in the node, but only 8 VMs exist. The reasons are as follows:
- Time inconsistency between the IOM platform, HCI cluster nodes, and virtual machines. It is best to ensure that the time difference between all clusters, nodes, and virtual machines managed by an IOM platform is no more than 1 minute. Otherwise, incomplete data or no data issue will occur if the time difference is more than 5 minutes.
- Data is collected and updated once every 3 hours (e.g., OS version, number of node VMs, etc.), so there will be some delay.
Pagent is not installed, the version is incorrect, or the Pagent anomaly leads to the lack of data of the relevant device, which in turn affects the data display. In Device Monitoring, you can see the Collector Version, as shown below:
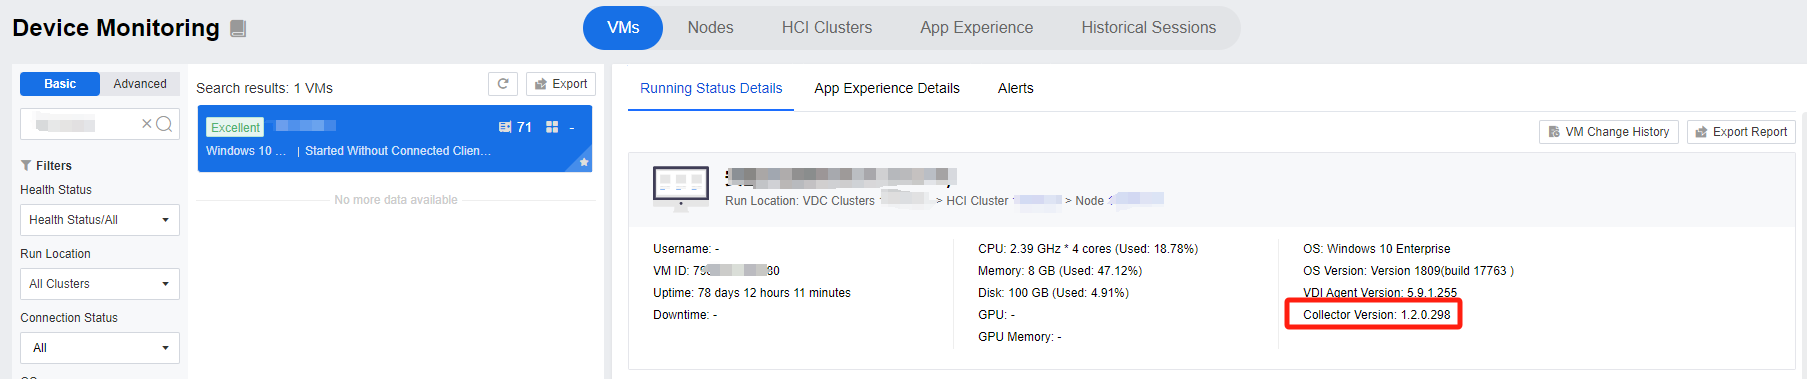
-
If the VM has been shut down, there will be no info.
-
Pagent is installed by a separate VM or device that is not under the control of HCI, and the data is reported separately, resulting in missing information such as node attribution.
-
Issues with session expiration and number of supported online users:
-
If the user logs in 30 minutes without operation(the operation that triggers the backend request), it will be automatically logged out, and the user needs to log in again.
-
Session expiration issue: even after 24 hours of continuous operation, the user will expire and need to log in again.
-
Currently, IOM supports only one admin account, but it supports 10 concurrent logins with the same admin account. If there are more than 10 user logins, the most inactive user will be logged out to make space for the newly logged-in user.
-
If a user changes the admin password, other online users using the same username will be invalidated and must log in again.
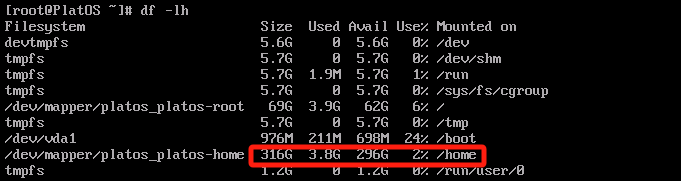
Disk Partition Issue.
- Generally, the /home partition should occupy over 80% of the entire disk.
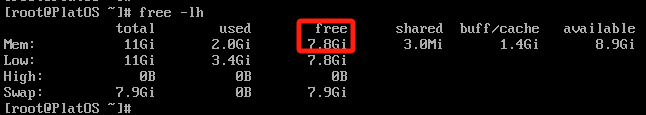
- IOM data is no longer updated, or there is no data(data anomaly), or there is a system lagging issue (capacity expansion required).
Check whether there is enough system memory. Command: free -lh.
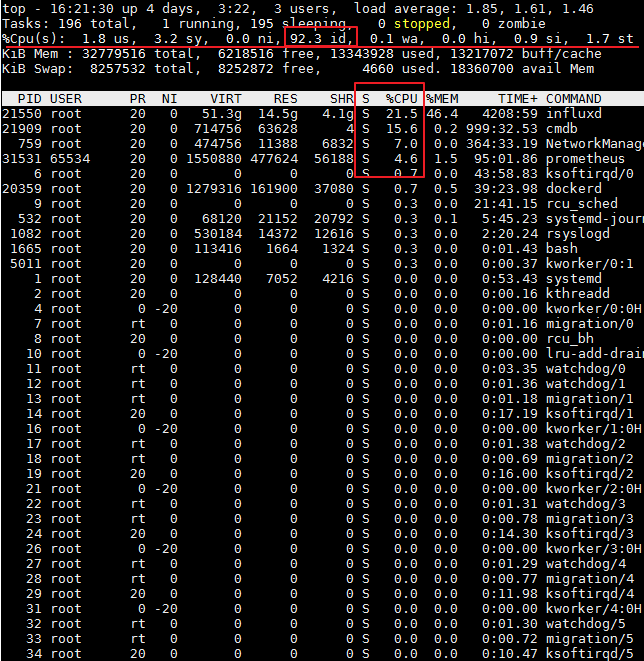
Check whether the CPU load is too high. The higher the value before the id, the lower the load.
Check whether the disk space is full. Command: df -lh.
- Refer to the link below to expand disk space: https://robermb.com/blog/geeks/how-to-extend-root-filesystem-using-lvm-in-centos-7-rhel-7/
IOM Platform Password Recovery Method
Go to the IOM server backend, account: root, password: J9@!A8Z6Lb@Zz(rL-O.
Delete the user password file: rm /opt/iom-platform/laganalyser/web/config/user.json -rf
Restart the web service: docker service update iomplus_web –force
- Log in with the initial password.
- The issue with No Data
Data flow of virtual machine monitoring data: Pagent > VM > Intermediate Network > HCI > IOM Server
- Check whether the network and ports between IOM, VM, and HCI are open.
- Check whether the IOM services and Pagent on the VM and HCI are running.
- Inspect firewalls, security apps, intermediate network security gateways, etc.
Unable to connect to IOM due to container IP Address conflict.
The main reason is that the IOM default IP is 172.17.x.x, 172.18.x.x, 10.0.1.x, and 10.0.0.x segments, and if the user’s IP segments are also within these segments, you need to change the container segments, or else there will be an IP conflict. The following is an example of a modified network segment, 10.200.x.x:
Modify the 172.17.x.x network segment
Stop the IOM service: /opt/iom-platform/laganalyser/deploy.sh stop
Check whether all docker processes are off: docker ps -a
Back up the configuration file: cp /etc/docker/daemon.json /etc/docker/daemon.json.bak
Modify the configuration file and add the content in red font: vi /etc/docker/daemon.json
{
"bip": "10.200.0.1/24",
"default-address-pools":[
{"base":"10.201.0.0/16","size":24},
{"base":"10.202.0.0/16","size":24}
],
"log-level": "info",
"userland-proxy": false,
"log-driver": "json-file",
"log-opts": {
"max-size": "10m",
"max-file": "3"
}
Remove original docker network: docker network rm irsapp.
Restarts the network(execution of this command does not affect service): systemctl restart network.
Restarts the docker(execution of this command does not affect service): systemctl restart docker.
Launch the docker service: /opt/iom-platform/laganalyser/deploy.sh
Modify the 172.18.x.x network segment
Stop the IOM service: /opt/iom-platform/laganalyser/deploy.sh stop
Check whether all docker processes are off: docker ps -a
Back up the configuration file: cp /etc/docker/daemon.json /etc/docker/daemon.json.bak
Modify the configuration file and add the content in red font: vi /etc/docker/daemon.json
{
"bip": "10.200.1.1/24",
"log-level": "info",
"userland-proxy": false,
"log-driver": "json-file",
"log-opts": {
"max-size": "10m",
"max-file": "3"
}
Disconnect original docker network: docker network disconnect -f docker_gwbridge gateway_ingress-sbox
Remove original docker network: docker network rm docker_gwbridge
Add a new docker network, and the command below is one command:
docker network create –subnet 10.201.3.0/24 –opt com.docker.network.bridge.name=docker_gwbridge –opt com.docker.network.bridge.enable_icc=false –opt com.docker.network.bridge.enable_ip_masquerade=true docker_gwbridge
Restart the docker service(execution of this command does not affect service): systemctl restart docker
Restart the IOM service: /opt/iom-platform/laganalyser/deploy.sh
Modify the 10.0.0.x and 10.0.1.x network segments
Stop the IOM service: /opt/iom-platform/laganalyser/deploy.sh stop
Check that all docker processes are closed: docker ps -a
Remove original docker network: docker network rm ingress
Remove original docker network: docker network rm irsapp
Add new docker network: docker network create –driver overlay –ingress –subnet=10.200.4.0/24 ingress
Add new docker network: docker network create -d overlay –subnet=10.200.5.0/24 –attachable irsapp
Restart IOM services: /opt/iom-platform/laganalyser/deploy.sh